"A tireless chronicler and commentator on all things climate" -NYTimes. Climate lead @stripe, writer @CarbonBrief, scientist @BerkeleyEarth IPCC AR7 lead author
I've created a new dashboard for The Climate Brink that is updated daily with ERA5 global mean surface temperature data. It includes daily anomalies, monthly and annual forecasts, and a bunch of interactive data visualizations: https://t.co/xXrvY4KFB3
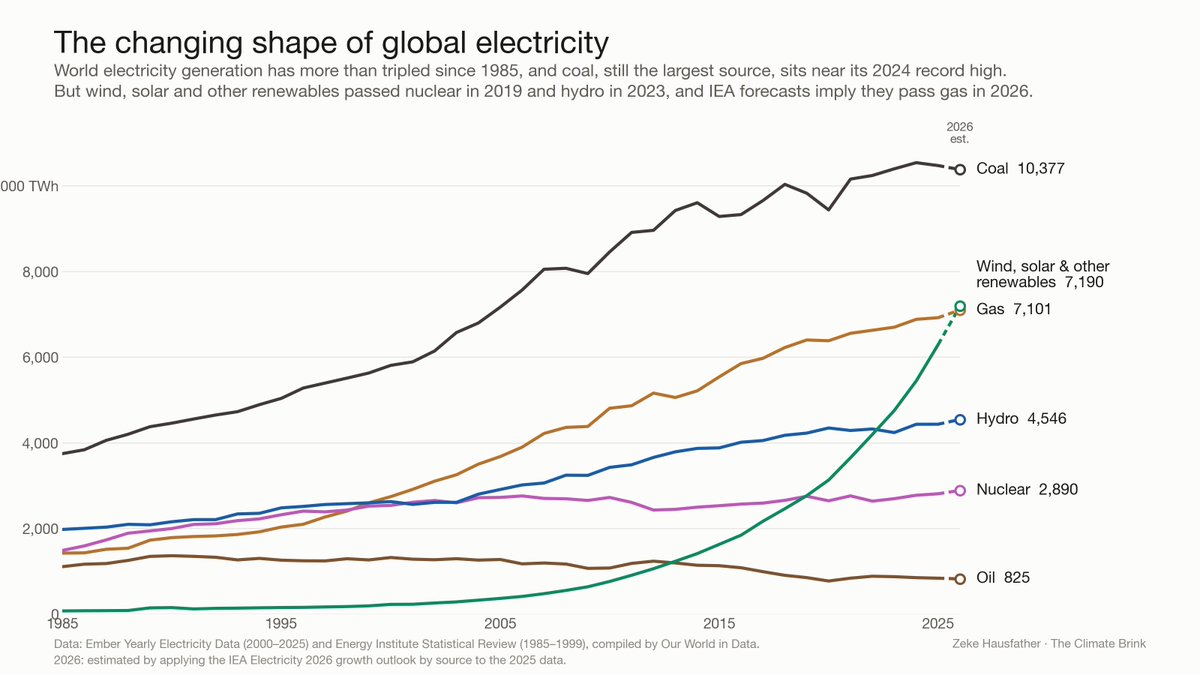
Non-hydro renewables (primarily wind and solar) are on track to pass gas this year as the second largest source of electricity generation globally. The rapid over the past 10 years is pretty remarkable!
Hat tip to Michael Liebreich for the plot idea.
@clivehbest We should also build more nuclear. But we need to figure out how to make it cheap (or nationalize the power sector) for it to really take off…
@danmiller999 I mean, if all that electricity came from coal emissions would be much higher. But yes, most emissions are not from electricity generation.
@eric23332 Sure, but extrapolating out like that brushes aside a lot of practical challenges that come from very high levels of variable renewable penetration.
If we break it down by individual technology, I estimate that in 2026 solar will be 10% of global electricity generation, wind 9%, and other renewables 2.5%.
One caveat: these plots only cover electricity, and there is lots of non-electric fossil fuel use (e.g. for heat)!
@RyanWeather It was the July with the highest TAvg CONUS temperatures. But not the highest TMax or the warmest everywhere.
But when we say “warmest X” we’ve traditionally meant TAvg.
With all August model runs now in (except for SINTEX-F), we now expect this year's El Niño event to peak sometime between October and December at a stunning 4C in the Niño3.4 region.
To see all the latest numbers, check out the Climate Dashboard (link below)
@ryankatzrosene@MikeHudema Scenarios with 4C warming by 2100 generally had a doubling of CO2 emissions by 2100 (e.g. SSP3-7.0), and some like SSP5-8.5 had CO2 emissions trippling (and reaching ~4.7C). Thankfully that now seems fairly implausible.
@scriber09 Wetter conditions around the El Nino tongue, dryer surrounding it, extremely high ocean heat (and coral bleaching), a bunch of regional teleconnections, and a record-shattering 2027 global temperature.
As always, daily-updated values can be found over at our Climate Dashboard. I've added a few additional El Niño features: new plots, options for absolute temperatures or different ENSO regions, etc.
There is also a csv download option to get the latest data for each plot! https://t.co/6xhFyCPdZr