#Ελλάδα: Η #Αθήνα ξεχωρίζει στην ελληνική αγορά των εμπορικών ακινήτων: το 2025 ηγείται σε αύξηση τιμών και ενοικίων, ενώ #Θεσσαλονίκη και υπόλοιπη χώρα έχουν πιο ήπια άνοδο. Οι τιμές πιο ευμετάβλητες από τα ενοίκια. Ισχυρή ανάκαμψη 2022-25 μετά κρίση και την πανδημία. #ακίνητα
#Athens Pulls Away: #Greece's Retail Property Market Splits in Two #CRE
2025 Trends: Athens leads growth in both prices and rents, while Thessaloniki and the rest of Greece show more moderate increases
Retail Price Index (RPI) — Year‑on‑Year Change 2007–2025 II
The Retail Price Index measures how the estimated market value of retail properties changes compared with the same period of the previous year.
2022–2025: Strong positive growth in several regions, especially Athens and Thessaloniki, indicating renewed investment interest and rising retail property values.
2020–2021: Pandemic‑related volatility.
2014–2019: Gradual stabilisation and mild recovery.
2009–2013: A sharp decline, reflecting the deep recession and collapse of commercial demand.
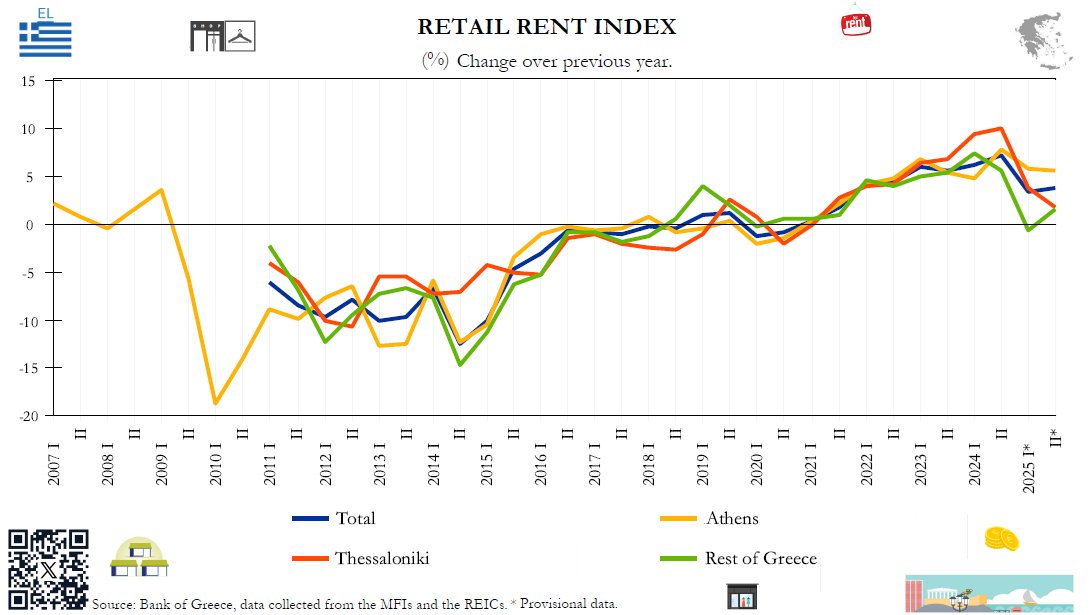
Retail Rent Index (RRI) — Year‑on‑Year Change 2007–2025 II
The Retail Rent Index tracks changes in rental prices for retail properties compared with the previous year.
It uses the same data sources (MFIs + REICs) and the same semi‑annual frequency.
2022–2025: Noticeable recovery, with several periods of positive rent growth, especially in Athens and Thessaloniki.
2020–2021: Pandemic‑driven declines.
2014–2019: Stabilisation and gradual improvement.
2010–2013: Deep negative rent growth, consistent with the collapse in retail turnover and widespread renegotiations.
Prices have generally been more volatile and, in the recent upswing, often stronger than rents.
Rents adjust more slowly because of lease inertia, legal constraints on rent reviews, and longer contracts.
Athens frequently shows larger swings (deeper fall in the crisis, stronger rebound later).
Thessaloniki and Rest of Greece often move with a lag or smaller amplitude.
#RealEstate#AI#PropTech: Why PropTech Has More Room to Grow in the US Than in Europe.
The US real estate market is, in many ways, more complex — and that complexity ends up creating more room for technology to step in.
PropTech keeps moving faster in the US for a simple reason: the American real estate transaction is built as a layered process.
A single deal can involve a listing agent, a buyer’s agent, a broker, a mortgage lender, a title company, an appraiser, an inspector, an attorney — and often a few more specialized providers depending on the state.
The exact roles and agency structures shift from one state to another.
But the underlying idea stays the same:
More participants. More handoffs. More data. More friction. More opportunities to automate.
Underneath all this, the US market is also fragmented in ways that aren’t always obvious. Property records are handled locally. There are hundreds of MLS systems. Agents are licensed state by state. Mortgage, title and transaction systems were built independently over time.
Thousands of companies and professionals have to connect these systems and workflows.
And every connection can turn into a software opportunity.
Europe works differently.
European real estate can be complicated too, but much of that complexity comes from the fact that each country has its own system. Germany is not France. France is not Spain. Spain is not Italy or Greece.
Different registries. Different legal processes. Different languages. Different financing structures. Different roles for agents, lawyers and notaries.
This makes cross‑border PropTech much harder to scale.
The key difference isn’t just fragmentation.
The US has one large market with a complex ecosystem inside it.
Europe has many markets, each with its own ecosystem.
You can see this clearly when you look at real‑estate agents.
In many European markets, a transaction may revolve around one main estate agent or agency, with a notary or lawyer stepping in at the legal stage.
In the US, the same transaction can involve several specialized roles — listing agent, buyer’s agent, broker — with different agency structures depending on the state.
So one European workflow can turn into several software opportunities in the US.
More roles. More data flows. More problems to solve.
That’s why complexity can actually be an advantage for PropTech.
The US doesn’t necessarily have a simpler real estate market.
In many ways, it has a more complicated one.
But it has something Europe often doesn’t:
a very large market where that complexity repeats itself.
When the same complicated problems happen millions of times, technology has a much bigger market to solve them.
This isn’t about saying the US is better or Europe is behind.
The two markets simply evolved differently.
Europe is fragmented across markets.
The US is fragmented inside one market.
And that difference matters for PropTech.
#RealEstateTechnology #HousingMarket
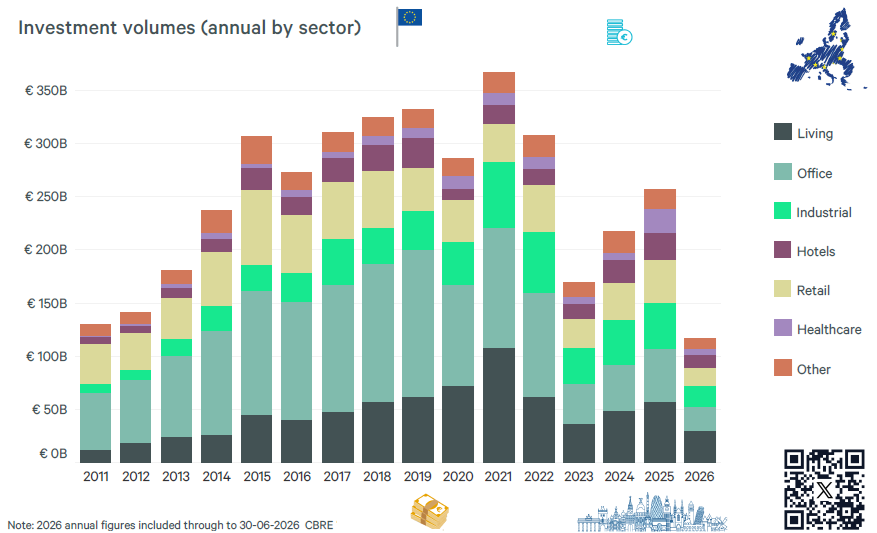
Επενδύσεις σε #Ευρωπαϊκά#ακίνητα το β΄ τρίμηνο 2026: 59,1 δισ. ευρώ (+10% ετησίως), ισχυρότερο από το 2022. Α΄ εξάμηνο ~118 δισ. Κυλιόμενο 12μηνο 266,8 δισ. (+18%). Ο οικιστικός τομέας κυριαρχεί και αντέχει. Τα γραφεία σταθεροποιούνται. Κάτω από ιστορικούς μέσους όρους. #CRE
#European#RealEstate Investment in billions of Euros Q2 2026
2024–2025: Investment rebounded significantly, climbing back up toward €260B in 2025.
2026 Status (H1): The total volume as of mid-2026 stands at around €118B. Because this only captures the first half of the year (through June 30), it indicates that annual activity is pacing steadily with the post-2023 recovery trajectory.
Q2 2026 investment: €59.1bn, up 10% YoY — the strongest Q2 since 2022
Rolling 12-month (R12M) volume: €266.8bn, up 18% YoY
Domestic investors: 54% of acquisitions vs. 46% cross-border
Transactions: 2,244 in Q2; 10,321 on R12M basis
Still below historical norms: Q2 was 8% below the 10-year Q2 average (narrowing to 7% below on R12M basis)
Living
The largest and most resilient sector in recent years. Its share grows significantly after 2018 and remains dominant through 2025–2026.
Office
Historically the largest sector (2011–2019). Its share declines after 2020 but begins to stabilise in 2025–2026.
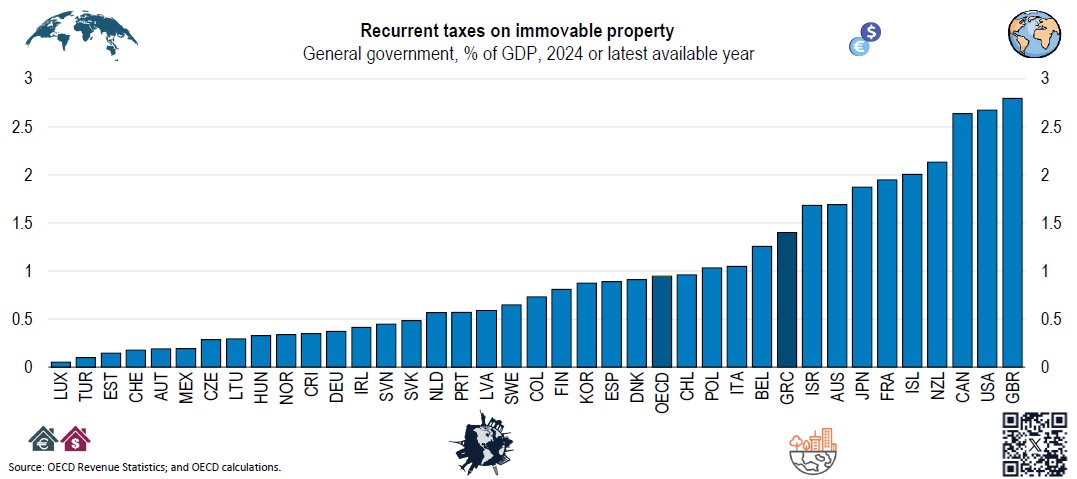
Recurrent taxes on immovable property as % of GDP: OECD
#Eurozone countries rely far less on recurrent taxes on immovable property than the UK, US, Canada, while #Greece stands out inside the Eurozone as one of the highest property‑tax jurisdictions, both in GDP share and in fiscal weight.
Why Greece is structurally high-tax on property
ENFIA is broad‑based and stable.
Greece compensates for low direct taxes (10.4% of GDP) with high indirect and property taxes.
Property taxation is a predictable revenue source in a system with historically volatile income‑tax collection.
Greece taxes immovable property more heavily (relative to GDP) than most of the Eurozone, including larger economies like Germany (not clearly labeled but typically low, ~0.4%), Spain, and the Netherlands.
Only France and Belgium among euro-area countries clearly tax property more heavily than Greece in this dataset.
The Eurozone as a bloc tends to cluster on the lower half of the ranking compared to Anglophone countries (UK, US, Canada, Australia, Israel), which dominate the top of the chart.
This is somewhat notable given ongoing debates in Greece about ENFIA (the Greek unified property tax) — the data suggests Greece's recurrent property tax burden is already comparatively high within the euro area, not low.
Στοιχεία ΟΟΣΑ για επαναλαμβανόμενους φόρους #ακινήτων ως % ΑΕΠ: η #Ευρωζώνη φορολογεί λιγότερο από ΗΒ, ΗΠΑ, Καναδά. Η #Ελλάδα από τις υψηλότερες στην Ευρωζώνη (μετά Γαλλία-Βέλγιο). Ο ΕΝΦΙΑ σταθερή πηγή λόγω χαμηλών άμεσων φόρων (10,4% ΑΕΠ).
Recurrent taxes on immovable property as % of GDP: OECD
#Eurozone countries rely far less on recurrent taxes on immovable property than the UK, US, Canada, while #Greece stands out inside the Eurozone as one of the highest property‑tax jurisdictions, both in GDP share and in fiscal weight.
Why Greece is structurally high-tax on property
ENFIA is broad‑based and stable.
Greece compensates for low direct taxes (10.4% of GDP) with high indirect and property taxes.
Property taxation is a predictable revenue source in a system with historically volatile income‑tax collection.
Greece taxes immovable property more heavily (relative to GDP) than most of the Eurozone, including larger economies like Germany (not clearly labeled but typically low, ~0.4%), Spain, and the Netherlands.
Only France and Belgium among euro-area countries clearly tax property more heavily than Greece in this dataset.
The Eurozone as a bloc tends to cluster on the lower half of the ranking compared to Anglophone countries (UK, US, Canada, Australia, Israel), which dominate the top of the chart.
This is somewhat notable given ongoing debates in Greece about ENFIA (the Greek unified property tax) — the data suggests Greece's recurrent property tax burden is already comparatively high within the euro area, not low.
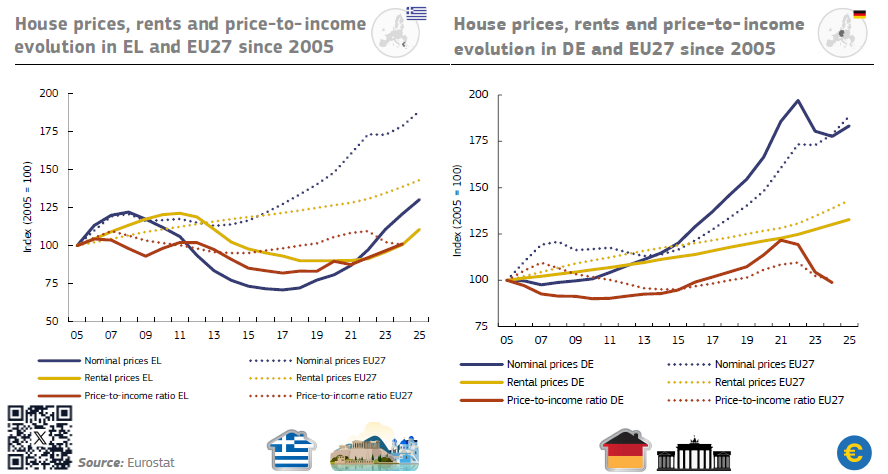
Nominal house prices, rental prices and the standardised house price-to-income ratio, all indexed to 2005 = 100, for #Greece and #Germany versus the #EU from 2005 to 2025
#HousePrices:
Greece (Bank of Greece): apartment prices up 5.7% y-o-y in Q1 2026, decelerating from 8.1% in 2025 and 9.1% in 2024. Strong post-2017 boom, well above the 2005 baseline in your chart.
Germany (Destatis): house prices up 1.4% y-o-y in Q1 2026, up 3.0% in Q4 2025 — fifth straight quarterly rise, but 3.2% for all of 2025 was Germany's first full-year gain since 2022, after the 2022–24 stagnation/dip visible in the chart.
Greece is decelerating from a much higher growth rate; Germany is only just resuming growth from a post-2022 correction. Greek nominal prices have grown faster on a 2005 basis for most of the period shown, but Germany's line still sits at a higher index level.
Rents:
Greece: rents dropped for years post-crisis (Eurostat: cumulative decline of about 9% over the 2015–2025 window) then reversed sharply — Eurostat's latest annual reading has Greek rents up 5.0% y-o-y, one of the EU's highest; a Q1 2026 comparison shows up 8.1%. This matches the late, steep upturn in your chart's Greek rental line.
Germany: rents have risen steadily and more gradually across the whole period — no comparable crash-and-rebound, consistent with the smoother yellow German line in the chart.
Price-to-income ratio:
Greece: dropped sharply 2009–2017 (income/wage stagnation plus price crash), then only partially recovered — still below its 2005=100 baseline through most of the series, now edging back up as price growth outpaces income.
Germany: broadly flat-to-rising for most of the period, with a visible spike around 2021–22 (cheap credit, price boom) followed by a pullback as ECB rates rose — the correction the chart shows around 2022–24.
Context (ECB)
Both countries' post-2022 kinks track the same driver: ECB rate hikes pushed housing-loan rates from near-zero to roughly 3.3–3.6% by 2026, cooling affordability everywhere — but Germany's price correction was sharper and faster than Greece's, whose valuation-based (not transaction-based) index tends to smooth out swings.
Bottom line:
Greece shows steeper price growth, more rent volatility, and a weaker income recovery. Germany shows smoother price and rent trends, but a sharper boom-and-bust in the price-to-income ratio around 2022.
Το ΔΝΤ καταγράφει πως στην #Ελλάδα, Ιταλία και Πορτογαλία οι οικογενειακές μεταβιβάσεις φέρνουν πολλούς ιδιοκτήτες χωρίς στεγαστικό δάνειο. Ενοικιαστές χωρίς επιδότηση δίνουν το 28-34% εισοδήματος. #Ελλάδα: άνω του 60%. #Ενοίκια#Αθήνας +50% έναντι μισθών +27%.
#Europe: Tenure Structure & Housing Cost to Disposable Income: #Renters vs. #Owners (with or without mortgages): IMF
- #Greece, Italy, Portugal: family-based transfers → more outright owners, fewer renters.
- Denmark has strong social housing, but EU-SILC classifies ALL Danish tenants as market-rate — so Denmark won't show a high reduced-rent share in this chart.
- Market-price renters: highest burden, ~28–34% of disposable income (not 30–35%).
- Reduced-rent renters: lower burden than market renters, but NOT the lowest overall. Order low→high: owners w/o mortgage → owners w/ mortgage → reduced-rent renters → market-price renters. Not "10–15%."
- Owners w/ mortgage: mid-range burden, rises with interest rates.
- Owners w/o mortgage: lowest structural burden, but energy costs still bite (e.g. Greece).
- Southern/Eastern Europe: owner-majority. Greece: >60% outright owners (IMF confirmed). Other GR breakdown figures (~12% w/ mortgage, ~10-12% market renters) are chart estimates, not published figures.
- EU-wide (Eurostat, 2024): 44.2% outright owners, 24.3% owners w/ mortgage; 21.1% market renters, 10.5% reduced-price/free.
- Greek housing stock is old/inefficient: only 7.4% reach energy class B+; Greek homes use ~65% more energy/m² than Portuguese ones (Portugal invested 2.5x more in upgrades). ENFIA + maintenance add to outright owners' costs.
- Renters most vulnerable: EU-wide, below-60%-median-income households spend 38.2% of disposable income on housing vs. 16.2% for above-60%
- Greece amplified: Athens rents +50% (2019–2024) vs. salaries +27% (IMF's own Greece data): house prices +85% since 2017 vs. disposable income +47%; rent inflation hit 10% in 2025.
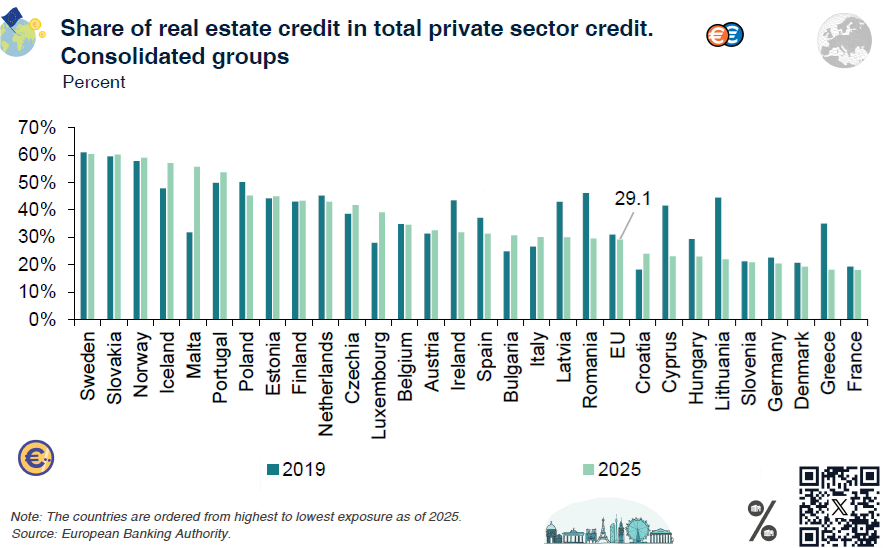
Μερίδιο πιστώσεων ακινήτων στο σύνολο ιδιωτικών πιστώσεων #Ευρώπης/#ΕΕ/ΕΟΧ, 2019 έναντι 2025.
#Ελλάδα κοντά στο τέλος (~17-18% το 2025, από ~35% το 2019) — από τις μεγαλύτερες μειώσεις.
Μέσος ΕΕ 29,1%. #RealEstate
#Europe: Share of real estate credit in total private sector credit 2019 vs. 2025
It measures the share of #realestate credit (mortgages + real‑estate corporate loans) in total private‑sector credit for each #EU/EEA banking system
#Greece is near the bottom, around 17–18% in 2025, down slightly from ~35% in 2019 — one of the largest declines shown
The chart compares each country's real estate credit exposure — the proportion of total private-sector lending tied to real estate — in 2019 versus 2025, ranked from highest to lowest 2025 exposure. It measures how concentrated bank lending books are in property, a key financial-stability indicator the EBA tracks for prudential risk assessment.
#HousingCrisis: The European Parliament resolution of 10 March 2026 on the housing crisis in the European Union with the aim of proposing solutions for decent, sustainable and affordable housing (published in the Official Journal of the EU, C/2026/4004, 26 August 2026) carefully avoids placing short-term rentals among the main causes of the housing crisis — a silence that looks more like a choice than an omission.
Long live lobbying!
Στο ψήφισμα του Ευρωπαϊκού Κοινοβουλίου (@Europarl_EN) «Housing crisis in the European Union with the aim of proposing solutions for decent, sustainable and affordable housing» https://t.co/qS7nJnF6nG (δημοσιεύθηκε στην Επίσημη Εφημερίδα της ΕΕ στις 26 Αυγούστου 2026), το κομμάτι που αφορά τις βραχυχρόνιες μισθώσεις ξεχωρίζει για την εξαιρετική του επιφυλακτικότητα/ φοβικότητα.
Το κείμενο είναι πολύ προσεκτικό και συμβιβαστικό: πρόκειται για ένα εξαιρετικά προσεκτικό, σχεδόν φοβικό ψήφισμα απέναντι στις βραχυχρόνιες μισθώσεις. Αναγνωρίζει το πρόβλημα, αλλά αποφεύγει να πάρει σαφή θέση ή να προτείνει ουσιαστικούς ευρωπαϊκούς περιορισμούς.
Αναγνωρίζει την πίεση που μπορούν να δημιουργήσουν οι βραχυχρόνιες μισθώσεις στη στέγαση, αλλά αποφεύγει να προτείνει συγκεκριμένο πανευρωπαϊκό περιορισμό. Ζητά πρώτα περισσότερα δεδομένα και μελλοντική αξιολόγηση, και αφήνει τις δύσκολες αποφάσεις κυρίως στα κράτη και στις τοπικές αρχές. Ακόμη και όταν αναφέρεται σε πιθανά περιοριστικά εργαλεία, επιμένει ότι πρέπει να είναι αναγκαία, κατάλληλα και αναλογικά.
Το ψήφισμα αποφεύγει επιμελώς να τοποθετήσει τις βραχυχρόνιες μισθώσεις ανάμεσα στις βασικές αιτίες της στεγαστικής κρίσης στην Ευρώπη— μια σιωπή που μοιάζει επιλογή, όχι παράλειψη. Αναγνωρίζει τα οικονομικά οφέλη του τουρισμού. Δεν ζητά πανευρωπαϊκή απαγόρευση ή ενιαίο περιορισμό, αλλά ζητά πρώτα περισσότερα δεδομένα και, στη συνέχεια, μια ολοκληρωμένη αξιολόγηση των επιπτώσεων. Αφήνει μεγάλο περιθώριο στα κράτη, στις περιφέρειες και στους δήμους να αποφασίζουν, υπό την προϋπόθεση της αναλογικότητας.
Το πιο εντυπωσιακό στοιχείο του ψηφίσματος είναι το πόσο προσεκτικά αποφεύγει τη σύγκρουση με το μοντέλο των βραχυχρόνιων μισθώσεων. Η ΕΕ αναγνωρίζει το πρόβλημα, ζητά δεδομένα και αφήνει τις δύσκολες αποφάσεις κυρίως σε εθνικό και τοπικό επίπεδο. Είναι μια Ευρώπη που περισσότερο μετρά και παρακολουθεί, παρά αποφασίζει και συγκρούεται.
@EU_Commission Τελικά, το lobbying παραμένει ισχυρό στο Ευρωκοινοβούλιο…@Europarl_EN
#Ελλάδα: Δείκτης τιμών #κατοικιών, Q1 2006–Q1 2026: +5,7% ετησίως το Q1 2026 (νεόδμητες +6%, παλαιές +5,5%). Θεσσαλονίκη +6,4%, τουριστικές περιοχές +6,9%, Αθήνα +5,2%. Η αγορά ομαλοποιείται (3-5% το 2026-27), όχι υπερθέρμανση. Οι υπόλοιπες περιοχές ξεπερνούν σε άνοδο την #Αθήνα
#Greece House Price index Q1 2006 – Q1 2026: Year-on-Year Change vs Price Index (2025=100)
The market is not correcting, it is normalizing. Expect 3-5% annual growth in 2026-27 rather than double digits, unless rates fall sharply. The key risk is not a price crash but a split market: prime, energy-efficient and touristic properties continue to outperform, while older, energy-inefficient stock in non-touristic areas lags.
Q1 2026: The Latest Breakdown
Annual growth: In Q1 2026, apartment prices increased +5.7% year-on-year nationwide.
New vs. existing flats:
New apartments (≤5 years): +6.0%
Old apartments (>5 years): +5.5%
Regional breakdown:
Athens: +5.2%
Thessaloniki: +6.4%
Other cities: +5.4%
Other areas (mainly touristic and islands): +6.9%
All regions show continued positive growth, but the driver has shifted from Athens to Thessaloniki and secondary touristic markets.
The Cycle in Numbers
2006-2007: YoY growth peaked around +8.5% then decelerated even before the index turned down.
2008-2013: Sustained contraction through the debt crisis. YoY change bottomed around -13% in 2012-13, with the index falling to its cycle low near 2017.
2014-2017: Stabilization. YoY change crosses back above zero around 2017.
2018-2022: Strong recovery phase. YoY growth accelerated to a cycle peak of roughly +15.5% around 2022-2023.
2023-2026: Growth decelerates, YoY easing to +5.7% in Q1 2026, while the index itself continues to rise to just above 103 (2025=100).
This deceleration is confirmed by official sources. Apartment prices rose 5.7% year-on-year in Q1 2026, after average annual growth of 8.1% in 2025 and 9.1% in 2024.
Nominal and Real (Deflated) residential property prices in selected #euroarea member states and selected advanced economies 2016 – Q1 2026: BIS
Southern #Europe is experiencing a housing boom, whilst Northern/Central Europe is seeing slight price corrections. #houseprices
Nominal and Real (Deflated) residential property prices in selected euro area member states and selected advanced economies 2016 – Q1 2026: BIS
Euro area vs advanced economies:
Euro area real prices: +2.6% yoy — a standout, since AEs overall are now negative
Within the euro area: Spain +10%, Italy +4%, Portugal remains the strongest/most elevated line on the chart (also +15% yoy, the top increase among all reporting jurisdictions), while France and Germany both posted small declines (−1% each)
Non-euro European AEs: +0.8%
Non-European AEs (bottom panels — Australia, Canada, UK, US): Canada is the clear outlier on the downside (−7% real), still well below its pre-pandemic and immediate post-2022 peak; US −2%, UK −2%; Australia +6% real, the strongest of that group
Globally, real prices fell -1.2% yoy in Q1 2026, driven mainly by Asia. Nominal global prices were still up +1.7%.
Since Q4 2019 (start of Covid), global real prices are only +2.7% higher.
Since the Great Financial Crisis 2007-09, global real prices are +20% higher.
European Divergence: There is a clear split in Europe. Southern Europe (Spain, Italy, Portugal) is experiencing a housing boom, while Northern/Central Europe (Germany, France) is seeing slight price corrections.
Επενδύσεις σε #ευρωπαϊκά εμπορικά #ακίνητα: €181 δισ. (12μηνο έως Q1 2026), +10% ετησίως. Μετά την διετή ανάκαμψη ήρθε η επιβράδυνση από εντάσεις στη Μ. Ανατολή, ενεργειακό σοκ και πληθωρισμό. Γραφεία +11%, logistics +7%. Παρατεταμένη ανάκαμψη.
Investment In European Commercial Real Estate on a rolling-12-month basis from 2009 through Q1 2026., €bn
Latest reading: €181bn (to end of March 2026), up +10% year-on-year from the Q1 2025 figure of €205bn shown as the prior marker — note the chart displays both points (181 now vs. 205 a year earlier isn't a contradiction; 205 is the 5-year average line reference, while 181 is the actual current rolling-year figure, +10% vs. the actual Q1 2025 figure).
After a two-year recovery, activity slowed in Q1 2026, reflecting geopolitical uncertainty tied to the Iran conflict/Middle East tensions, which triggered an energy-price shock and reignited inflation concerns.
Central banks (ECB) are now facing potential rate hikes rather than the cuts previously expected, which affects yield/pricing visibility.
Asset classes diverge: offices (+11% y/y) and logistics (+7% y/y) are still growing; retail and hotels are stabilizing after 2025's rebound rather than continuing to grow.
Report's overall framing: "elongated recovery" — slower, not derailed.
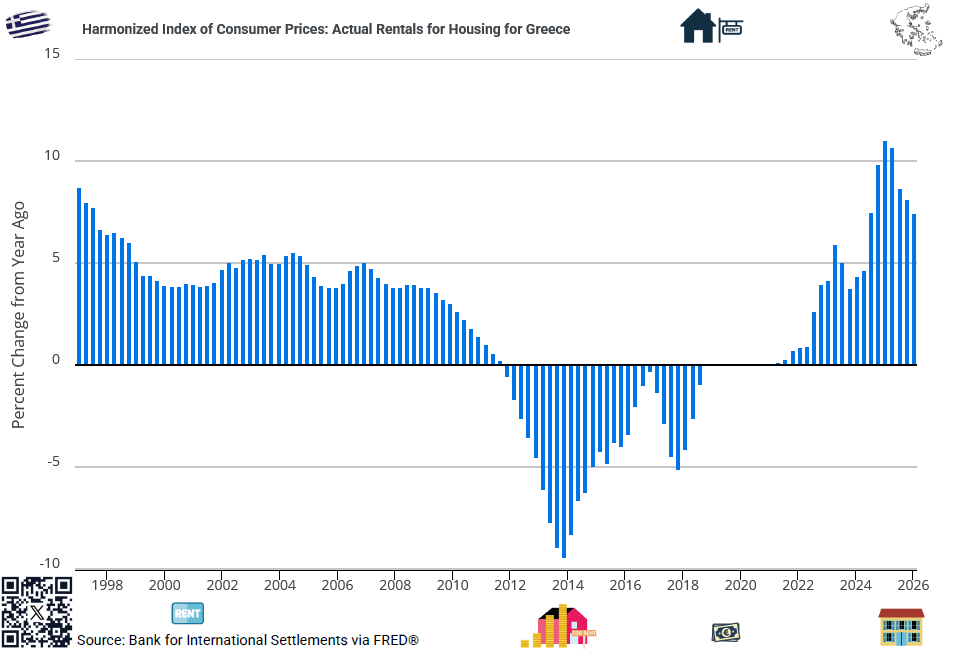
ΕνΔΤΚ #ενοικίων#κατοικίας στην #Ελλάδα (ετήσια % μεταβολή 1997–Q2 2026).
Ο πληθωρισμός ενοικίων επιταχύνθηκε 2022-26, κορυφώθηκε στο ~10-11% το 2025 και μετριάστηκε το 2026, παραμένοντας υψηλός λόγω στενής προσφοράς και βραχυχρόνιων μισθώσεων.
Harmonized Index of Consumer Prices (HICP): Actual #Rentals for #Housing in #Greece — Year-over-Year % Change, 1997 – Q2 2026
The Bank of Greece projected overall inflation at 3.8% for 2026 in its June 2026 forecast, reflecting continued price pressures across the economy, including housing.
2022–2026: Rental inflation accelerated sharply, peaking at around 10–11% year-over-year during 2025, before moderating in early 2026. Rental inflation remained elevated, although the pace of increase eased from its 2025 peak.
Greece has experienced strong and persistent rental-price pressures, reflecting tight housing supply, limited access to mortgage financing, and the expansion of short-term rentals in parts of the market. These factors help explain the broader market pressure but are not measured directly by the HICP rental series.
Οι πραγματικές (αποπληθωρισμένες) τιμές των #κατοικιών στην #Ευρωζώνη αυξήθηκαν μόλις 2,3-2,5% ετησίως το α' τρίμηνο του 2026, στη μισή τιμή των ονομαστικών 4,7%-5,1%. Ο πληθωρισμός «τρώει» τη μισή άνοδο. Σε τριμηνιαία βάση, η αύξηση σχεδόν σταμάτησε, μόλις +0,2%. #ακίνητα
#Euroarea Real (Deflated) House Price Index Q1 2000 – Q1 2026.
Year-on-year percentage change (%) and Price Index normalized with base year 2010 = 100.
In real terms, euro area #houseprices rose just 2.3–2.4% year-on-year in Q1 2026, while EU-27 real prices climbed 2.5% — roughly half the nominal headline figures of 4.7% and 5.1%.
That gap is inflation quietly eating into the "boom." Quarterly growth slowed even further, to a crawl of around +0.2%.
Volatility vs. Trend: While real prices reached an all-time high around 2021–2022, the 2022 policy tightening caused the fastest annual percentage drop in over two decades.
Real Values vs. Nominal: Because this chart tracks real prices (adjusted for inflation), the drop in 2022–2023 reflects both elevated consumer inflation destroying purchasing power and nominal price corrections.
2024–2026 (renewed recovery): Both series turn back upward — y/y growth recovers toward 3%+ and the index rises again, consistent with Eurostat's Q1 2026 release, which reported euro area nominal house prices up 4.7% y/y (and the EU up 5.1% y/y) as measured by the House Price Index, house prices increased by 4.7% in the euro area and by 5.1% in the EU compared with the same quarter of the previous year in Q1 2026.
Office Net Absorption, Stock Growth and Vacancy Rate (% of Stock) – Average of 41 European Markets from 2004 through historical data up to mid-2026, alongside forecasts reaching up to 2030.
Vacancy rose sharply after 2019, from a pre-Covid level of 5.6% to around 9.0% currently (Q1 2026), even surpassing the 2010 post-GFC peak of 9.8% in the earlier data.
Net absorption turned negative in 2024-25 as occupiers shrank their office footprints, similar to what happened in 2020 after Covid.
Going forward, vacancy is projected to peak around 2026 at roughly 9%, then decline to about 7% by 2030 as new supply stays limited (stock growth is forecast at just 0.6% p.a.).
Net absorption is expected to rebound over the next five years, averaging around 1.0% p.a. of stock — close to the pre-Covid 15-year average of 1.1% p.a.
#PropTech#RealEstate#EU: Idealista isn't yet operating as a full-fledged real estate marketplace in France. The company set up a French entity back in May and brought in a country head, but the actual product still isn't there: right now, the French version of the site mostly shows listings from Spain, Italy, and Portugal — not a proper national search engine for France.
That makes sense, given how crowded the market already is with established players like leboncoin, SeLoger, Bien'ici, and PAP. Bien'ici is probably the closest technological match, leaning heavily on maps and data.
#RealEstate#PropTech#AI: Leads vs. Asking Prices: How Real Estate Portals Shape the Housing Market Differently in the US and Europe.
Competition among real estate portals in the US and Europe follows two different playbooks.
In the US, the fight is over the listing itself. Who controls the data. Who gets usage rights to the photos. How it's presented. Who gets the lead,
In Europe, the fight is over traffic. Whoever owns the audience owns the market.
But look past the mechanics, and both sides end up doing the same thing: shaping the market itself, just through different levers.
- In the US, real estate portals decide which agents reach which buyers. That's real power. It shapes agent income. And agent income shapes pricing behavior, even if the link to final sale prices is indirect.
You’ve seen this play out again in recent days. The FTC accused Zillow of paying Redfin $100 million to step back from rental listings for nine years. With less competition, landlords paid about 14.5% more per listing, according to the FTC. This past Monday, right before trial, Zillow settled. Redfin must return to rental advertising within six months. No admission of wrongdoing — but the terms make clear what the fight was really about: not traffic, not ranking, but control over listing access and the value of that access.
- In Europe, it’s simpler on the surface. Real Estate Portals capture most of the buyer traffic. So the asking prices on those portals become the reference point. Everyone looks at them — buyers, sellers, agents. And because asking prices dominate the visibility layer, they end up pulling expectations — and often final transaction prices — upward.
Not through leads. Through visibility.