Associate Professor at UNC Greensboro. Lover of running, lobster rolls, Radiohead, and the beach. Also fond of social psych, brains, and long term goals.
It's that time again...I am recruiting students for the MA and PhD programs in experimental psychology at UNCG! If you are interested in person perception, stereotyping, prejudice in younger and/or older people, do apply! https://t.co/qv6jgxagYw
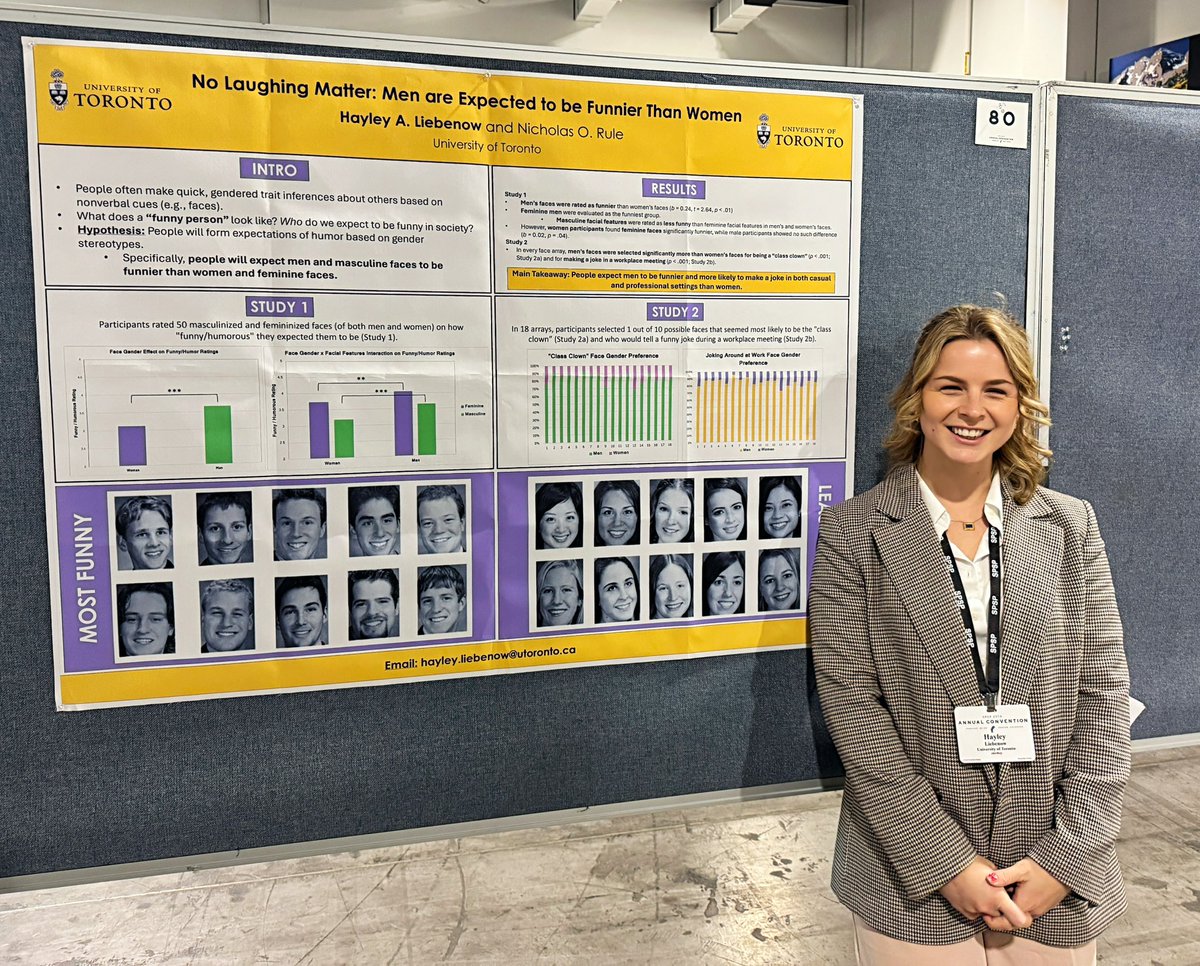
No Laughing Matter: Men Are Expected to be Funnier Than Women 🎭
Do people really believe that “women aren’t funny”? We found that people expect men to be funnier and more likely to make a joke in both casual and professional settings.
Excited to continue this work! #SPSP2025
Zip Code 02115, consisting of the West Fens, Kenmore Square, and Back Bay neighborhoods of the City of Boston, is the priciest median residential real estate zip code in the United States at $2,663 per square foot.
Study finds that framing a gender gap as "men's overrepresentation" instead of "women's underrepresentation" in political leadership elicits more anger at the disparity among women & leads women to take action, but not men. @EBalcetis
https://t.co/csjz2T7KVq
Let me take you back for a moment to 2018.
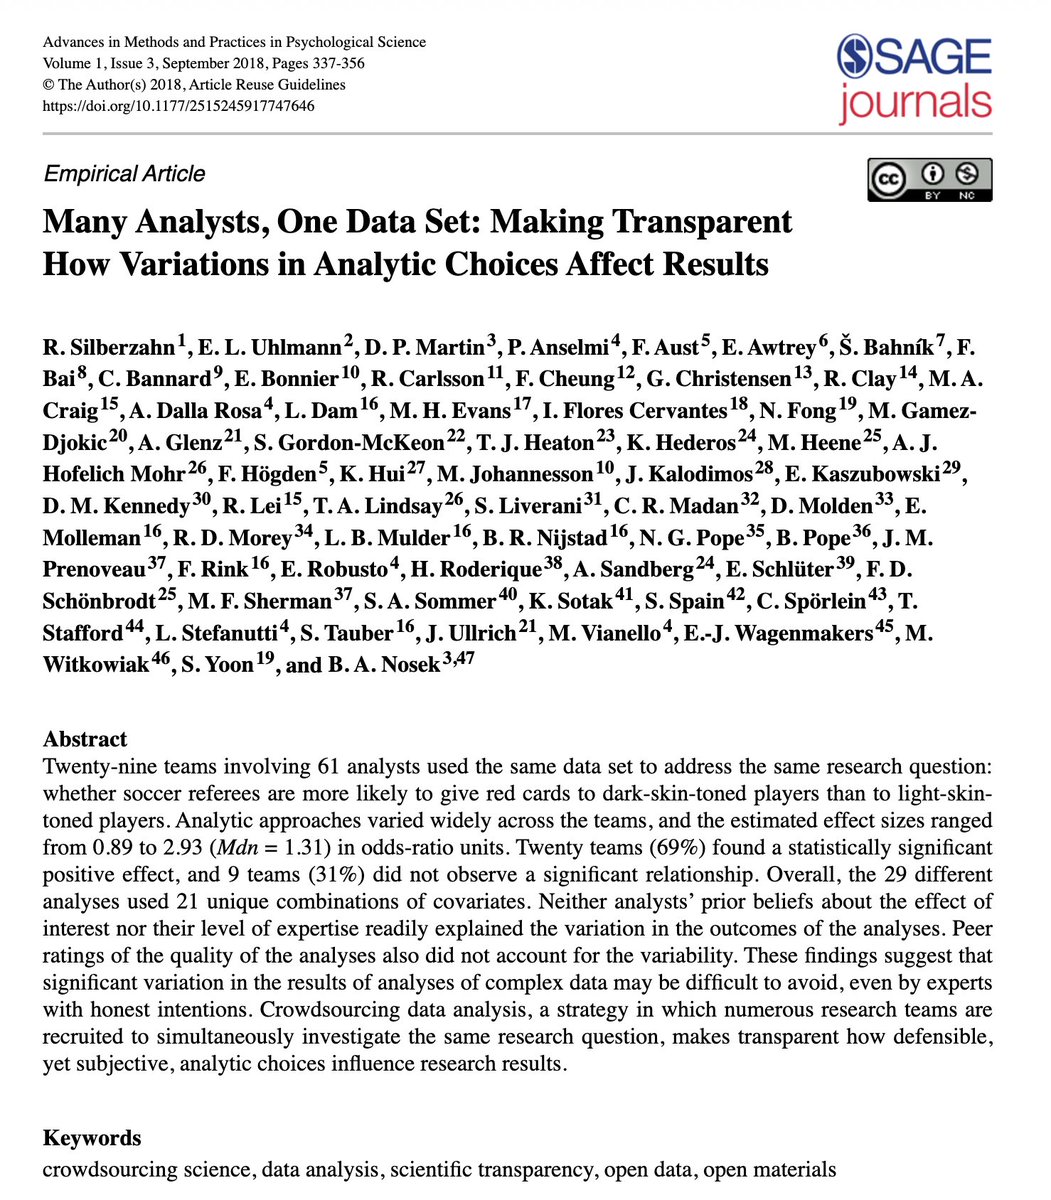
A team of powerhouse psychologists have just published a (seemingly) groundbreaking article.
The premise of the article was simple--give multiple research teams the same research question with the same dataset.
Would teams with the same research question and the same data come to the same conclusions?
The research question was: are soccer referees more likely to give red cards to players with dark skin tone than light skin tone?
The results obtained by the teams differed extensively.
Many concluded from this widely noted exercise that the social sciences are not rigorous enough to provide definitive answers.
This finding was widely shared in the popular press and on social media.
Fast forward a few years: a new (less covered) article comes out and shows that the main reason teams came to different answers was the original research question was unclear.
Teams differed in their interpretation of the research question and therefore used diverse research designs and model specifications.
When you reanalyze the data with a clear research question, a precise definition of the parameter of interest, and theory-guided causal reasoning, results across teams don't vary that much.
From the authors of the new study: "The broad conclusion of our reanalysis is that social science research needs to be more precise in its `estimands' to become credible."
When asked to draw a scientist, school-age kids in the United States are increasingly sketching women, according to a study from 2018.
Read more on #STEMSTEAMDay: https://t.co/xtOAX8sof0
Agreed! That's why I wrote ggpubfigs, a ggplot2 extension that *only colorblind-friendly color palettes.
Easily make your figures colorblind-friendly with ggpubfigs! https://t.co/frQgsl7zjP
Announcing the first (pilot) release of Diverse FACES! A database of facial expressions in young, middle-aged, and older individuals from underrepresented racial populations. @UTDResearch@BBSutdallas@CVLNeuro @SRNDNA
If you're still using raw R outputs for presentations, it's time for an upgrade! Tools like gtsummary bring your statistical results to life, making them much more digestible for non-technical audiences.
While base R functions like summary(fit) work well for statisticians, they can be too complex for stakeholders who aren’t familiar with the detailed output. The tbl_regression() function from gtsummary makes it easy to present regression results clearly.
In addition, gtsummary is highly versatile - it’s not just limited to linear regression. You can apply it to generalized linear models, survival analyses, and more. The package even allows you to include p-values, confidence intervals, and other important statistics directly within the tables, helping you to better communicate statistical results.
Here are a few standout benefits:
✅ Simplified output that’s easier for stakeholders to understand
✅ Works seamlessly with a variety of models
✅ Customizable tables with key statistics like p-values, confidence intervals, and more
The visualization included here was originally shared in a recent post by Dr. Alexander Krannich.
#rstats #gtsummary #statistics #datascience
Reminder that we are hiring!!! We will begin reviewing applications on November 1. If you have questions about the search, email is the best way to reach me (see ad for details).
Very excited to announce that my first paper creating a unified theory for predicting reactions to counter stereotypic men and women is now out in Sex Roles! https://t.co/Dylp8Yenaz
Join us for this year's Harriet Elliott Lecture Series hosted by @UNCG_Psych. Speakers will explore the theme, "Stress & Us."
Thurs, Nov. 7
Panel discussion: 2-4 p.m.
Keynote Address 5:30-6:45 p.m.
Learn more: https://t.co/vfvLpjgjjq
📢Exciting news! 📢JESP is now accepting #RegisteredReports an article type that emphasizes transparency and robust methodology through a two-step process! Learn more about registered reports here: 1/2 https://t.co/ymfjIQVmZ0








![mayan_navon's tweet photo. 🚨 New paper🚨 @JExpSocPsych
@TalMoran3 @NivReggev
https://t.co/kjZJhRG1oY
[thread] https://t.co/Cc9KPD780k](https://pbs.twimg.com/media/Ga-BvuRWUAAyEcb.png)


