#DYK the average American drank 342 bottles of water in 2020. 💧
Learn more about where bottling facilities across the U.S. source their water from in @USGS_Water’s new website: https://t.co/2p5RVRLYWO
What does streamflow into Lake Tahoe look like this snowmelt season?
Check out the daily streamflow at 9 streamgages surrounding the lake from Mar 2023 to present as compared to the historical record.
#Day28 | Trend | #30DayChartChallenge 📅 #rstats#DataViz by Margaux Sleckman
Want to understand water cycles, but still a bit wet behind the ears? Don't worry! Our partners at @USGS updated their water cycle diagrams. People of all ages can learn about the continuous movement of water on, above & below the Earth's surface. | https://t.co/jgryI84el7
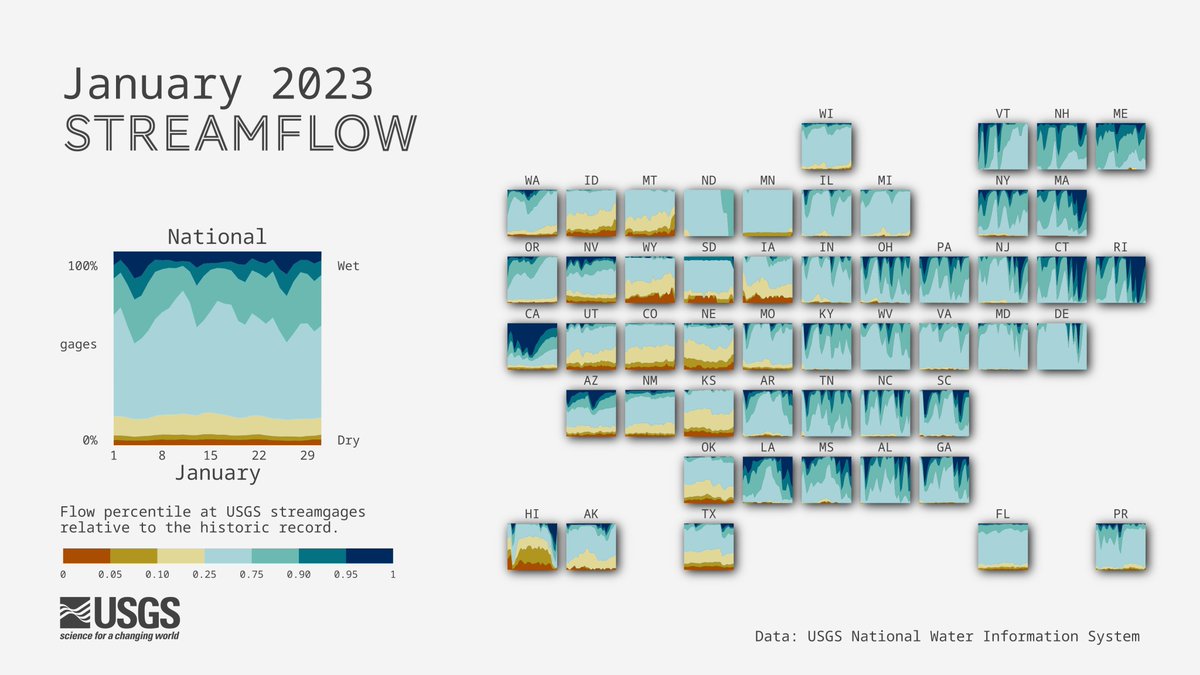
January #streamflow conditions across the U.S.🌧☀
Winter storms brought wetter than normal conditions across most of the country, with a series of #AtmosphericRivers on the west coast.
#DataViz made with #rstats#dataRetrieval https://t.co/MlbhUPRoO8
1/3 🧵
Download a free English or Spanish copy of the new diagram as a 26x38-inch poster, as an 8.5x11 handout, or as an 8.5x11 fill in the blank worksheet on the USGS water science school!!
Humans are front and center in the new water cycle diagram from the USGS. It’s the first update to the educational chart used by hundreds of thousands of students in more than 20 years.
https://t.co/chFvVIu3WO
Join the party! 💧🎉
Stories of the Water Cycle is just a week away! Read this 🧵 to see which USGS scientists will be speaking at our #ReleaseParty.
#WaterCycleStories
Tune in on October 13 at 6:30 pm ET/3:30 pm PT. Register now! Go to https://t.co/WJjn7LPFwB
📣 Coming Oct 13 - ALL NEW #WaterCycleDiagram 🥳
Want to WIN a poster of the new diagram? Join our virtual party, Stories of the Water Cycle, at 6:30 pm ET / 3:30 pm PT to enter our #raffle.
🎉🥳Celebrate w/ us – bring a friend! 🥂 RT this thread
#WaterCycleStories
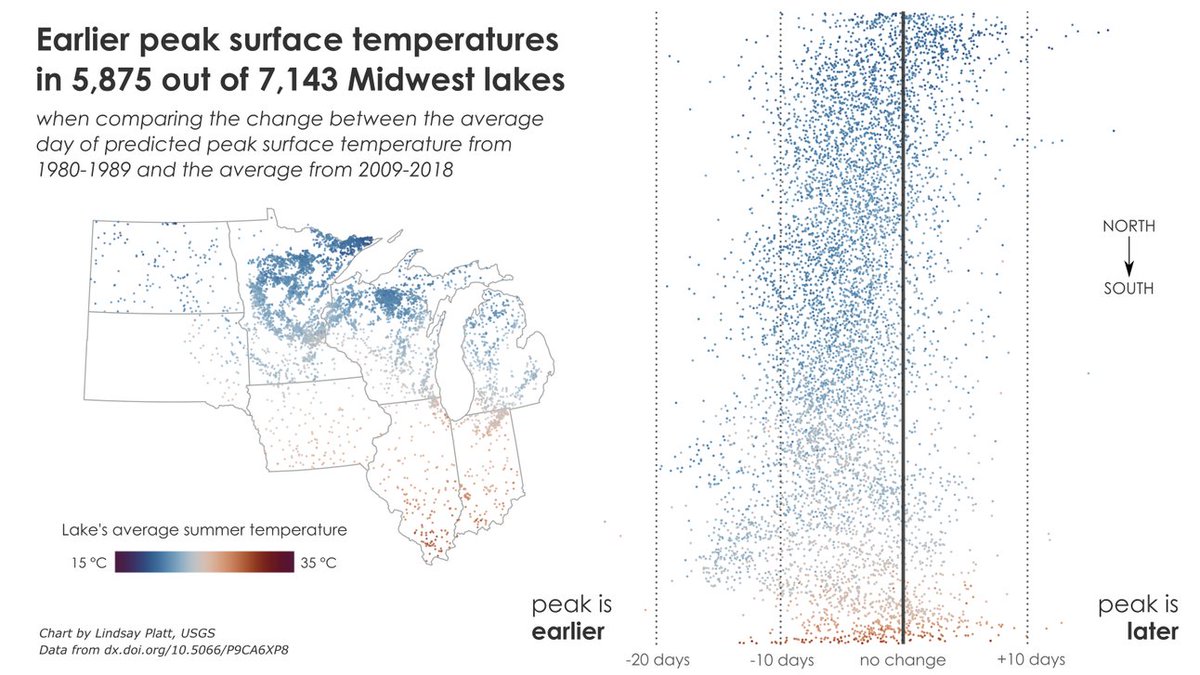
How has timing of peak surface temperature changed over the last four decades for Midwest lakes? 🌡
For #Day16 of #30DayChartChallenge 📅 Environmental Relationships by Lindsay Platt
#rstats code: https://t.co/ZDz9FIrOCg
Where the fresh water of the Delaware River meets estuarine salt water is called the salt front. It moves up and down in response to weather conditions in the basin.
#30DayChartChallenge#Day21📅Down/upwards by Theodore Thompson & Salme Cook
#python code: https://t.co/EJyIni6uA6
Our team forecasts Delaware River Basin stream temperatures up to 7 days ahead. Each day, our #DeepLearning model ingests observed temperatures with #DataAssimilation. How does DA work? A 🧵:
#30DayChartChallenge#Day27📅Future by Jeremy Diaz
#python code: https://t.co/JkRGTJbe1U
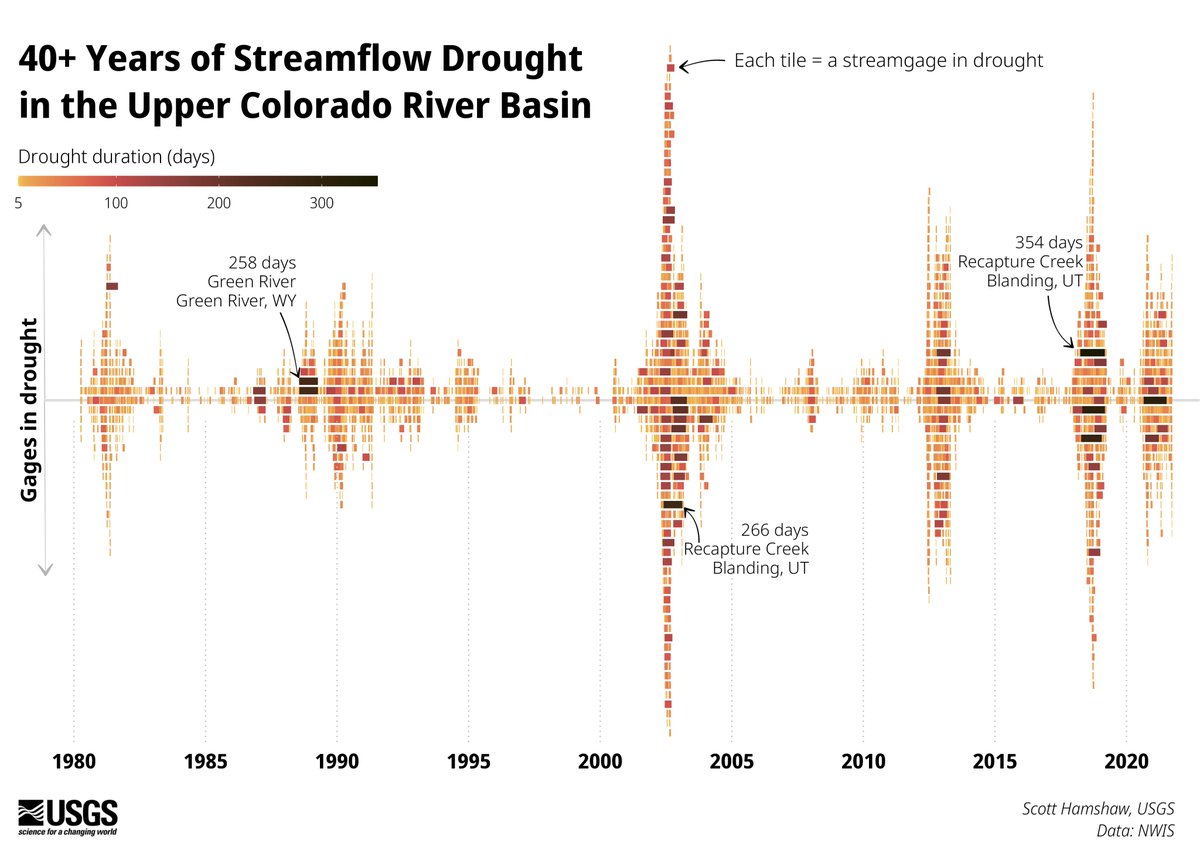
Is streamflow drought becoming more common? Here we plot the duration of streamflow drought events at 122 @USGS_Water streamgages in the Upper Colorado River Basin over 40+ years. Day 19 #30DayChartChallenge 📅 Global Change by Scott Hamshaw
#rstats code: https://t.co/k574fyXoxy
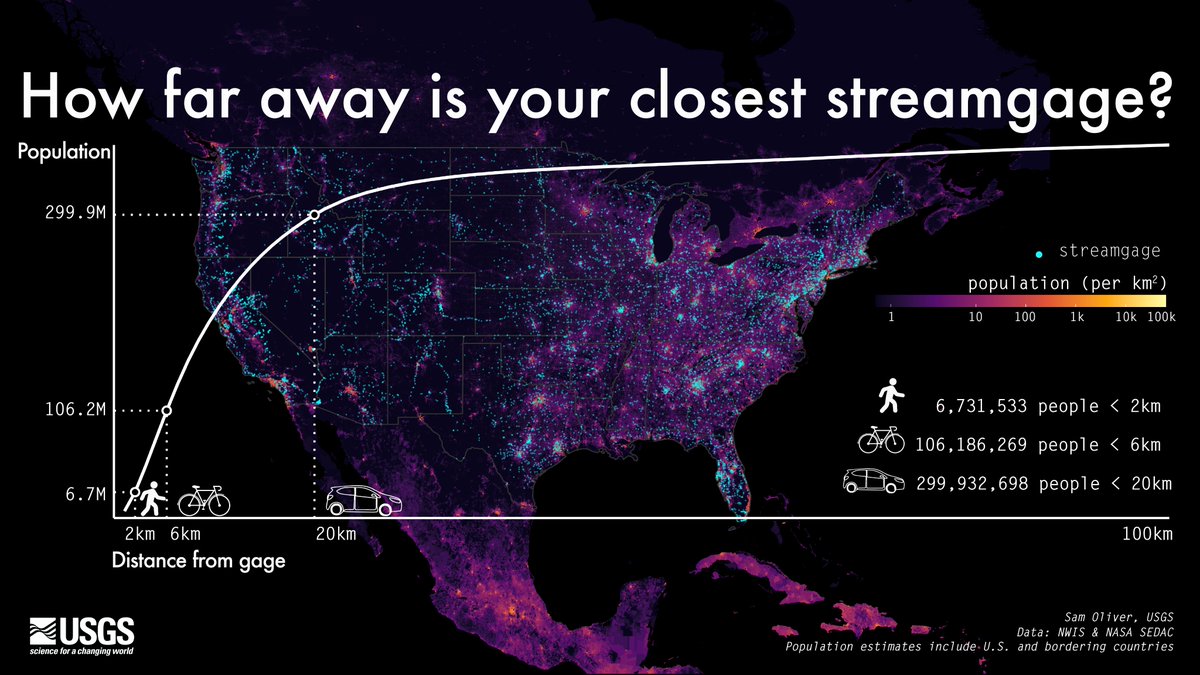
With thousands of active #streamgages nationwide, you’re never too far from a @USGS_Water monitoring location. How far away is your closest gage?⌚🗺https://t.co/qmp0Upg0Qr
Day 9 #30DayChartChallenge 📅 Distribution-statistics by Sam Oliver
#rstats code: https://t.co/VAJHFmA5Dt
Shoreline development factor is the ratio of the lake shoreline to the circumference of a circle of the same area, aka how circular a lake is 🔵. Here are 100 U.S. lakes, from least to most circular for day 11 #30DayChartChallenge 📅circular
#python code: https://t.co/5VbpnBemV8


![rOpenSci's tweet photo. [use case] Using a targets pipeline to query data from the Water Quality Portal by @USGS_DataSci
https://t.co/CGJ1sd4kDJ
targets by @wmlandau
#RStats https://t.co/0B4FTVo3ay](https://pbs.twimg.com/media/Fez-i1xXoAAWQPU.png)