Chief Economist @ApartmentList, PhD @Stanford Economics, former data science @Airbnb, loving all things housing research, guitars, Lakers, burritos, etc.
"Nationally we're tracking rents to be roughly flat, but it really depends on where you are in the country," says @IAPopov on rent prices around the country. "One of the big drivers is regional differences and construction."
I spent some time this week looking at the latest commuter data in ACS, and found that the pre-pandemic trend is back, in a big way.
In the US there are 3.7M "super" commuters who travel 90+ min to work. That's a 600k jump from 2021-2022.
🧵
Lower mobility is one possible reason for the tenaciousness of rent/OER CPI inflation. Several metrics show low or even negative *new* tenant lease inflation. But if churn is historically low, it could take longer for these low marginal reads to reduce *average* rent inflation.
🚨 Rent estimates for May out today 🚨
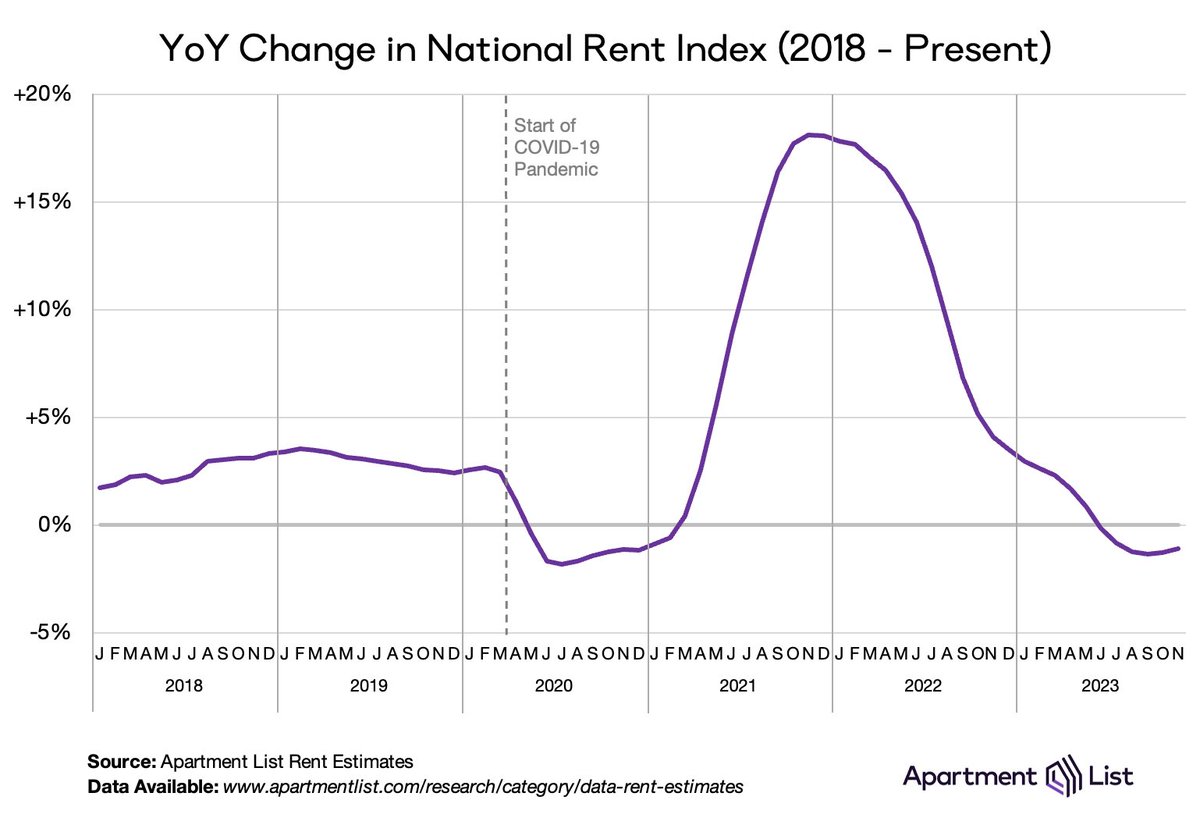
Rents nationally are *down* 0.8% year-over-year
YoY rent growth has now been modestly negative for a full year, bringing prices 2.6% below their 2022 peak
1/🧵
@AzizSunderji Hey @AzizSunderji! We don't have a pre-set release calendar, but depending on where weekdays fall, we typically publish new data on the 28-30th of every month
@emilynussbaum If requests for songs count, then "Tambourine Man" and "Piano Man." Also, for some reason, DJ Jazzy Jeff & The Fresh Prince's "Brand New Funk" just popped into my head.
In 2021/22, Austin had the highest rent inflation in the country.
Today the Texas capital is building more units as a share of inventory than any city in the country.
Suddenly, rent is falling by 7%.
I wrote about the lessons of the Austin miracle.
https://t.co/fA2NoN8hts
Despite all the wild storylines: high rates, booming multifamily construction, NAR settlement...
2024 has a really good chance of turning into the most normal housing market year so far this decade
https://t.co/CjGnscxqPa
“We’re watching a big mountain of snow melt, and every 10 minutes, we look and there’s still a big pile of snow. We’re just watching it so carefully it doesn’t feel like we’re seeing much progress." -- @IAPopov
My look at a stubborn inflation disconnect:
https://t.co/cgfxE0mlpw
Housing inflation has proven surprisingly stubborn. Is that a fluke in the data, or something more? It's a vitally important question for the Fed, and the broader economy:
https://t.co/0PvfliY65Y
Fresh case-shiller data shows a modest 0.2% decline in home prices in November, the first time prices have dropped since the initial interest rate shock of 2022.
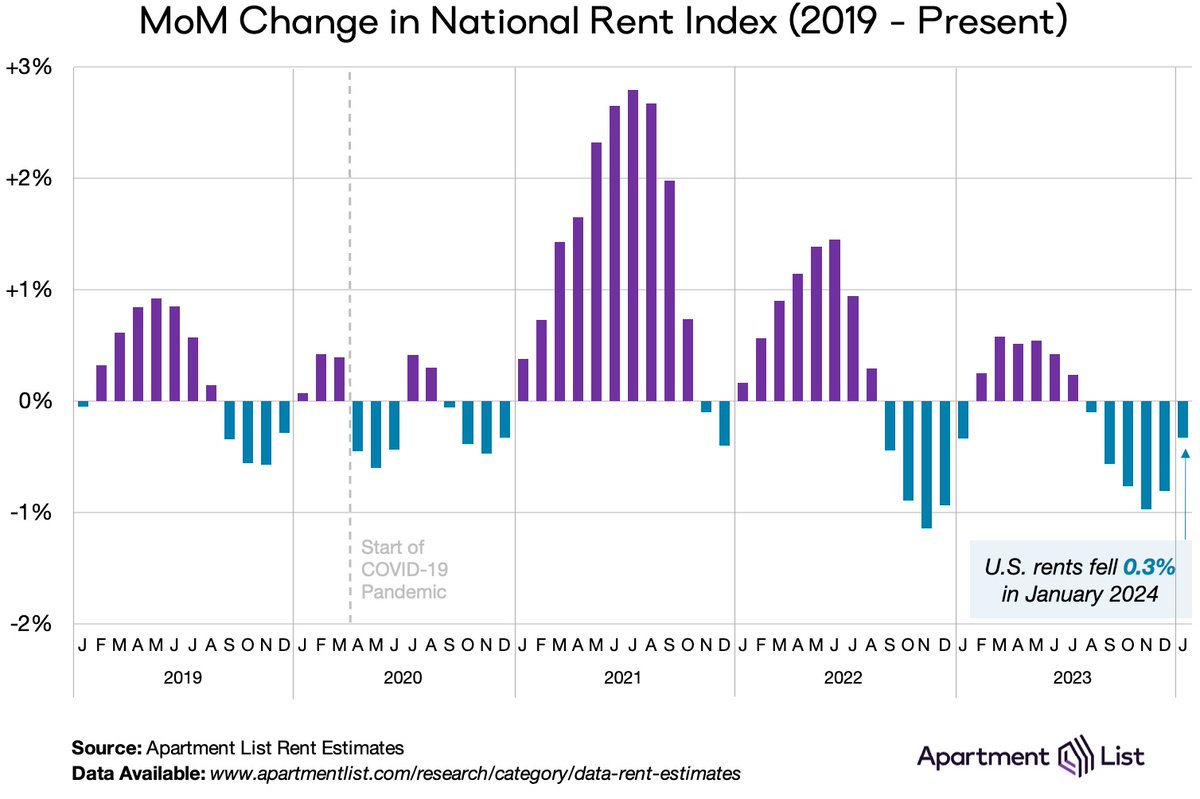
🚨 Fresh data release for Jan 🚨
Month-over-month rent growth came in at -0.3% nationally, kicking off the year with the sixth straight monthly decline
The national median rent is now down 3.5% in total since last August
1/🧵
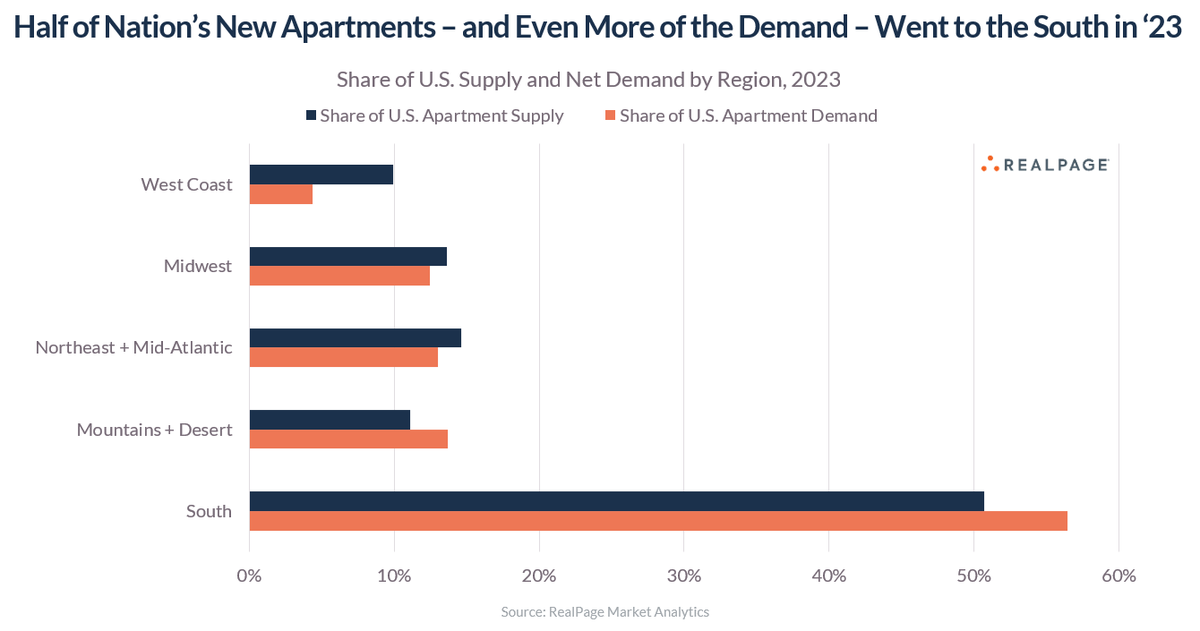
Half of all new apartments built in the U.S. in 2023 went to the South region of the country.
And an even greater share (56%) of all net demand (new apartment households) went to the South.
Too many analysts talk about supply as a single variable as if it exists in a vacuum. It's supply AND demand. Or supply relative to demand.
Supply exceeded demand in every region of the country in 2023, but the relative deficits were fairly similar, so the resulting vacancy spikes were similar (70-100 bps) across every region.
Of the 12 U.S. metro areas to add at least 7,000 net new apartment households in 2023, all but two were located in the Sun Belt or Mountain region, led by Dallas/Fort Worth, Houston, Phoenix and Austin. The two exceptions were Washington, DC, which ranked 5th, and Minneapolis, which finished 10th. Also in the top 12: Charlotte, Atlanta, Nashville, Raleigh/Durham, Minneapolis, Denver and Orlando.
The calendar may have flipped, but this trend hasn't:
Home prices still going up
📈 +1.5% since last year's peak
Rents still going down
📉 -4.3% since last year's peak
Apparently lots of confusion between levels, changes, f''(x) this week...
In the world of rents
🔴 Levels are HIGH (chronic housing shortage)
↗️ UP big since start of pandemic (+20%)
📉DOWN since this time last year (-1.1%)
⤴️ POSITIVE second derivative (YoY free fall over)