xETFs just announced distributions for its Daily Income ETFs:
$NYYY (NVDA Daily Income ETF) - $0.1725
$TYYY (TSLA Daily Income ETF) - $0.1889
Ex Date: June 2, 2026
Pay Date: June 4, 2026
Here is a performance update for the Quanity Funds income based ETFs
$ISSB - IncomeSTKd 1x US Stocks & 1x Bitcoin Premium ETF
$ISBG - IncomeSTKd 1x Bitcoin & 1x Gold Premium ETF
Disclosure: Quantify Funds is a WOLF Financial partner. This is just for informational purposes only
Bitcoin is falling.
Since inception, ISSB has delivered a total return of -7.39% based on NAV, versus -12.48% for its 100/100 benchmark, outperforming by 5.09%. Compared to -19.74% total return for IBIT over the same period, ISSB is outperforming by 12.35%.
Since inception, ISBG has delivered a total return of -21.12% based on NAV, versus -25.78% for its 100/100 benchmark, outperforming by 4.66%.
DISTRIBUTION ANNOUNCEMENT
Rex Shares just announced the distributions for $ULTI REX ETF Trust REX IncomeMax Option Strategy ETF
$0.2050 per share
Pay Date: 6/5/26
Disclosure: Rex Shares is a WOLF Financial Partner
Distribution News for REX IncomeMax™ Option Strategy ETF Holders!
Pay date: 06/05/2026
Amount: $0.2050
$ULTI Prospectus: https://t.co/BRN7cfxGTm
$ULTI Fund Info and Standardized Performance:
https://t.co/IUSz4e1ovJ
Here is a breakdown of the Tuttle Capital Space Industry Income Blast ETF $SPCI you should know:
Launch: March 12, 2026
Expense Ratio: 0.99%
Total Assets: $15.79M
NAV: $45.11
Distribution Rate: 21.82%
Distribution Frequency: Weekly
Since Inception Return: +102.33%🟢
Top Underlying Exposure:
🥇 Redwire $RDW
🥈 Intuitive Machines $LUNR
🥉 BlackSky Technology $BKSY
4. Planet Labs $PL
5. Rocket Lab $RKLB
Recent Distributions:
May 29, 2026: $0.3000/share
May 22, 2026: $0.2000/share
May 15, 2026: $0.2000/share
The fund is an actively managed ETF that seeks weekly income while providing exposure to the space industry. It holds Treasury bills as collateral and generates income through a systematic put spread strategy and structured options positions on space industry stocks, aiming to capture approximately 100% of the Syntax Space Industry Index upside before fees.
Here is a breakdown of the Nicholas Crypto Income ETF $BLOX you should know:
Launch: June 16, 2025
Expense Ratio: 0.99%
Total Assets: $335.24M
NAV: $17.86
Distribution Rate: 36.00%
Distribution Frequency: Weekly
Top Holdings:
🥇 Hut 8 $HUT 11.18%
🥈 Riot Platforms $RIOT 8.99%
🥉 IREN $IREN 8.01%
4. Cipher Digital $CIFR 7.87%
5. Taiwan Semiconductor $TSM 7.56%
Recent Distributions:
May 29, 2026: $0.1193/share
May 22, 2026: $0.1106/share
May 15, 2026: $0.1208/share
The fund is an actively managed ETF that blends crypto industry companies with an options overlay strategy to generate weekly income. It gains exposure to Bitcoin and Ether through U.S.-listed ETFs and ETPs, while also investing in crypto miners, blockchain technology companies, trading platforms, and payment processors.
REX Shares just announced their June 2026 weekly distributions for their Growth & Income ETF suite:
$NVII REX NVDA Growth & Income ETF: 48.00%
$TSII REX TSLA Growth & Income ETF: 52.31%
$WMTI REX WMT Growth & Income ETF: 59.25%
$MSII REX MSTR Growth & Income ETF: 30.92%
$COII REX COIN Growth & Income ETF: 28.39%
$CWII REX CRWV Growth & Income ETF: 34.56%
$HOII REX HOOD Growth & Income ETF: 27.53%
$LLII REX LLY Growth & Income ETF: 27.67%
$PLTI REX PLTR Growth & Income ETF: 20.53%
Distribution Frequency: Weekly
As of: June 1, 2026
Disclosure: @REXShares is a WOLF Financial partner. This is for informational purposes only, not financial advice.
Another Wednesday. Another payout.
Our Growth & Income Suite offers access to ETFs with the potential for income on a weekly distribution schedule.
Annualized Distribution Rates:
$NVII – 48.00%
30-Day SEC Yield: 3.81%
Return of Capital (ROC): 97.70%
$TSII – 52.31%
30-Day SEC Yield: 3.46%
Return of Capital (ROC): 97.90%
$WMTI – 59.25%
30-Day SEC Yield: 3.09%
Return of Capital (ROC): 93.00%
$MSII – 30.92%
30-Day SEC Yield: 4.02%
Return of Capital (ROC): 96.50%
$COII – 28.39%
30-Day SEC Yield: 4.11%
Return of Capital (ROC): 95.80%
$HOII – 27.53%
30-Day SEC Yield: 2.16%
Return of Capital (ROC): 88.70%
$LLII – 27.67%
30-Day SEC Yield: 2.01%
Return of Capital (ROC): 93.50%
$CWII – 34.56%
30-Day SEC Yield: 2.79%
Return of Capital (ROC): 93.40%
$PLTI – 20.53%
30-Day SEC Yield: 2.44%
Return of Capital (ROC): 88.50%
View each fund’s prospectus here:
NVII, TSII, MSII, & COII Prospectus:
https://t.co/DxdJDBADqK
HOII, LLII, CWII, PLTI, & WMTI Prospectus:
https://t.co/t92ViUJE6R
NVII Fund Info and Standardized Performance: https://t.co/k3KDL8T1ql
TSII Fund Info and Standardized Performance: https://t.co/RgB8ohIH0O
MSII Fund Info and Standardized Performance: https://t.co/RmONgQyRTM
COII Fund Info and Standardized Performance: https://t.co/QdPIWDG37P
HOII Fund Info and Standardized Performance: https://t.co/MFx8mRdwhN
LLII Fund Info and Standardized Performance: https://t.co/xMonUF8nvw
CWII Fund Info and Standardized Performance: https://t.co/USvG1CVnk7
PLTI Fund Info and Standardized Performance: https://t.co/uRouPeIzc1
WMTI Fund Info and Standardized Performance: https://t.co/VNgvmC0Wxy
*As of 6/1/26. The Distribution Rate is the annual yield an investor would receive if the most recently declared distribution, which includes option income, remained the same going forward. The Distribution Rate is calculated by multiplying an ETF’s Distribution per Share by fifty-two (52), and dividing the resulting amount by the ETF’s most recent NAV. The Distribution Rate represents a single distribution from the ETF and does not represent its total return.
**As of 5/31/26. The 30-Day SEC Yield represents net investment income, which excludes option income, earned by such ETF over the 30-Day period, expressed as an annual percentage rate based on such ETF’s share price at the end of the 30-Day period.
NVII, TSII, MSII, COII, HOII, LLII, CWII, PLTI, & WMTI's current distributions consist of 100% estimated return of capital (ROC). For full details on the composition of distributions, please refer to the latest 19a-1 notices. The REX NVDA Growth & Income ETF, the REX TSLA Growth & Income ETF, the REX MSTR Growth & Income ETF, the REX COIN Growth & Income ETF, the REX HOOD Growth & Income ETF, the REX LLY Growth & Income ETF, the REX CRWV Growth & Income ETF, the REX PLTR Growth & Income ETF, and the REX WMT Growth & Income ETF have a gross expense ratio of 0.99%. There is no guarantee that the Funds will be successful in their attempt to provide leveraged exposure to the underlying stocks or pay weekly distributions.
The Funds are not suitable for all investors. These distribution rates caused by unusually favorable market conditions may not be sustainable. Such conditions may not continue to exist and there should be no expectation that this performance may be repeated in the future. The performance data quoted represents past performance. Past performance does not guarantee future results. The investment return their original cost and current performance may be lower or higher than the performance quoted. Performance current to the most recent month-end can be obtained by calling 1-844-802-4004. Short term performance, in particular, is not a good indication of the fund’s future performance, and an investment should not be made based solely on returns.
🚨 NEW ETF LAUNCH
YieldMax has launched a new single-stock option income ETF:
YieldMax INTC Option Income Strategy ETF $INYY
The fund is designed to generate income by selling call spreads on Intel Corporation $INTC. It seeks to maximize income potential through an options-based strategy linked to a single underlying stock.
Ticker and Fees TBA.
Disclosure: @YieldMax is a WOLF Financial partner. This is for informational purposes only, not financial advice.
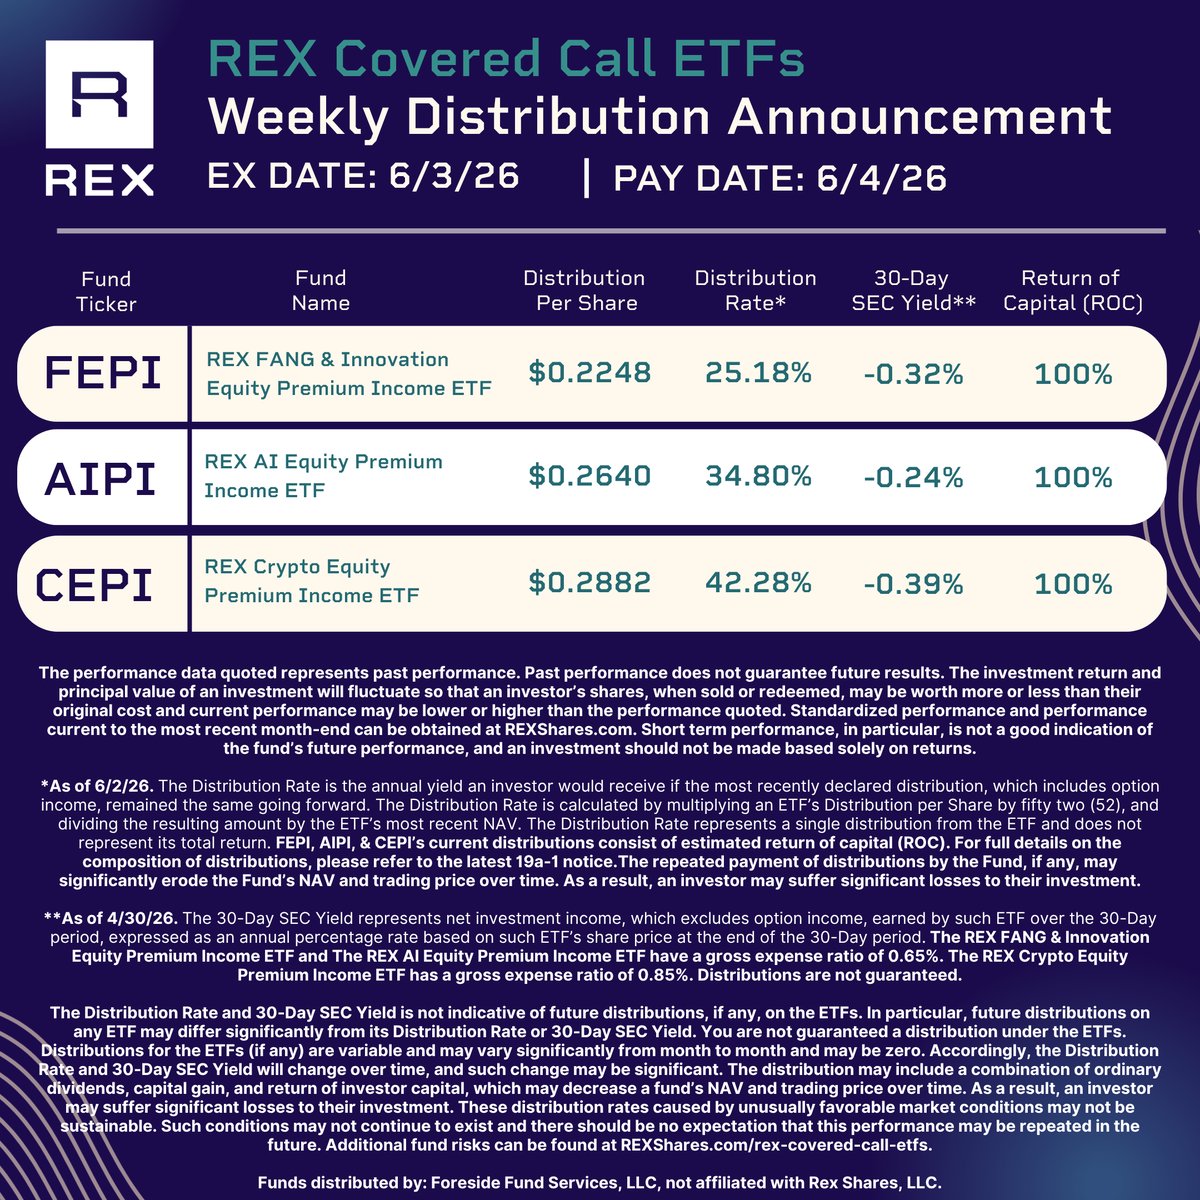
Rex Shares announced some Distributions
$FEPI | REX FANG & Innovation Equity Premium Income ETF | $0.2248
$AIPI | REX AI Equity Premium Income ETF | $0.2640
$CEPI | REX Crypto Equity Premium Income ETF | $0.2882
Disclosure: Rex Shares is a WOLF Financial partner
🥇Weekly Distribution News for $FEPI $AIPI & $CEPI Holders!
Payout Date: 6/4/26
Distribution for $FEPI
Amount: $0.2248
Distribution for $AIPI
Amount: $0.2640
Distribution for $CEPI
Amount: $0.2882
FEPI Prospectus: https://t.co/Q3b1OGwTqy
FEPI Fund Info and Standardized Performance: https://t.co/dX3CHx3yFl
AIPI Prospectus: https://t.co/dE1gJCqmwG
AIPI Fund Info and Standardized Performance: https://t.co/Kf10iQ01Yt
CEPI Prospectus: https://t.co/Yz4ear8BxK
Fund Info and Standardized Performance: https://t.co/3pm6F6EzoC
Distribution News for REX Growth & Income Universe ETF Holders!
Pay date: 06/04/2026
Amount: $0.1625
GIF Prospectus: https://t.co/kEJTen8McX
GIF Fund Info and Standardized Performance: https://t.co/0WGTK19UFS
$SCHD vs $DGRO
Both are low-cost dividend ETFs that invest in U.S. stocks with a history of paying dividends, but they are not the same fund.
$SCHD Schwab U.S. Dividend Equity ETF
Launch: October 20, 2011
Total Assets: $94.18B
Distribution Rate: 3.29%
1-Year Return: +28.96%🟢
Expense Ratio: 0.06%
Distribution Frequency: Quarterly
Top Holdings:
🥇 Qualcomm $QCOM 6.22%
🥈 Texas Instruments $TXN 5.73%
🥉 UnitedHealth Group $UNH 5.15%
$DGRO iShares Core Dividend Growth ETF
Launch: June 10, 2014
Total Assets: $40.35B
Distribution Rate: 2.00%
1-Year Return: +25.16%🟢
Expense Ratio: 0.08%
Distribution Frequency: Quarterly
Top Holdings:
🥇 Broadcom $AVGO 3.53%
🥈 Apple $AAPL 3.27%
🥉 Microsoft $MSFT 3.24%
$SCHD is larger, pays a higher yield, and focuses on dividend quality. $DGRO holds more holdings with a tilt toward dividend growth over current yield. Same fees, same quarterly pay schedule, different index and stock selection.
Here are some stats about the NEOS MLP & Energy Infrastructure High Income ETF $MLPI you should know:
Launch: December 17, 2025
Expense Ratio: 0.68%
Total Assets: $628.20M
NAV: $54.48
Distribution Rate: 14.72%
Distribution Frequency: Monthly
Top Holdings:
🥇 Enbridge $ENB 9.91%
🥈 Williams Companies $WMB 9.38%
🥉 TC Energy $TRP 6.80%
4. Pembina Pipeline $PPL 6.08%
5. Kinder Morgan $KMI 5.64%
Recent Distributions:
May 2026: $0.7038/share
April 2026: $0.6667/share
March 2026: $0.6800/share
The fund seeks to generate high monthly income through investments in MLPs and energy infrastructure companies combined with a data-driven call option strategy, while offering 1099 tax reporting instead of the K-1s typically associated with MLPs.
Disclosure: @NEOS is a WOLF Financial partner. This is for informational purposes only, not financial advice.
$BALI vs $BINC
Both are active iShares income ETFs that pay monthly, but they are not the same fund
$BALI iShares U.S. Large Cap Premium Income Active ETF
Launch: September 26, 2023
Total Assets: $1.21B
Distribution Rate: 7.68%
1-Year Return: +16.95%🟢
Expense Ratio: 0.35%
Top Holdings:
🥇 $NVDA Nvidia 7.22%
🥈 $AAPL Apple 6.18%
🥉 $MSFT Microsoft 5.91%
$BINC iShares Flexible Income Active ETF
Launch: May 19, 2023
Total Assets: $16.84B
Distribution Rate: 5.55%
1-Year Return: +5.37%🟢
Expense Ratio: 0.40%
Top Holdings:
🥇 Uniform MBS 15.75%
🥈 Spain (Kingdom of) 2.51%
🥉 Italy (Republic of) 2.29%
Which one are you holding?
Here are the 20 largest income ETFs by total assets:
🥇 $JEPI JPMorgan Equity Premium Income ETF: $44.59B
🥈 $JEPQ JPMorgan Nasdaq Equity Premium Income ETF: $39.63B
🥉 $JPST JPMorgan Ultra-Short Income ETF: $38.40B
4. $DFCF Dimensional Core Fixed Income ETF: $10.48B
5. $JPIE JPMorgan Income ETF: $9.10B
6. $CGCP Capital Group Core Plus Income ETF: $7.84B
7. $DIVO Amplify CWP Enhanced Dividend Income ETF: $7.11B
8. $DFSD Dimensional Short-Duration Fixed Income ETF: $6.78B
9. $JMST JPMorgan Ultra-Short Municipal Income ETF: $6.36B
10. $FPE First Trust Preferred Securities and Income ETF: $6.34B
11. $CGMU Capital Group Municipal Income ETF: $6.11B
12. $GPIQ Goldman Sachs Nasdaq-100 Premium Income ETF: $4.60B
13. $GPIX Goldman Sachs S&P 500 Premium Income ETF: $4.28B
14. $FIXD First Trust TCW Opportunistic Fixed Income ETF: $3.32B
15. $KNG FT Vest Dividend Aristocrats Target Income ETF: $3.28B
16. $FLXR TCW Flexible Income ETF: $3.21B
17. $CGHM Capital Group High Income ETF: $3.07B
18. $DFGP Dimensional Global Fixed Income ETF: $2.56B
19. $CGSD Capital Group Short Duration Income ETF: $2.28B
20. $FTHI First Trust BuyWrite Income ETF: $2.26B
$SPYI vs $QQQI
Both are NEOS high income ETFs that pay monthly, but they track different underlying indexes
$SPYI NEOS S&P 500 High Income ETF
Launch: August 29, 2022
Total Assets: $10.07B
Distribution Rate: 12.09%
1-Year Return: +25.05%🟢
Expense Ratio: 0.68%
May 2026 Distribution: $0.5353/share
Top Holdings:
🥇 $NVDA Nvidia 7.96%
🥈 $AAPL Apple 7.02%
🥉 $MSFT Microsoft 5.15%
$QQQI NEOS Nasdaq-100 High Income ETF
Launch: January 29, 2024
Total Assets: $12.35B
Distribution Rate: 14.11%
1-Year Return: +31.19%🟢
Expense Ratio: 0.68%
May 2026 Distribution: $0.6589/share
Top Holdings:
🥇 $NVDA Nvidia 8.11%
🥈 $AAPL Apple 7.29%
🥉 $MSFT Microsoft 5.30%
Disclosure: @NEOSInvestments is a WOLF Financial partner. This is for informational purposes only, not financial advice.