THIS IS F**KING DANGEROUS
I GAVE CLAUDE ACCESS TO OPTIONS FLOW, ORDER BOOK DATA, AND GAMMA WALLS — AND IT STARTED CALLING LEVELS BETTER THAN I DO
not a chart with two moving averages. not a “buy the dip” alert. this is a full institutional desk compressed into one AI session
here’s what’s on the screen right now:
→ GEXRadar pulling Gamma Exposure across 44 strikes in real time
→ Delta Exposure flipping between bars and candles showing where dealer hedging shifts
→ Major Walls: call wall at $700 with +276M, put wall at $691 with -97M
→ Hedging Pressure gauge sitting at 48/100 — neutral, dealer flow balanced
→ Net Drift tracking $19.93B in calls against $32.39B in puts — put dominated
→ IV Surface Analysis rotating in 3D showing where volatility is mispriced by strike and expiry
→ MotiveWave footprint printing every bid and ask at every price level, tick by tick
→ DOM ladder on MNQ futures with live bid/ask stacking — 29,103.75 ask, 29,103.50 bid
Claude reads all of it
not the chart — the structure underneath the chart
gamma exposure tells it where dealers are forced to buy or sell. delta exposure tells it which direction the hedging pressure is building. the wall map tells it where price stalls. the footprint tells it whether the move is real volume or just air
entry: 1 contract MNQ at 29,054.75
TP set: 29,178.25
P&L climbs → +$64 → +$146 → +$167
the trade wasn’t a guess. the call wall at $700 held, hedging pressure was neutral, gamma flip sat at $698, and the footprint confirmed buyers absorbing every offer at the 29,050 level
Claude saw the wall. saw the flow. saw the absorption. and said: this is the entry
tested this setup with $100 starting capital — ended the session at $3,153
that’s not leverage doing the work. that’s an AI reading options structure, order flow, and gamma positioning simultaneously — something no human can do across 44 strikes in real time
you’re still drawing trendlines
Claude is reading the market’s skeleton
save this — the full setup and session walkthrough is in the article below ↓
Here is the truth bomb everyone is ignoring.
20-30% of Bitcoin will be taken by a Quantum Machine within 2-8 years and there is absolutely nothing we can do to stop this. These are P2PK addresses, like Satoshis $125B, and many other old/lost coins.
Bitcoiners have a painful decision to make that we must start discussing now. Do we:
A) Let the Quantum hackers take it and market dump half a $Trillion +?
B) Do we agree a migration period for these coins, and if they don't migrate to Quantum Proof addresses in time we BURN all their assets?
These are the only two options we have. I currently lean towards option (B) as a 30% supply unlock will probably destroy Bitcoin's "hard money" and "trust the code" value prop.
🫳
💣
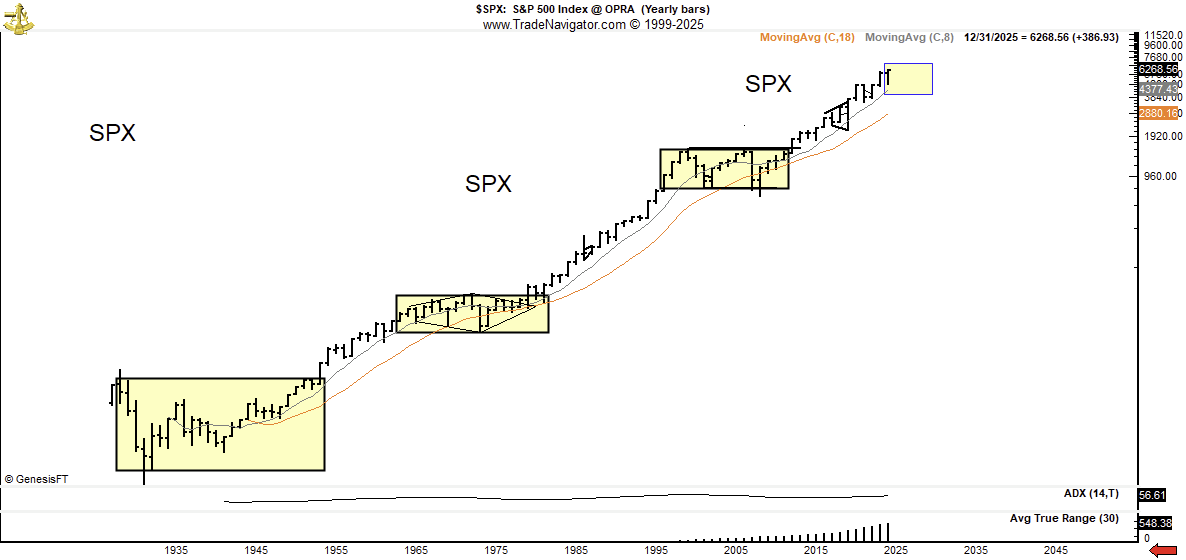
Where ever the current bull market in U.S. equities ends (and it will end) expect at least 8 to10 years of no gain
1929-1954 = no gain
1965-1983 = no gain
1999-2013 = no gain
2025-???? = no gain
Stocks spend more time in "chop" than in "gain" periods
A few strong views on the Robotics Industry:
1 - General Purpose Robotics will be much larger than Specialized Robotics
2 - Vertically integrated (AI + hardware) companies have huge edge
3 - In the short term, the best robot models will be derived from real robot data. In the long term, they will come from simulated data
4 - The biggest companies will be US companies that understand how to bridge the talent and infrastructure from Asia
5 - Early distribution is critical
Assume 1 robot = $50k
100,000 robots = $5B revenue
1M robots = $50B
10M robots = $500B
100M robots = $5T
1B robots = $50T
20b robots = $1 Quadrillion
Humanoid robots will be the biggest product market in the history of ever by magnitudes
The future largest companies will be robot manufacturers
What if?
The U.S. stock market, as measured by the S&Ps, have now entered a five or more year trading range.
Trading ranges in U.S. equities are the norm, not the exception. $SPX
OK, let's talk markets. Lot's of hullabaloo about last week's markets. But in big scheme of things, last week was NOTHING.
So, will E = A, B, C or D in nature. My choice, for what it worth, is C, but maybe twice as long in duration. What is your guess?
#Bitcoin Cost Basis at $95K:
• ETFs/Custody Wallets: $89K
• Binance Traders: $59K
• Mining Companies: $57K – Falling below this level in past downturns (May 2022, March 2020, November 2018) confirmed a bear market.
• Old Whales: $25K – Never breached historically.
This is a brilliant chart posted by a very smart person -- and must be taken seriously when trying to grasp an understanding of binary price possibilities for Bitcoin $BTC
This is the most important chart in the world today.
It's the chart of the Japanese Yen vs the USD.
Why is it so important?
1. For 30 years Japan has 0% interest on their currency.
2. As a result for 30 years investor borrowed YEN at no cost and invested it globally. They invested in T-Bills abroad and a basket of risk assets including the Nasdaq.
3. For the first time in many year the BOJ increased interest rates this week by 0.25%. This was almost unprecedented.
4. As a result of the increased interest rates and the signal to the market, investors are now concerned that the money they borrowed for free is no longer free and therefore they are unwinding their trades and sending the funds back to Japan.
5. The estimated quantum of this trade is over $4 trln!!
The only question that remains is how aggresive they will be but for now YOU MUST KEEP YOUR EYES ON THIS CHART! If it keeps strengthening risk assets are going to get murdered!!
Bitcoin's advance against gold is the paradigm shift of our time. It's equivalent to the transition from beeswax & whale oil towards the era of petroleum. As a result, the BTC/Gold ratio is a most important chart to monitor.
This is Tommy Hilfiger.
He took the world by storm overnight, but not because of his clothing.
Here’s how a genius marketing stunt put Hilfiger on the map before his designs did:
(this story blew my mind)
Welcome to a new paradigm.
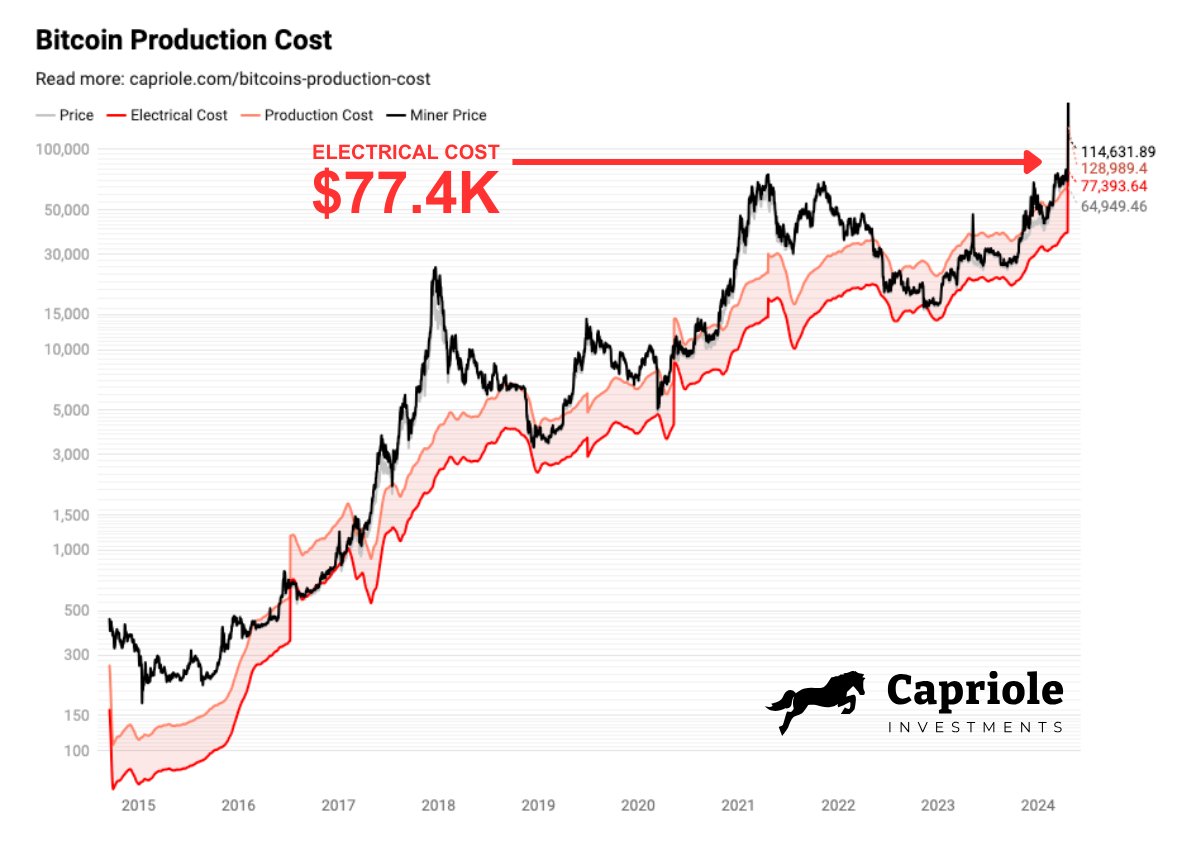
Bitcoin Electrical Cost is now a whopping $77.4K.
This is the raw electricity cost to power the network, per Bitcoin mined.
Bitcoin Miner Price hit $244K on Saturday!
This is the block reward + fees per Bitcoin mined. It boomed as transaction fees hit $230+ (about 4X the prior ATH of $68 set in 2021).
This means Bitcoin is trading at a DEEP DISCOUNT.
Price under Electrical Cost typically lasts just a couple days every 4 years.
This means 1 of 3 things happens now:
1) Price skyrockets
2) ~15% of miners shut down
3) Transaction fees remain a lot higher on average
Expecting a bit of all three.
Bitcoin's days under $100K are numbered.
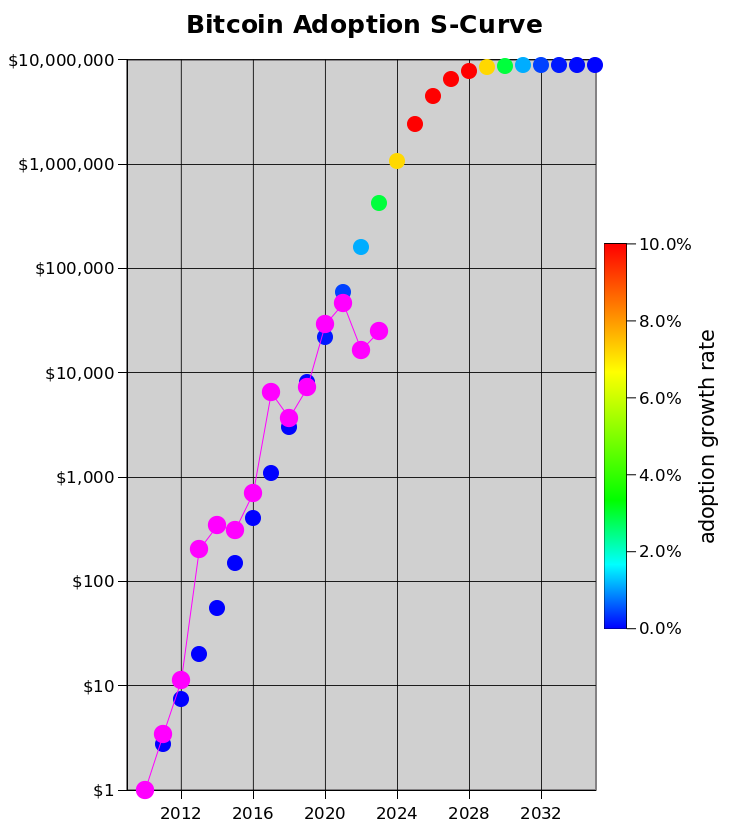
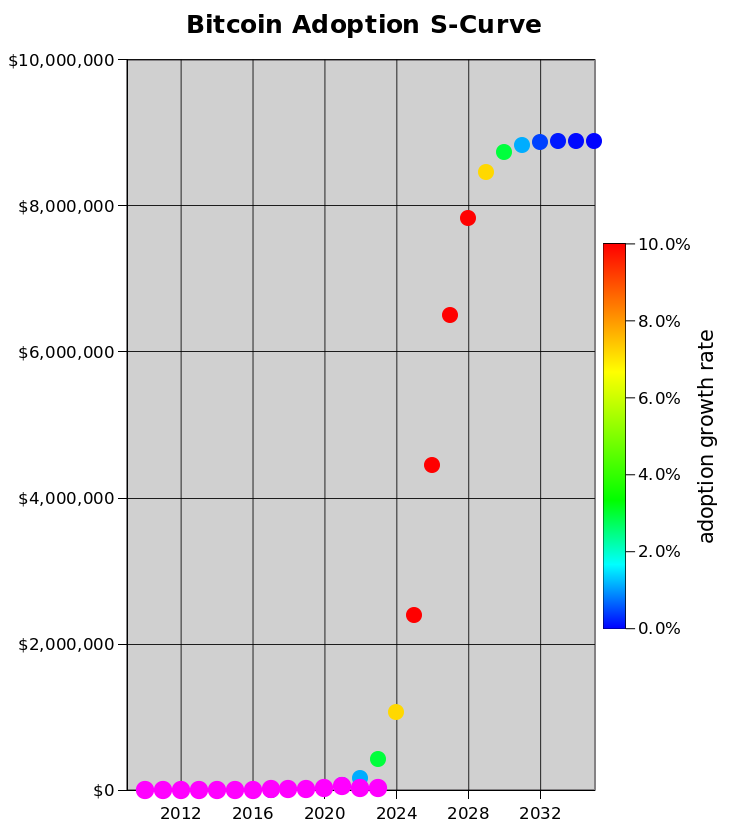
If bitcoin adoption is now 1-5% then we will enter the vertical of the S-curve next couple of years.
On log scale (left) this just means more exponential growth until 50% adoption. For the linear thinkers (right) everything will change. Bitcoin might be substantially undervalued.
When will Bitcoin break its ATH? November 2024
When will the bull run end? September 2025
When will most of the new 100x alts be released? Jan-July 2024
Why do I think this? I'll show you below 👇
1/12
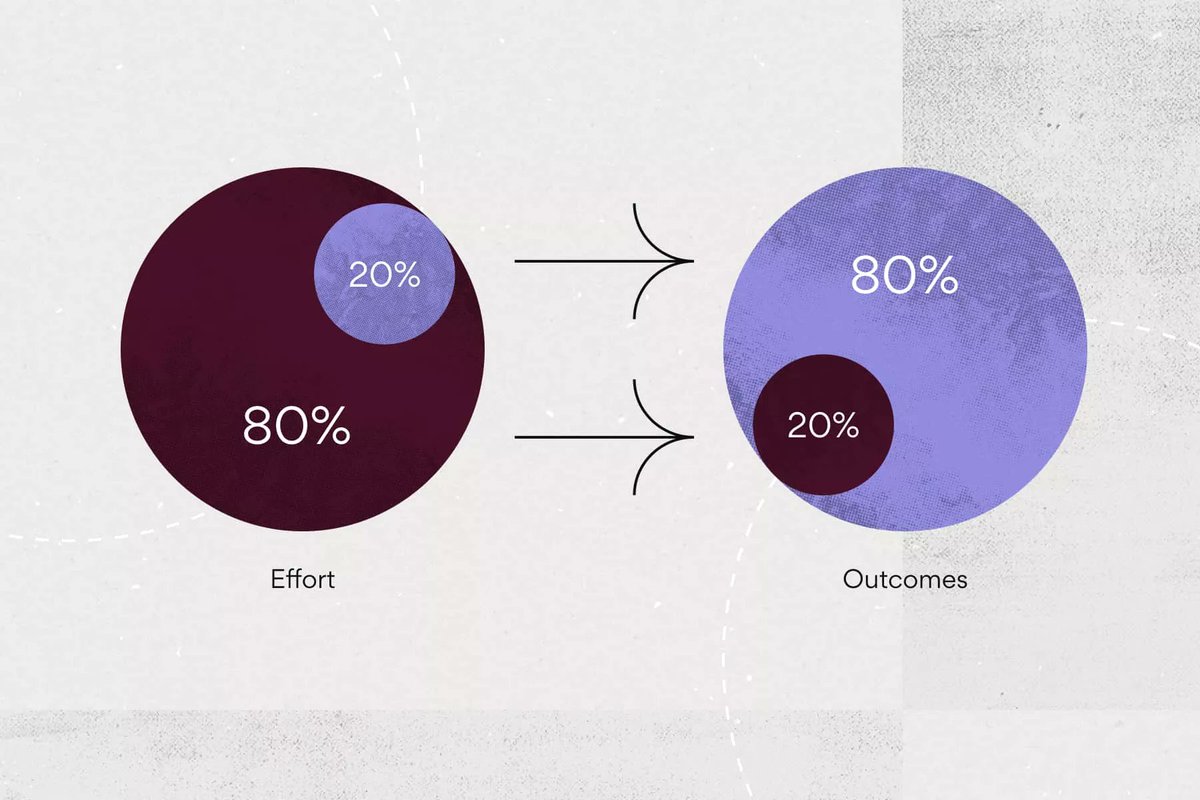
During my 48 years as a speculator, every professional flat price trader I've known has performance governed by the Pareto Principle whereby 10% to 20% of their trades account for 80% to 90% of their profits -- year after year. Only traders who understand this (whether they refer to Pareto or not) will ultimately succeed.
Why so?
Because long-term profitability in market speculation has much more to do with how losses are dealt with than it has to do with finding magic winners. Winners will come, but only to those traders who have preserved their capital during the inevitable losing periods.
It's actually easy to make money trading. The challenge is keeping it. And it is in the "keeping it" phase where the cream rises to the top.
I find social media to be a joke in that all the testosterone-overdosed young guns are bragging about their 5X, 10X, 30X trades. Don't be conned into believing that the Lambo crowd with their 6-screen layout of computers showing graphs is anything but empty talk.