SPX iron condor, entered at the close, expiring the next day. 20-delta shorts, $5 wide wings, collects about $170 against $330 of risk. 1,091 trades, May 2022 through September 2026.
Unfiltered, it has no edge. EV is basically zero, 64% win rate. The median trade wins $158, and the tail losses hand it all back. That is before commissions. If you sell these every day on autopilot, you are donating.
But one condition changes everything: how much SPX moved yesterday.
When SPX moved 1% or more the day before entry, the same condor made +$40 per trade across 278 trades. Positive in all 5 years. At 1.5% or more, +$44.
And it is monotonic. Big prior move: +$32. Medium move: -$12. Quiet day: -$21. The calmer yesterday was, the worse the condor does today.
The logic is simple once you see it. After a big day, implied vol stays scared while the market usually calms down. You are selling yesterday's fear at tomorrow's prices. On quiet days there is no fear premium to collect, but the tail risk is still there. Same $170 credit, none of the edge.
Two more findings. Friday entries were the best day (+$29, weekend decay into the Monday expiry) and Wednesday entries the worst (-$31). And a high VIX minus realized vol spread, which every premium seller is taught to love, was a losing condition here (-$15). In a 1DTE condor, that spread usually means live stress, not rich premium.
Best combo: prior-day move of 1% or more on a Thursday or Friday entry. +$65 per condor across 132 trades.
Honest caveats: daily closes only, no commissions or slippage modeled, and I sliced the data a lot of ways. The prior-move result is the one I trust because it is monotonic, it worked every year, and the mechanism makes sense.
Historically realize vol is always under implied vol, so selling condors when realize vol is above will naturally revert.
@neomfunded Yup,
Accuracy does not equal profitability,
You can have a 90% accuracy and still lose money in the market.
Need to focus on making more money than losses , known as positive expectancy.
@StratsLabs On a side by side comparison, fixed sized models this year outperformed MG even though MG provided linear growth and was positive all this year. Framework is still the same ,
You guys asked for crypto, so I ran the %B bottom study on BTC and ETH. The answer is uncomfortable.
Same setup as the SPY study. 6.75 years of dailies. 11-day pivot windows. Bottoms confirmed by a 5% bounce within 10 days. %B(20,2) under 0.15 as the washout flag.
BTC: 125 confirmed bottoms. The flag caught 44 of them. 35%.
ETH: 129 bottoms. Caught 39%.
Compare that to 62.5% on SPY. The rule does not port.
Look at where bottoms actually print. Median %B at a BTC bottom is 0.26. On SPY it is 0.10. Crypto bottoms do not get as washed out relative to the bands, because the bands themselves are enormous in a volatile market. The 0.15 line was fit to SPY's personality.
Two more problems. Gold was worse than crypto: 32% recall, and the flag fired on 23% of ordinary gold days. In a slow grindy market the flag trips constantly and means nothing. And the 5% confirmation that works for SPY is noise for crypto. BTC printed 125 "bottoms" in 6.75 years. Most of those are wiggles, not washouts. You would want a 15-20% confirmation move before the pivots mean anything on BTC.
The one thing that survived everywhere: specificity. Across 345 tops in BTC, ETH, GLD, and SLV, the flag fired on 3. It still does not mistake tops for bottoms. It is just much worse at finding bottoms anywhere but SPY.
The lesson I keep relearning: indicators have personalities. A rule found on one market is a hypothesis about that market, not a law. Test it on the new market before you trust it there.
Sources: price data from Yahoo Finance (GLD, SLV, BTC-USD, ETH-USD daily bars, 2019-2026). SPY reference figures from the same study using Yahoo Finance and Polygon. Pivots defined as the lowest low in an 11-day window, confirmed by a 5% rally within 10 days. %B computed on 20-day, 2 standard deviation Bollinger Bands at the daily close.
I reverse-engineered every buyable bottom on SPY.
Here is what actually flagged them.
Instead of debating which indicator predicts bottoms, I worked backwards. I took 2 years of SPY daily data (501 trading days), found every pivot low that bounced 5% or more within 10 days (7 of them) and every pivot high that dropped 5% or more (3 of them), then measured what 13 technical studies were printing at each exact turning point versus ordinary days.
The winner surprised me.
Bollinger %B under 0.15 caught 86% of the buyable bottoms.
6 out of 7 bottoms printed %B below 0.15 at the pivot close. Zero of the tops did. Only 7% of ordinary days did. Quick refresher: %B measures where price sits inside the Bollinger Bands. 1.0 is the upper band, 0 is the lower band, below 0 means price closed under the lower band.
How the studies ranked (median at bottoms vs ordinary days):
• MACD histogram: -2.80 vs +0.42 (catches everything, but noisy, 43% false positives)
• Bollinger %B: 0.11 vs 0.67 (the clean trigger)
• Stochastic %K: 16 vs 83
• Stochastic %D: 21 vs 83
• RSI(14): 39.6 vs 55.3
The RSI surprise: median RSI at real bottoms was 39.6, not 30. The classic "buy when RSI goes under 30" rule caught only 29% of actual bottoms. Waiting for deep oversold meant missing most of the bounces.
Three rules worth forward-testing:
1. %B under 0.15 alone: 86% of bottoms, 7% false positive rate. Best single filter in the study.
2. %B under 0.15 AND price under the 50-day average: keeps most bottoms, trims the noise further.
3. RSI under 35 AND %B under 0.15: only caught 29% of bottoms, but zero false flags anywhere. Rare, high conviction when it fires.
Recent flags for reference:
Jul 29 2026 (%B -0.16, then +6.1%),
Jun 26 2026 (%B 0.14, then +5.0%),
Mar 30 2026 (%B -0.02, then +7.6%).
The honest part, because small samples lie: 7 bottoms is thin, the window was mostly bull market, and tops had no clean signal at all. In September the flag tripped 4 times without a full 5% bounce following, so treat %B under 0.15 as "conditions are washed out," not "bottom confirmed."
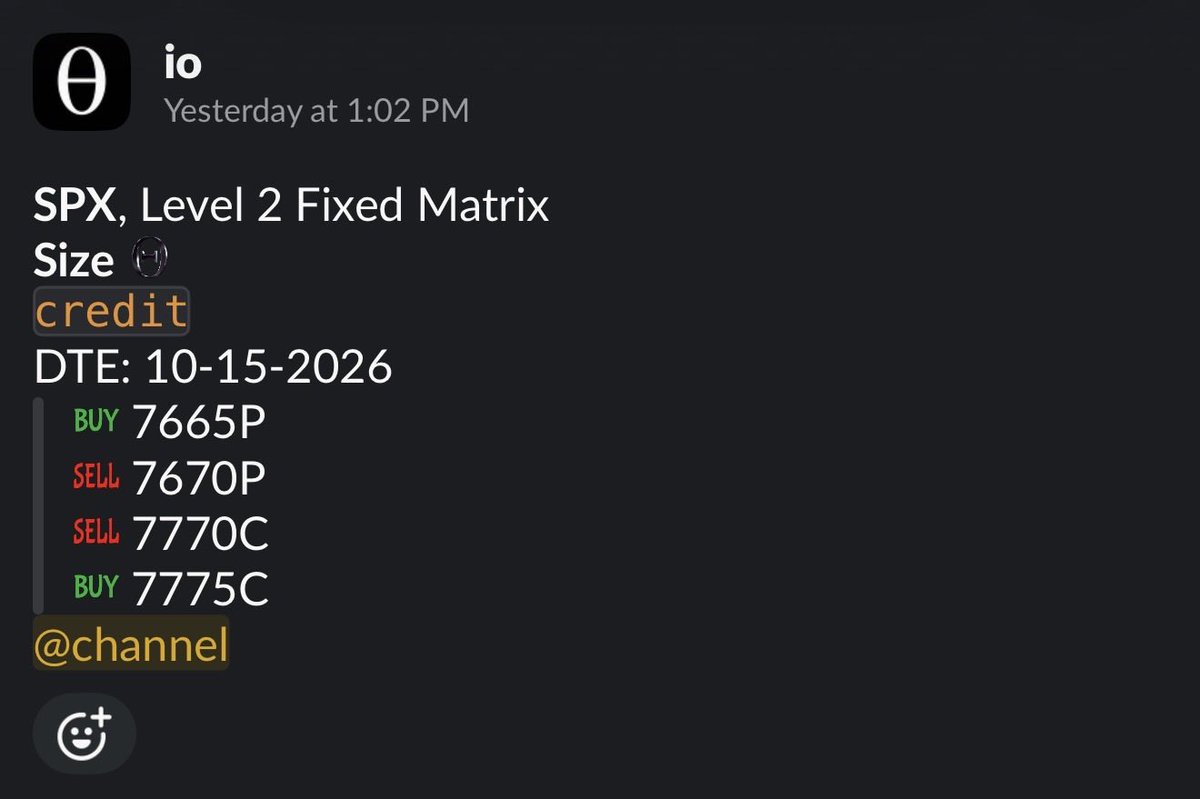
I am setting up automations to flag for these triggers live. When the next %B washout flags it will auto post in my slack. Was only able to pull for a couple years but would like to see a larger sample set
@prilonm I tested the settings on the study and it showed a shorter duration performed worse with false signals. So next day candles probably falls into that.
@0DTEQuant What do you mean? Setup feed to monitor for criteria’s then auto post / auto trade. I don’t plan to set this up for auto trade since I’m running my own Strat.
@BannekerTrades Yup it’s just the parameter I set which is 5% min bounce, so there’s definitely more smaller bounces that went unflagged. There’s room to adjust numbers to whatever criteria we are looking for.