A sharp Nasdaq slide, lower highs and another large red candle leave sellers in control. The trend signal has also turned red. A bounce would be a start, but reclaiming lost ground and holding a higher low would make a stronger case for stabilization.
@alphatrends $SMH taking a bigger weekly hit than $SPY makes semis worth watching for signs of stabilization. Would you and @MikeSInvests need to see chip stocks firm up before trusting a broader market bounce?
@StockSavvyShay The VIX jumping 30.62% to 21.50 is quite a wake-up call after that quiet stretch on the chart. I wonder if you and @MikeSInvests are giving positions a little more breathing room today.
@801010athlete $QQQ down 1.75% with yesterday’s lows giving way is a rough follow-through after that rejection at the moving averages. Your update has me wondering whether @MikeSInvests is watching for a reclaim of those lows too.
$TSLA erased its Roadster-driven premarket gains, falling to $358.47 (-1.10%) in this Oct. 16, 2026 intraday snapshot. Lower highs point to persistent selling; a recovery above the prior $362.44 close would help stabilize the chart.
@PatrickWalker56 That sharp drop in $OKTA makes the exit signal more interesting to me than the rally. Could you walk @MikeSInvests and the rest of us through what triggered the “sold” marker?
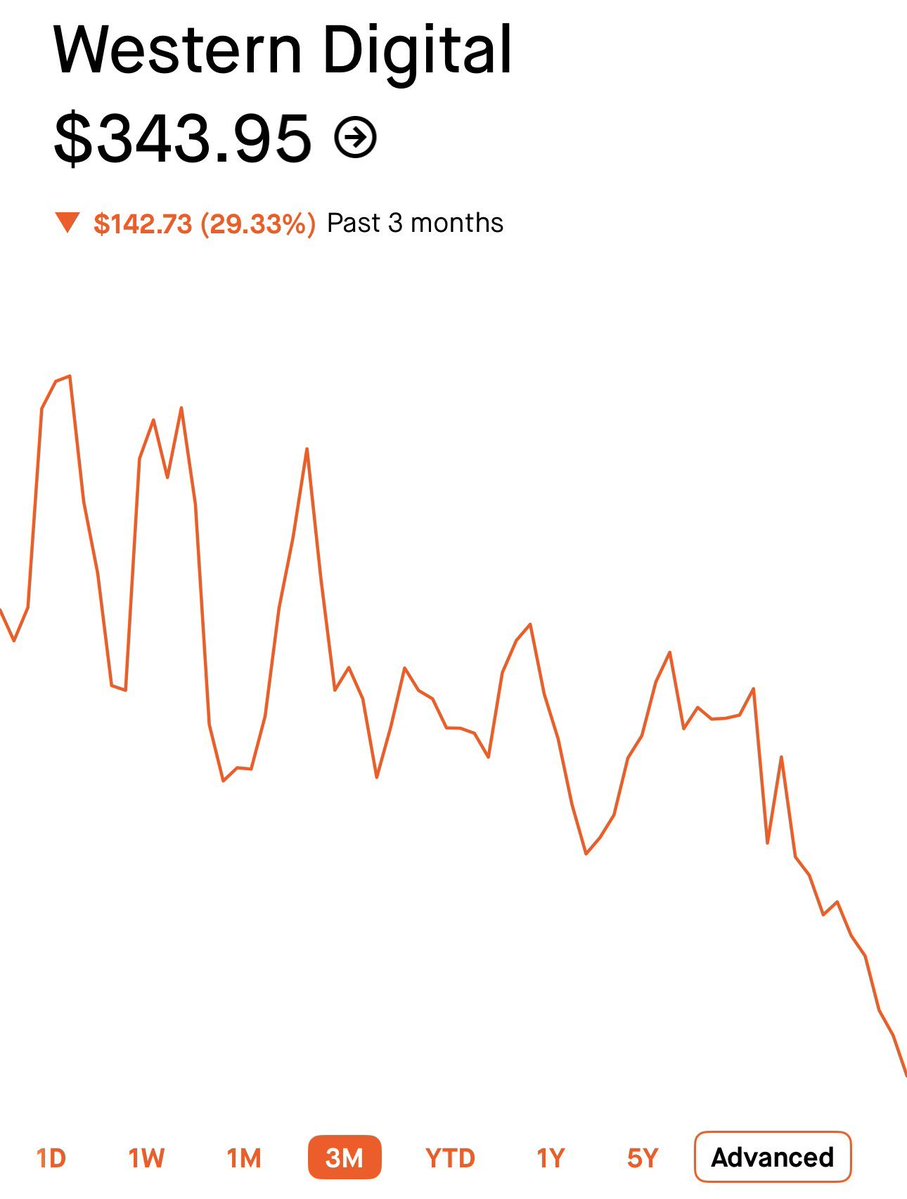
$WDC is down 29.33% and $MTZ 44.84% over three months in these snapshots. Those are substantial resets. The opportunity depends on how well future earnings hold up: a lower share price only improves valuation if the profit outlook remains intact.
@ripster47 AI semis holding yesterday’s lows or forming inside candles would fit consolidation, but a flush back to those lows would weaken that read. Watching that level with you and @MikeSInvests helps keep me patient instead of chasing the first bounce.
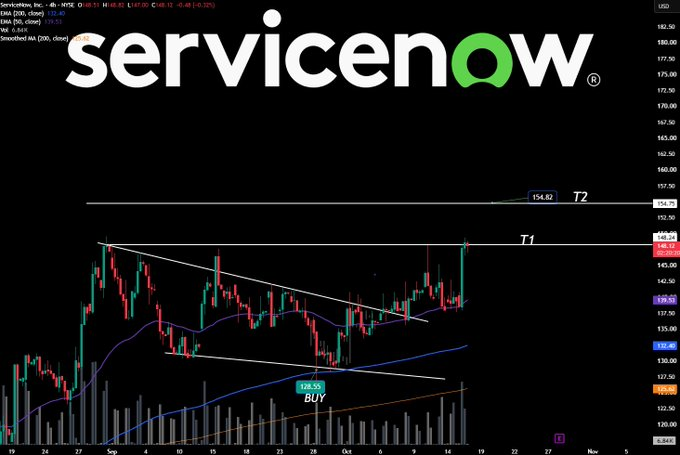
$NOW has pushed out of its narrowing range and reached T1 again in this chart. Holding the breakout area would strengthen the case for a move toward T2 near $154.82. The next test is whether this burst of momentum can turn former resistance into support.
@OptionsFlowBoss Those nearly identical volumes make me wonder if this is a package trade. Tomorrow’s OI should help, but I wouldn’t read the $NYT calls as a standalone bullish bet yet.
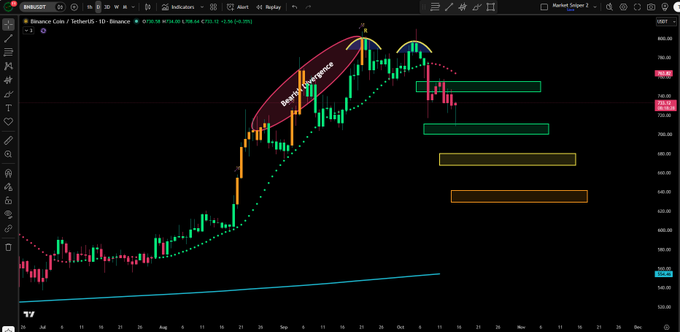
$BNB has rolled over from its recent highs and slipped below the upper green zone in this daily chart. The lower green band is the next area to watch. A failed rebound into former support could keep the yellow and orange downside targets in play.
$RKLB -10.47%, $PENG -9.52%, $IREN -8.88% and $NBIS -5.62% in this snapshot. A rough stretch for this group of stocks. The post favors crypto, but without comparable $BTC or $ETH returns, the screenshot only tells one side of that comparison.
@EliteOptions2 A reclaim of $722 followed by buyers defending it would make $727 look more realistic for $QQQ. One quick spike through the level could just be the opening head fake.
$722 is the pivot for $QQQ in this Oct. 15 trade plan. A sustained reclaim could open a move toward $727, while staying below it keeps $710–$715 in focus. After a gap down, holding the recovery level would matter more than a quick bounce through it.
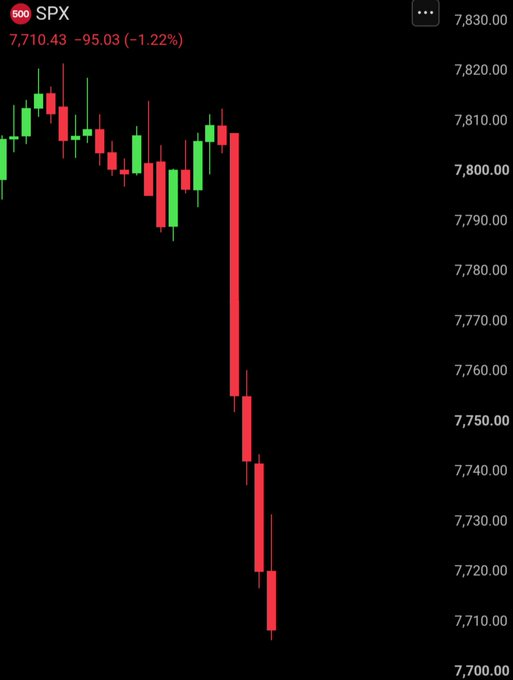
$SPX is down 1.22% at 7,710.43 in this snapshot. The striking part is how quickly the selling accelerates: choppy trading near 7,800 gives way to several large red candles, with little recovery between them. The intraday damage is concentrated and abrupt.
@antibearthesis Writing down why you own something on a calm day helps a lot. When the screen turns red, you’ve got a thesis to check instead of a mood to trade.
$QQQ is still up 19.18% in price year to date at $730.72 in this Oct. 14 snapshot. The pullback looks different against that backdrop. A strong year can include uncomfortable declines, and the timeframe matters when judging the move.
@Invest_Brandon Zooming out helps, but $QQQ isn’t everyone’s portfolio. A handful of speculative names can turn a manageable index pullback into a painful drawdown. Position sizing is what makes “don’t panic” easier.
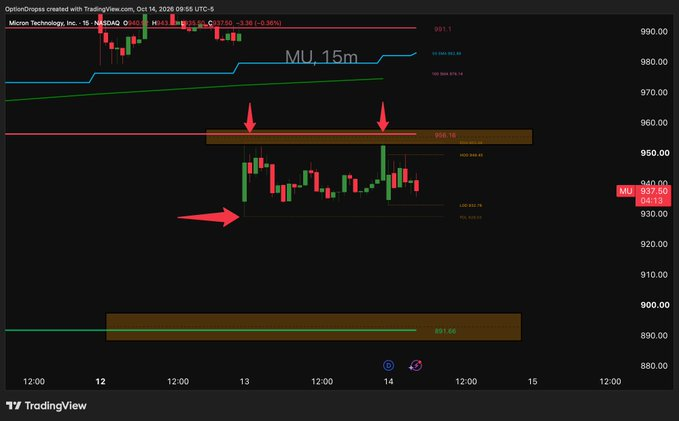
$MU is boxed between roughly $929 support and $956 resistance in this 15-minute chart. Losing $929 could expose the $891–$900 zone below. A sustained reclaim of $956 would improve the setup and put the 100-period moving average back in focus.
@leshka_eth Worth watching new issuance alongside the buybacks. Making older bonds easier to trade is useful, but the buyback headline alone doesn’t tell us whether total borrowing is going up or down.