Announcement ‼️
Sometime this week I will be starting a Substack that will be covering NBA, WNBA, and NFL to give you guys the best betting edge possible.
- I want to find more ways to help yall. Similar to how I do breakdowns for games for NBA and NFL through film and data, I'll be posting there.
- Minimum of 3-5 articles per week that should cover recaps, trends, game previews for all three sports.
- Any edge I can find, we'll talk about it through the Substack.
- Will try to have articles out each morning as I'll be putting a ton of time and effort into this.
- Will always try to answer questions to the best of my abilities whenever you have them.
Any other ideas you would like me to add to this to make the best experience, feel free to comment below and let me know!
I noticed a major problem for WNBA shot chart data tracking (midrange, above the break, etc.) just now and if you are gambling on the WNBA, I HIGHLY RECOMMEND LOOKING AT THIS.
For a long time now we've been looking at opponent shooting data by zone to look at where teams are funneling shots. The issue I found is how they are classifying the midrange and threes.
The Minnesota Lynx play today and according to the WNBA website in the team general opponent section, they are allowing most 3PA per game at 28.1 which in total this season adds up to 253 3PA.
Seems fine right? Well if you go into team opponent shooting and filter for shot zone, they are allowing 20.6 3PA per game. 186 3PA overall. 7.3 3PA per game and 67 threes overall difference is huge.
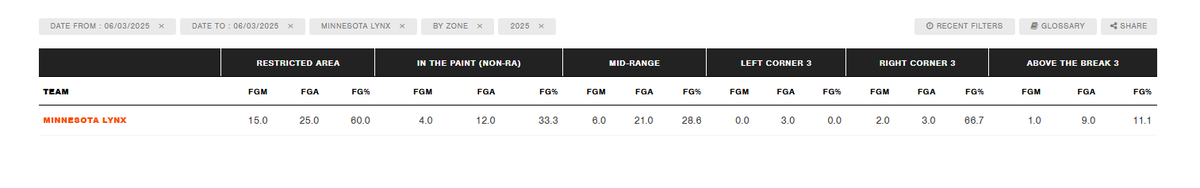
I chose a random game from last June 3rd which happened to be the same exact matchup. It had the same issue except it was more obvious.
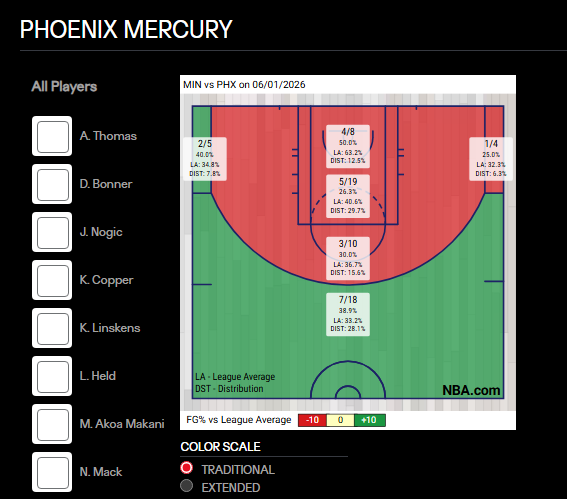
If you look at the shot chart of the Mercury shooting, it shows 4/6 from the midrange against the Lynx defense while also shooting 3/23 from above the break.
Now look at the shot zone data. It shows 6/21 from midrange allowed and 1/9 above the break allowed. That's a huge difference.
It should be matching but its not and that's a problem if you are using this data for gambling. From what I understand, they are coming from two different endpoints in the API.
I did further digging because no way teams are heaving the ball from half court that amount of times per game in just 9 games so there has to be an error somewhere and wasn't sure what it was.
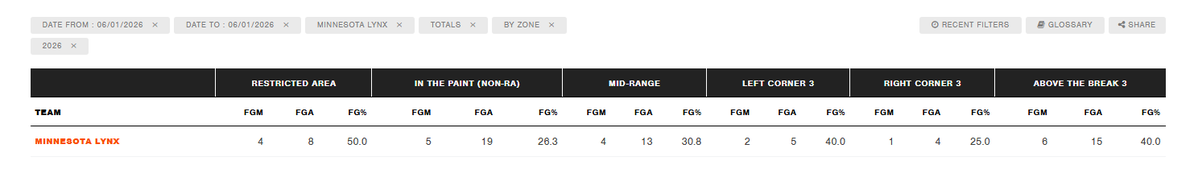
I went into the latest game for the Lynx cause I wanted to go game by game. The Lynx latest game was June 1st and under team general opponent, it shows 27 3PA, but when you look at the shot zone it shows 24 3PA. Doesn't sound like a big deal right? There is much more to it unfortunately.
June 1st they played the Mercury. Now if you go into the schedule on the website, click the box score for this game, then go to the game charts section and filter for shot zone, you see the discrepancy.
As you can see below on that shot chart, adding up all the threes gets you to 27, just like the team general opponent data. Now, if you compare the shot zone data from the WNBA Stats (team opponent shooting) with the actual shot chart, you'll notice the midrange and above the break seem to be getting classified differently as the shot chart has 3 extra 3PA while the shot zone has 3 extra midrange FGA.
Can't speak highly enough of the Spurs role players like Keldon Johnson and Julian Champagnie stepping up here in the fourth and drilling these 3s. This is the biggest spot in any of their careers and they're just absolutely living up to it in every way.
Josh Hart -- the player the #Cavs are intentionally leaving open -- has the same amount of 3PM tonight as Mitchell, Harden, Strus, Merrill, Tyson & Schroder combined.
Introducing Correlated Props.
Pick a player and a stat threshold (Ex. Harden 6+ assists).
See every teammate's hit rate against their line, their average in those games, and the lift vs. their season number.
Beats the SGP correlation tax by finding correlations the apps haven't priced.