Cheapest bubble to burst ever?
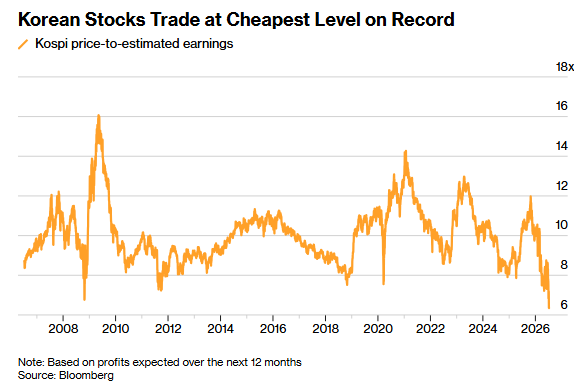
If Korea's equity market was in a bubble this year and if that bubble had in fact just burst, would be the cheapest bubble to burst ever.. went from 8x earnings to 5x earnings now
As of July 13, 1.2 million Korean leveraged retail accounts triggered margin calls; of these, 320,000–360,000 accounts were fully forcibly liquidated by brokers (some had partial negative balances owed to brokers).
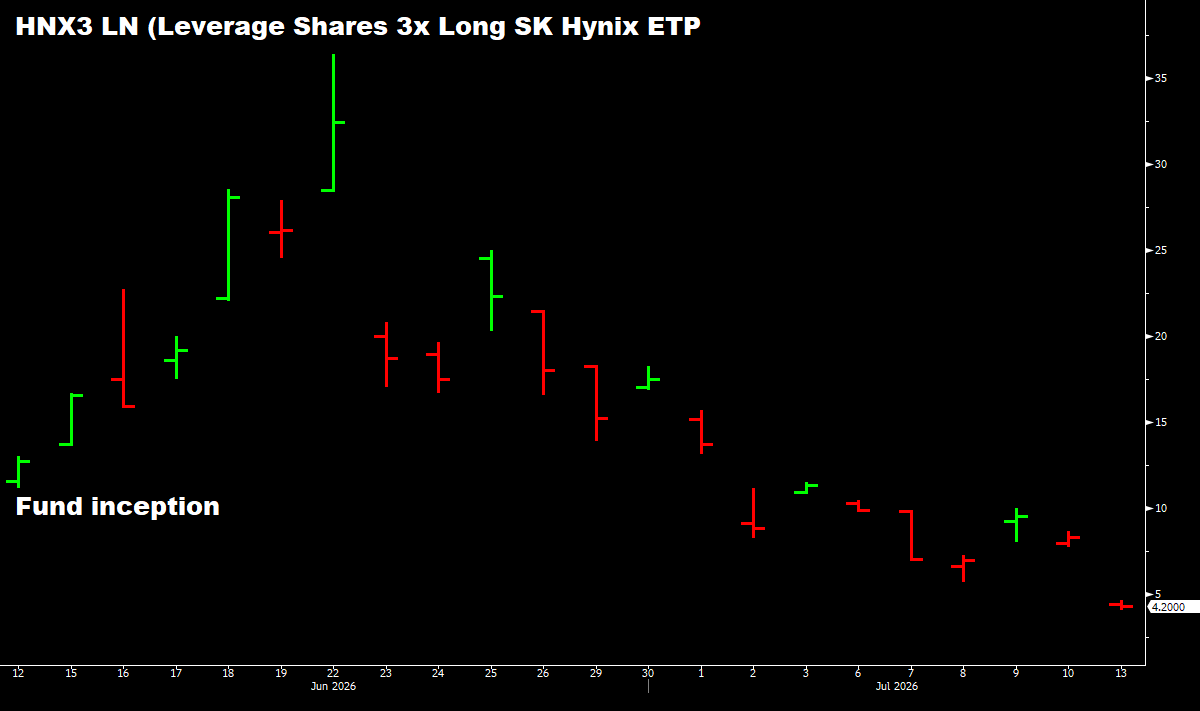
The 3x SK Hynix fund was launched one month ago, peaked at 36 three weeks ago, and is trading at 4.
The 2x fund (7709 HK) is down 70%, and still has $9bn in AUM...
🦔Bloomberg data shows total US cash (money market funds plus bank deposits) as a percentage of S&P 500 market cap has fallen to 0.42. That is near the lowest level ever recorded, matching where it sat right before the dot-com crash. Money market funds are at a record $7.95 trillion in absolute dollars, but the S&P 500's market cap has ballooned to roughly $69 trillion. The cash pile looks massive until you measure it against how big the market has gotten. There is less dry powder available to catch a selloff, relative to market size, than at almost any point in modern history.
My Take
I think this is one of those charts people will point to after the fact. $7.95 trillion in money markets sounds like a wall of cash ready to buy any dip. But at a 0.42 ratio to S&P market cap, it's thinner than it was before the dot-com bust. Households have 45.8% of their financial assets in equities (Q1 2026 Fed data), the personal savings rate is around 3%, and retail investors are buying every single dip with record options volume. Citadel's own H1 2026 report says retail bought 3.5x their average daily amount on every down day this year.
The "cash on the sidelines" story is how everyone explains why dips keep getting bought. And in absolute dollars it looks true. But relative to how large the market has become, the available cash to absorb a real selloff is about where it was in 1999. I'm not calling a crash. I'm saying the cushion is a lot thinner than the headline number makes it look.
Hedgie🤗
Shocking stat of the day:
Nvidia, $NVDA, Micron, $MU, Broadcom, $AVGO, and Applied Materials, $AMAT, are now expected to generate a record $430 billion in combined free cash flow (FCF) over the next 12 months.
That would be more than TRIPLE the FCF they generated just 2 years ago.
At the same time, the combined FCF of Amazon, $AMZN, Alphabet, $GOOGL, Meta, $META, Microsoft, $MSFT, and Oracle, $ORCL, is projected to turn negative for the first time on record.
That would mark a massive reversal from the +$260 billion peak reported by these companies in 2024.
This comes as AI-related CapEx by these 5 companies is estimated to surge to ~$1.8 trillion in 2026 and 2027 combined.
Chipmakers are becoming cash machines, while AI giants are burning record amounts of capital.
Korea's banks are running out of dry powder to keep the stock bubble rising
South Korea's five major commercial banks have exhausted over 85% of their annual household loan growth limits in the first half of the year due to persistent demand for home mortgages (which are being used to fund stock purchases) and direct stock market investments. Under strict regulatory caps designed to limit annual growth to 1.5%, the banks have collectively increased their household loan balances by 3.69 trillion won out of their combined 4.33 trillion won annual limit.
With at least two banks already exceeding their yearly targets, financial markets anticipate a severe "lending cliff" in the second half of the year as banks are forced to restrict new loans and prioritize repayments
https://t.co/Wpi5HbhP8V
BREAKING: Circle stock, $CRCL, surges over +15% after the U.S. Office of the Comptroller of the Currency grants the company approval to operate as a bank.
BREAKING: President Trump says Iran has asked the US to continue "talks" and he has "agreed to do so, but the US has stated to them, in no uncertain terms, that the cease fire is over."
I have been posting updates on earnings estimates looking forward into year-end. The latest update shows the next 3-quarters continue to increase. Those increases in forward estimates support current valuations, but also rising at a pace usually only seen coming out of recessionary downturns.
h/t @thedailyshot
Silver ETF holdings were down nearly 53% just a few days ago.
That marked the largest drawdown in both percentage and nominal terms on record.
The last time we saw outflows of a similar magnitude was around the March 2020 low and again near the 2022 bottom.
Market bottoms are a process, not a single event, and this continues to look like one.
https://t.co/dfrFdnEtS0