I was told Joel Embiid was washed defensively. However as a primary defender, his Defended FGA % numbers look very similar to someone people consider one of the greatest defensive anchors of all time.
He is, btw
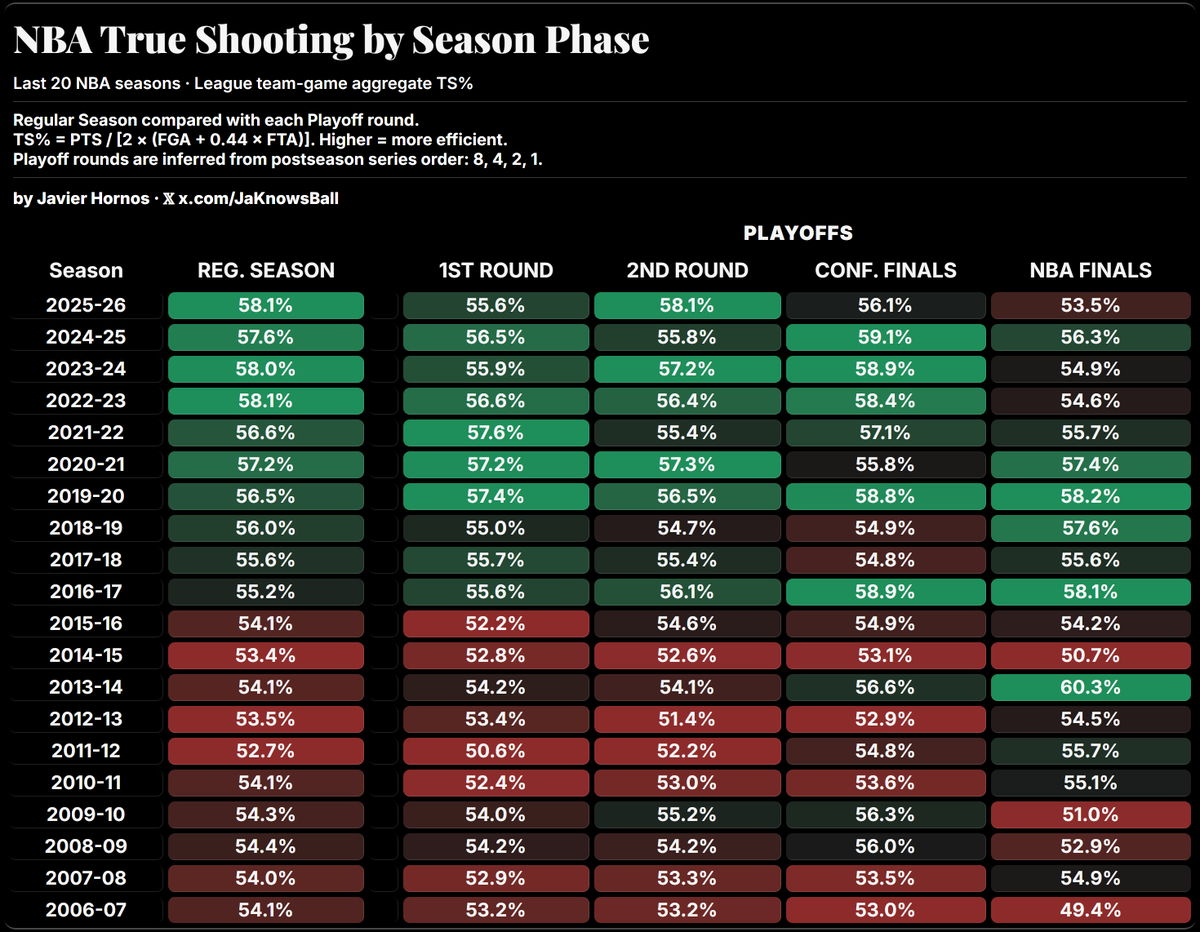
Good teams will always figure out their offense in the biggest stages. Obvipusly those are small sample sizes, especially in the Finals, but while the regular season gets more efficient, the Playoffs do too.
I've seen some people argue that efficiency just dips down in the Playoffs. But this... isn't true.
Over the last 20 seasons, Playoffs TS% has always kinda correlated with Regular Season TS%.
The only point when we notice a significant drop consistently is in the NBA Finals.
These are the biggest NBA Playoff Droppers this postseason, compared to the regular season.
Measured in traditional stats per 100 possesions.
Jalen Duren had the audacity of doing this on contract year btw 😭
@jackruhanen And would you expect that to translate into the NBA? Imo there are 2 options: NBA defenders will adjust to his scoring making it inefficient again, or either his wild shot selection could give him a niche within the league. TJ McConnell comes to mind quickly
@jackruhanen Ohhh I understand. That was the exact same approach I took when trying to track the NBA players that overperformed in TS% compared to shot quality. That's actually my way to measure show quality without tracking services lol. Nique Clifford numbers are impressive
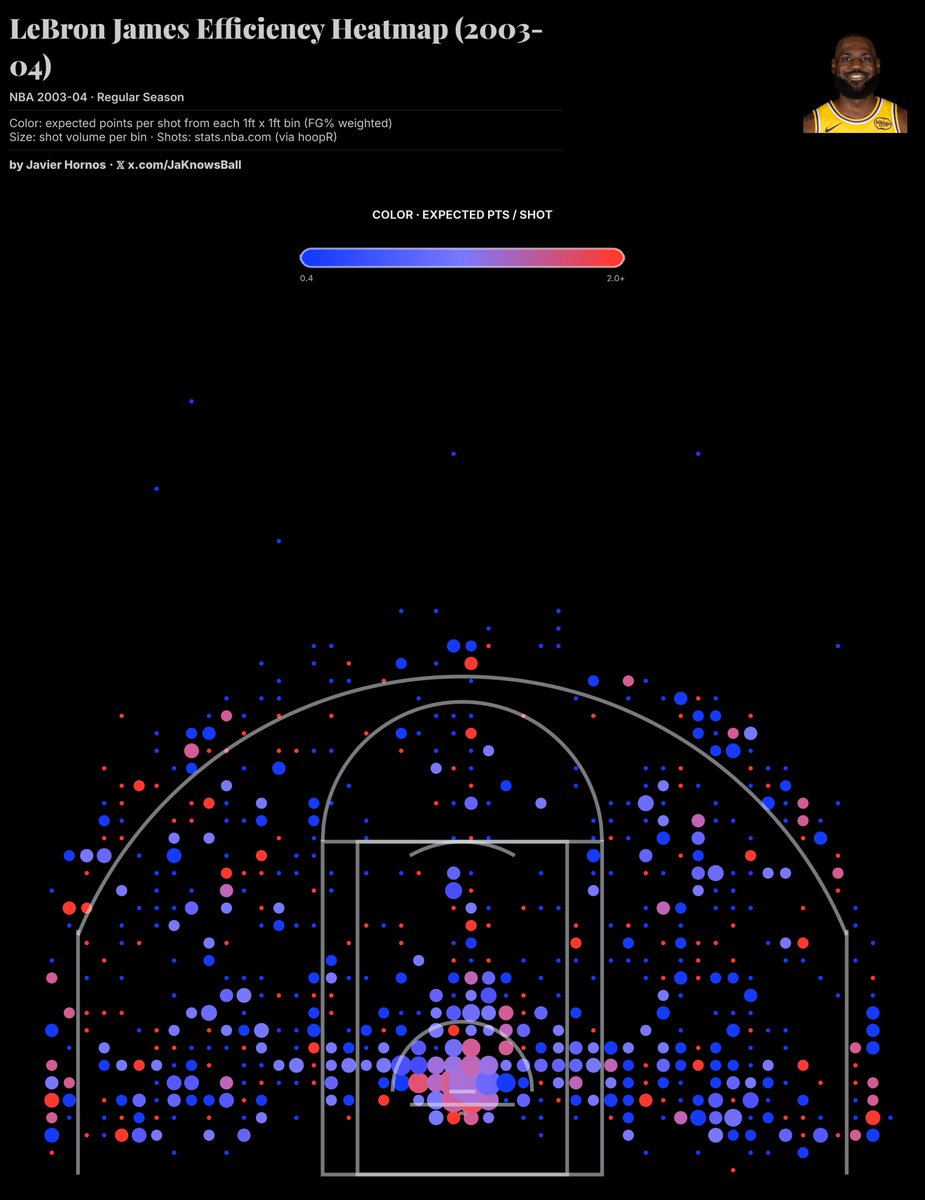
Left side is LeBron's efficiency map in the 2003-2004 season, his rookie year.
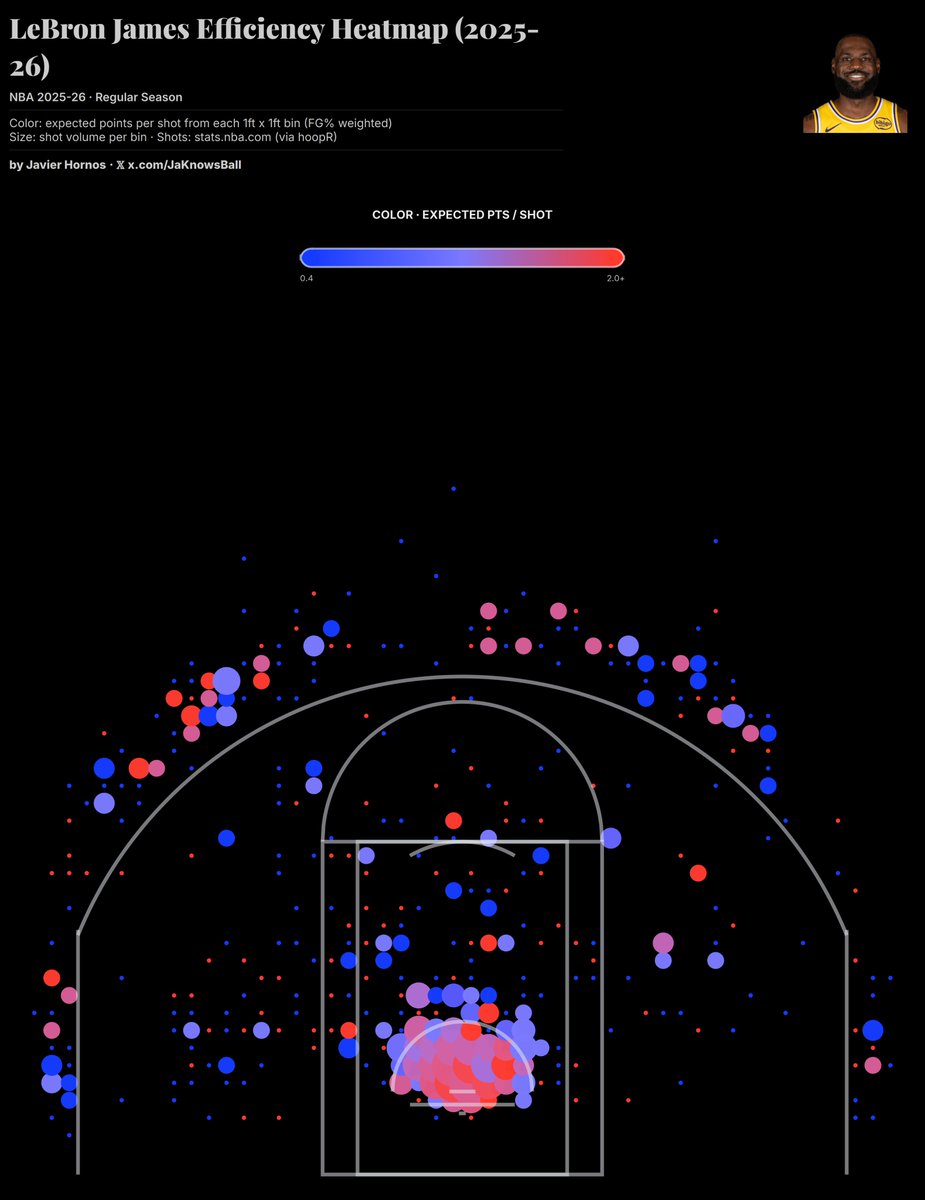
Right side is LeBron's efficiency map in the 2025-2026 season, this year.
Name a single player who was able to adapt to two of the most different brands of basketball in NBA history
LA's 9th most common set this season is a post entry followed by a simultaneous corner flash cut and flare screen.
1.23 PPP on the season = ELITE efficiency
But yesterday we had several confused Lakers players and ended up with it basically just being a freelance post up.
And this is the landscape:
- ↔️ Average range of each 3pt attempt
- ↕️ Average efficiency on 3pt attempts
Boston, Phoenix and Charlotte stand above the rest, taking longer 3s and hittin them
Denver and Milwaukee are the best 3pt shooting teams overall
Not only are NBA players with range. There are also teams with range.
This chart shows the average distance for every 3 each team has attempted this szn:
- Top teams take more risks, bottom team less.
- Range doesn't necessarily correlate with efficiency
- Charlotte Hornets
Have you ever wondered what's the most expensive shot in the NBA?
This shotchart shows the average salary of every scorer that made a shot from each location of the court.
Blue / Purple dots = Low Average Salary
Yellow / Orange dots = High Average Salary
idk if Mario Saint-Supery is *that* far from the top PG tier in this class
< 8.2 ast per 40 (98th percentil)
< 2.6 steals per 40 (87th percentil)
< 2.9 A/TO
< 48% in 3P% and 88% in FT
< 44% 3PAr and 40% FTr
TS% up to 58% after an horrible start in 2P% and being ill last weeks