I'm a country lad with a passion for music, guitars and personal finance. Graduated with a Bachelor in Audio Production. Also an aspiring entrepreneur.
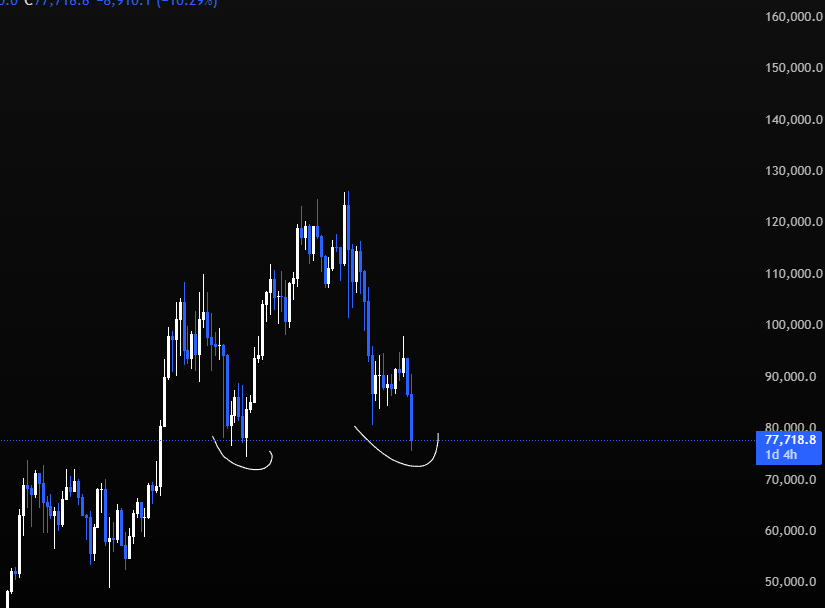
$BTC Dropped from my time counts as predicted. Not at all surprised. A 3D MACD Hidden bearish divergence occurred and trendlines lined up perfectly. Also had a retracement of the 0.618 with Moving averages moving down. All these things combined gave added confluence to this call.
All time counts are from significant swing highs / lows on the Weekly Timeframe. What do you notice about the numbers? They all line up to current swing high in early May. I have a feeling that $BTC will go lower from here. I don't have a price target. Time will tell.
Met one of the best forecasters going round! Thankyou @Phil_J_Anderson for a very intriguing meetup for us @PropertySharem1 subs. Can’t wait for the next one. Cheers!
My prediction for the #SPX500 top comes out to October 2027. It is based on important time counts from the March 2000 top to current. Time is more important than price! Easier to forecast too. Cheers
🚨Retail investors are trading stocks at the fastest pace ever recorded.
Even 12% above the January 2021 meme stock peak.
Citadel Securities, which processes roughly 40% of all US retail order flow, confirms May 2026 is on pace to be the most active month for retail cash equity volume in history.
Retail options volume is running 60% above the historical monthly average.
Semiconductors have become the most popular target. Retail options volume in semiconductor stocks is now running at 2.8 times the post-2020 monthly average, up a third from just one month ago.
Retail traders have been net buyers of stocks in 16 of the past 18 weeks.
The last time retail activity came anywhere close to this was January 2021.
That month ended with GameStop, a market wide correction, and billions in losses for retail investors who bought at the peak.
Great sesh today in Melb. Many thanks to @Phil_J_Anderson for his presentation and answering all questions by PSE subs. Look forward to the next one. 🏡📚📈
All time counts are from significant swing highs / lows on the Weekly Timeframe. What do you notice about the numbers? They all line up to current swing high in early May. I have a feeling that $BTC will go lower from here. I don't have a price target. Time will tell.
$BTC is currently down 64-65% down against $GOLD. We see diminishing losses each cycle. As we are in the midst of the bear market for $BTC and #Crypto I can't help but wonder if February is the month we start to turn things around. We are close to a bottom on this metric. DGU!
$BTCUSD with BTC Risk Metric overlayed on the chart is giving a very fascinating reading at the moment. On the 2W Timeframe it is at levels seen in 2011 and 2018 bear market bottoms! On the Monthly timeframe it is reading the lowest level ever! How the F**K can you not be a bull!
#Bitcoin monthly Bollinger band continues to squeeze the tightest that it has ever squeezed, indicating that the real big move has yet to come, despite recent low time frame volatility.
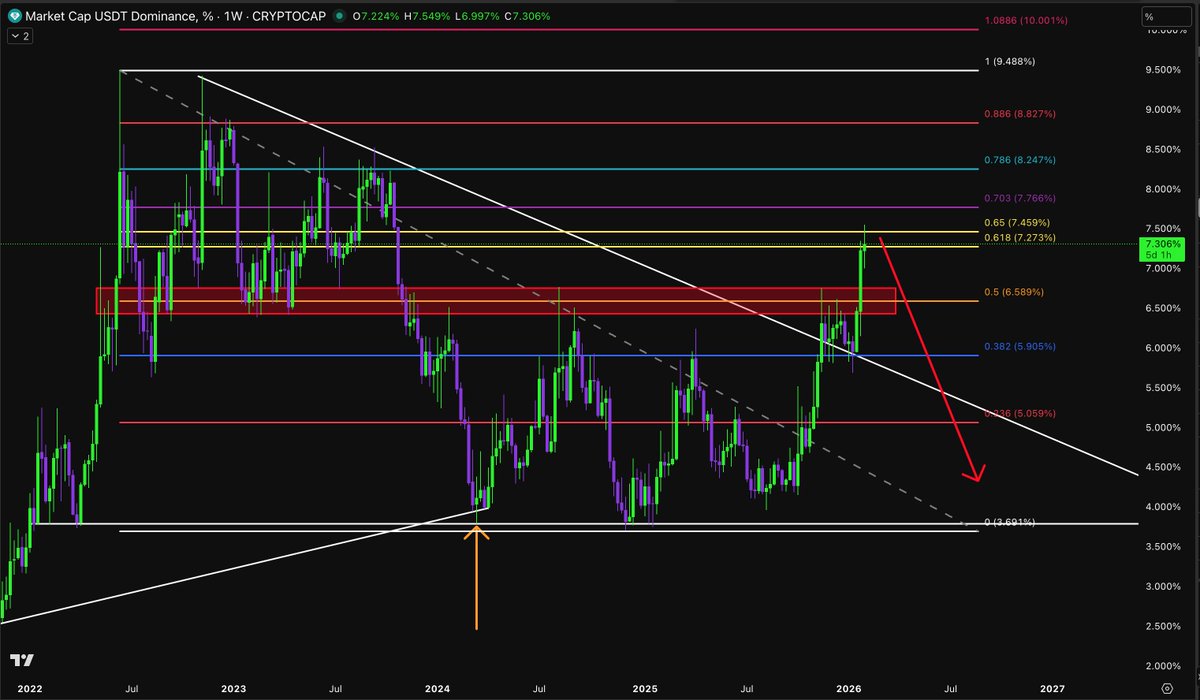
$USDT.D Has retraced to the 0.618-0.65 Fib golden pocket. Should see $USDT stablecoin dominance drop from here. I have just called the top. Very bullish on #Altcoins from here on.
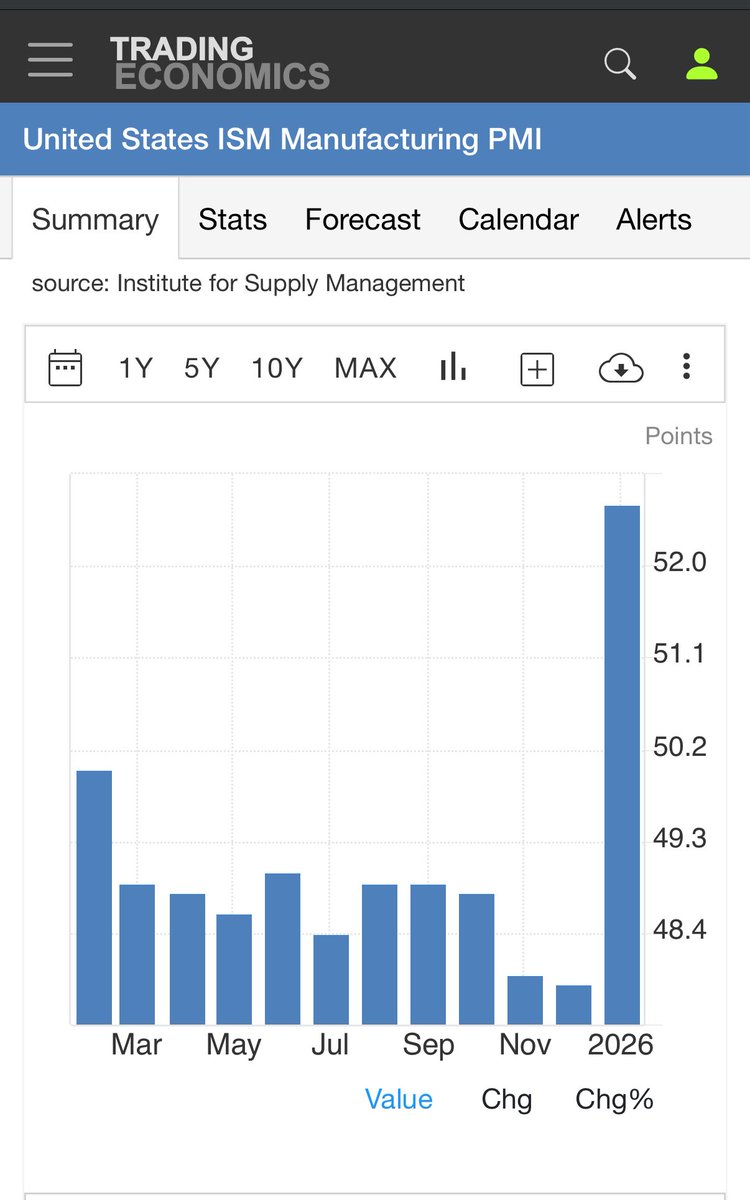
The ISM Manufacturing PMI has smashed expectations of 48.5 and now above 50, with a current reading of 52.6! This is what $BTC and #Crypto has been waiting for to get its next impulsive move higher. #Altseason is coming fast!