Fintwit, I'm going to start posting more. All I want to talk about is small cap liquidity. My goal is to post once per day on days the market is open.
Most people inherently understand that small caps are empty liquidity vehicles. Which means in order to trade small caps, we must understand how liquidity works.
Every post I'll make will focus on some observation of how small cap stocks move. And how liquidity is generated and controlled to execute the stock's ultimate intention.
There are laws of liquidity which must be followed, just like how there are laws of physics. Market Makers (MMs) cannot do whatever they want, liquidity in the stock, liquidity in the market (the "conditions"), and the order book determine what is possible.
The main goal is to develop a deeper understanding of the "tricks" MMs use to generate the liquidity they want. I will focus on developing a holistic understanding of how small caps move across different time frames, the minutia of how small cap algos work, and give an overall view of how "market conditions" affects price action in a variety of situations.
I am neither short-biased or long-biased. I press both buttons. The frequency of shorts is higher than the frequency of longs.
I have a Patreon/Discord where I talk about this more in detail. You are under no obligation to join. Outside of word of mouth and my bio, I never market it. Feel free to join if my content interests you. https://t.co/jUdZCyxPWZ
Final Note: There are many ways to make money in this market. Some very successful people don't use any of the stuff I talk about, and some do. You have to decide the type of trader you want to be.
Hey Fintwit, today’s random topic is about what I consider two (but not only) fundamental truths of the low float market, and how they should shape your thinking.
Both of these truths might sound obvious, we must understand them at a deep level to truly understand how low float liquidity moves work.
The first truth is simple: In the market there is the order book, and the tape. The order book represents the sitting orders on the bid and ask. The tape represents the orders being executed that move through the bid and ask.
In order for a stock to go higher, there needs to be more buy orders than what is sitting on the ask. And for the stock to go lower, there needs to be more sell orders that what’s on the bid.
Pretty simple, let’s go to the next one.
The second truth is this: In order to push a stock a high %, let’s say 500% or 1000%, you must accumulate the stock at lower % first.
Which means to push a stock 1000% in a single day, you MUST accumulate 200-400% first, then (in a variety of ways), eventually push to 1000%.
What does that mean? That means every stock that has pushed a “crazy %” or made an “insane move” had to accumulate lower first. And it’s worth studying how that accumulation happens.
There are a variety of ways stocks accumulate, and there are many factors that are important: What’s the price point? What’s the volume? How is the algo controlling the stock to create the type of order book they want? What time frames should we be looking at?
These are all important and I don’t have time to go into every notable factor. But in general, a few things are true on “insane runners.” Notably they often move on longer time frames (5m and 15m very common, sometimes even longer if MDR)… they often bait “common short patterns” early on (Hod clearouts, big long traps that knife heavily down, etc.)… and they abuse “common thinking” such as “high gapping % is bearish” or “I only short premarket/market open gappers”.
There are other factors I could mention, such as how the daily is manipulated going into the move… or analyzing the current liquidity situation of the market in general (the conditions or themes running), but I’ll save that for another time.
For this post I just want to focus on how stocks bait common short patterns, especially in premarket or near market open on shorter time frames (1m/3m), only to soak and accumulate on longer time frames (5m/15m) to squeeze higher.
In other words, you long trap on shorter time frames, then you short trap on longer time frames.
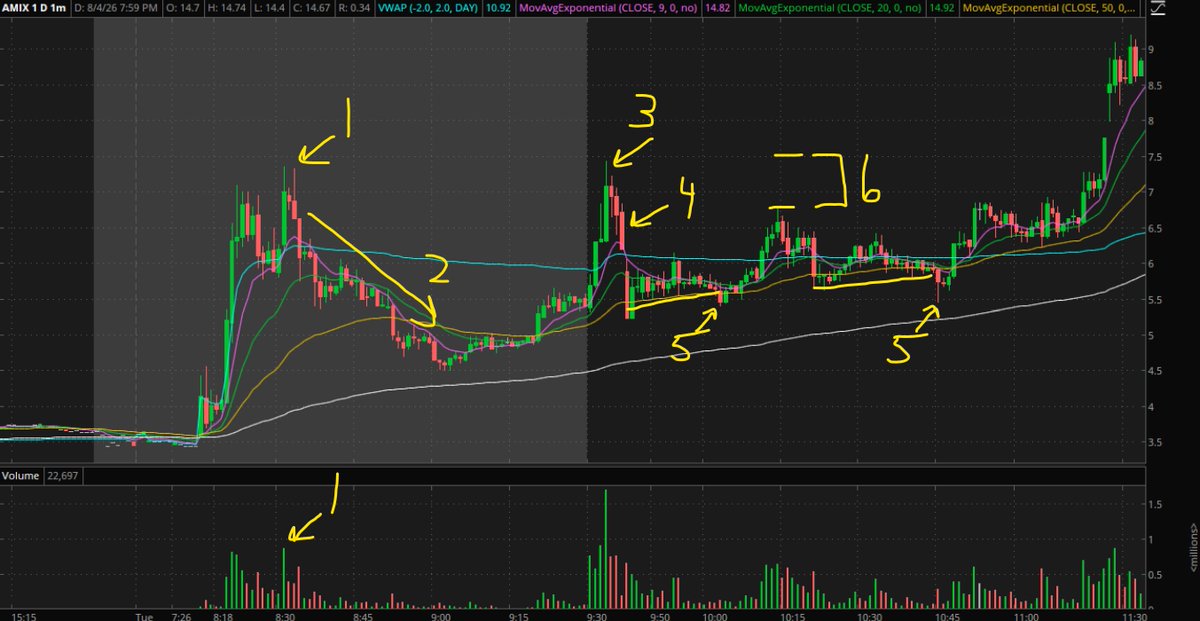
We will use AMIX from Aug 4, 2026 as an example.
First is the daily. Without going into too much detail it is potentially bullish. The first image below is me in my discord calling it would when it was trading in the $9s.
But what’s more important is how they set it up both in premarket and market open before going into the big push. This is the second image below, let’s go thru it point by point.
#1: They bait a HoD clearout pattern early on in premarket on a 100% near instant gapper. There is also increasing vol lower, this is common early accumulation on high price tiny float premarket action.
#2. We get a huge dump from HoD followed by near down only selling for half hour straight. This serves a few purposes: Chasing shorts are constantly IMO and the only way to add is to avg down. Every long dip buyer gets instant stopped. But most importantly, the more aggressively a stock dumps/knives down, the emptier the order book becomes to the UPSIDE.
And remember, in order to push a stock higher, you MUST buy more shares than what’s sitting on the ask. And aggressive selling/knifing creates a very empty ask to the upside.
Anyway #3, because we have this VERY empty order book higher, they are able to abuse market open liquidity (a major liquidity event) to push for ANOTHER HoD clearout, which instantly rejects and downhalts down (#4).
So now we are baiting the “market open shorts” with a common HoD clearout pattern, and instantly giving them what they want. The downhalt at #4 creates the same situation as #2, the downhalt creates an EMPTY order book to the UPSIDE.
However, liquidity is now decreasing after the market open event. And decreasing liquidity means a shift to longer time frames. No longer is the stock moving on the 1m, and it is likely to be moving on time frames such as the 5m/15m.
Next (#5) we get a set of common “algo tricks” as the stock is potentially accumulating at lower price points. There are many to discuss, but the most common is to set up a very “readable”, obvious higher-low “bid prop”, where a clear higher low trendline is being held, only for the stock to stall and knife into the higher lows (#5). In both these cases we can see quick reclaims quickly after the props attempt to crack lower.
Another common trick is #6. This is where the lower highs being painted are “far away” from HoD (say, 8-15%). HoD here is right at $7.50 (which also represents potential half-dollar bait, another common trick) and the lower highs on this 10:10am push sitting around $6.8ish. This is potentially bullish as all shorts are piling in at lower price points quite far away from HoD. And because of the downhalt at #4, we know that the order book is quite empty between $6.80 and $7.50.
Which means any rotation thru this level can be dangerous.
Anyway, let’s go to image #3, where we look at the 15m chart.
As we see here, despite all this premarket/market open “manipulation” happen on a 100% gapper, the stock is simply riding the 15m9 ema (also 5m9/5m20, which highly correlates to the 15m9). Which means, on both the 5m and 15m time frames, the stock is on the initial frontside of the move. The volume on both these time frames is also wonderfully consistent and at times increasing. These are bullish factors.
So we have a 100% premarket gapper, we have common short patterns both in the premarket and market open, we are baiting shorts on shorter time frames. We are aggressively knifing the stock lower after HoD pushes to empty the order book to the upside. And lastly, we are knifing directly into longer time frame MAs that the “rigger” is potentially accumulating on. All while having a potentially bullish daily and trading common high price/tiny float price action.
All pretty interesting stuff!
And since we are on initial frontside of the move on the 5m/15m, the range expansion potential to the upside is huge. The initial frontside of the move is the most dangerous, especially with very tiny floats on bullish dailies. We don’t know what the intention is, we don’t know how much they accumulated, we don’t know how many people are stuck, we don’t know exactly how empty the order book is as we break thru the $7.50 HoD level.
And as long as the volume stays consistent and we are on initial frontside of the move, the “rigger” can simply keep accumulating even as shorts attempt to short the “insane gapper" in the high single-digits and low-mid 10s.
And for the last image, I want to discuss the range expansion structure. A very common range expansion structure “trick” on initial frontside of the move is to give an excessively aggressive first leg up (#1), do some type of “fake stall” to bait the “make my money back” shorts (#2), then a second, even MORE aggressive leg up (#3) as it squeezes thru the empty order book higher.
Anyway, I think that’s is for me for today. This was a cool move. I could talk about the afternoon price action but I think I went on long enough. I cover that type of thing in my patreon videos if you are interested.
Hey Fintwit, seems like my ambitious “post every day” fell through. But now I’m (inconsistently) back at it! And I was to review some July plays that fit into both “initial frontside of the move” and “China/Asia tickers”.
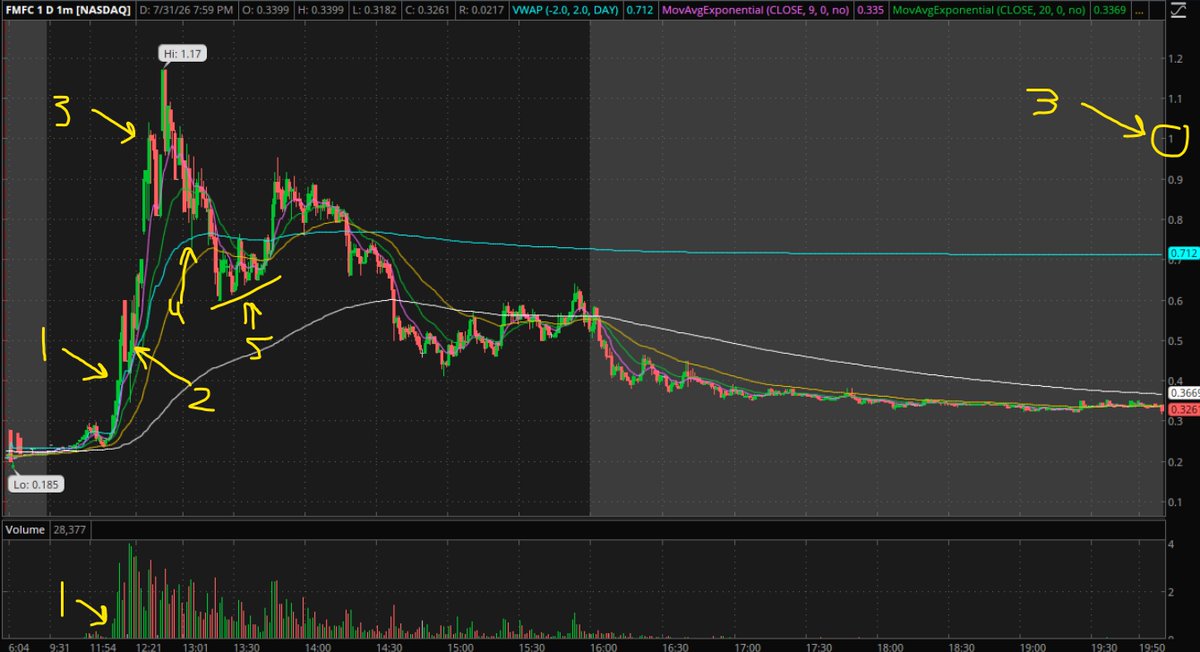
Let’s start with FMFC last Friday. Cambodian play, but I’m pretty convinced all these Asia stocks use the same/similar group of “riggers”, cuz they all move exactly the same. Same tricks, same bait, same empty order book.
In the FMFC chart below, at #1, you’ll notice this $0.20 penny stock pops over 100% on almost zero volume (#1 on the chart). This shows just empty these order books on Asia stocks are. Barely any vol, and pop some never-traded-before random Asia penny stock 100%. Remember, contrary to popular belief, gapping % can often be bait. Basing your bias (usually short bias) on it can and will get abused by much smarter people.
Also, the stock is on initial frontside of the move, and in this case, due the volatility, moving purely on the 1m chart. Suddenly, much bigger vol comes into the move and we get an uphalt, and into an immediate downhalt (#2 on the chart). Downhalts on initial frontside of the move can often be short bait for higher. Because it accomplishes two things: It empties the order book to the UPSIDE (very little asks get repopulated as the stock aggressively knives down), and it convinces people that “This stock up over 100% is downhalting, it must be weak!”
Side note, there is a huge game theory aspect to low float/penny day trading. Very important to know how most other people think in this market and what their expectations are.
Remember, on initial frontside of the move, almost anything is possible, especially China/Asian tickers. The order book both up and down in incredibly empty, the true float of the China/Asia is often hidden/obfuscated, and we don’t know what the intention is. Also, we just had a huge penny runner the day before on Thursday in CYCU, bringing in some potential sympathy strength/liquidity into pennies.
Anyway, we get even more aggressive pushing up the 1m9ema, which is inherently bearish. Because just how downhalts create an empty order book to the UPSIDE, overtly aggressive pushing creates an empty order book to the DOWNSIDE. However, in order to short, we still need more information, and a greater understanding of common “tricks” that happen before we can be confident in any type of “topping” read.
Which leads to #3 on the chart. We get a stall right at $1, into an immediate downhalt. If you remember my previous post on China/Asia, I often say they love to bait both half/whole dollar levels. And the downhalt at $1 creates the same situation as #2. It creates an empty order book to the UPSIDE, allowing them to immediately uphalt the stock after the unhalt resumes, attacking the “$1 resistance” shorts on a stock up almost 400%.
Now we are getting closer to a topping read. At this point we are like 400% straight up the 1m9ema, we are baiting early shorts with multiple downhalts, and near the potential top. We baited $1, squeezed that liquidity level up to $1.17, and are reaching a point where the 1m9ema might crack.
An important thing to note about shorter time frame moves, especially on things like the 1m or 3m, is that the more often they repeat the same ema, the more likely that ema will fail. Even if a stock wants to push higher, you will see 1m9/1m20 or 3m9/3m20 ema cracks, it will pull back to a longer time frame (5m/15m are common), then push sometime later. You long trap on shorter time frames, then short trap on longer time frames.
However, since FMFC went straight up the 1m9ema 400%+, midday continuation is less likely than other scenarios. On the backside, things like “fake vwap support” (#4, blue line is vwap) and bid props lower (#5) are likely to get attacked as the stock fades lower.
I’m leaving out more details that I can’t fully cover here. If you’re interested I cover them more in my room, and especially my Sunday Reviews. But I will periodically cover random plays I find interesting here. Not everyday, just whenever I feel like it.
Hey Fintwit, today I’m gonna talk about longing vs shorting in small caps / low floats.
Lots to talk about, and hard to know what to focus on. But in general, when most people enter this market, they pick either long bias or short bias.
Short bias traders operate under the assumption that these companies are fundamentally worthless, and any big gap is destined to fade. They assume, correctly, that these stocks are constantly fighting against gravity, and with enough extension they will eventually fail.
Many short traders tend to lean towards wider risk deeper holds, since it’s hard to know how many liquidity swipes upward the stock will go before eventually fading. They accept big losses on truly strong stocks as part of the game, and rely heavily on data to back their decisions up.
Long traders tend to be more short-term focused. The often repeatedly scalp moves and are looking to make their money fast. They don’t want to deal with HTB brokers and locate fees.
However, most long traders rarely catch big % moves, where they are holding the majority of their position 50-100%+ past their average. Not only is it because these types of moves are rare, but they don’t know how to differentiate between the few tickers which have that potential and the ones that don’t. They learn quickly that they are much more consistent scalping rather than holding for huge moves.
One major thing I would like to point out is that short traders are mostly reactive, where long traders, especially the ones that DO catch 50%+ moves from their average, are proactive.
Short traders often lack understanding of accumulation structures and how big moves are prepared ahead of time and get started. They just know, “this ticker is up X%, therefore, I am now short-biased.” They are both looking at how big the gap is and how aggressive the move got there (X% move in Y minutes). Their reads involve reacting to what the stock is doing near the highs, and study “topping action” to determine an entry.
The few long traders that do catch big % moves, the ones truly catching 5-10R+ on their entries, have to both understand how strong stocks accumulate on the initial frontside of the move… and how riggers control the weakness on the way down to both trap shorts and shake out chasing longs. And just like “topping action” on weak plays, there is “bottoming action” on strong plays.
You also need to be in-tune with the market conditions to catch big longs, as many range expansion moves, the ones that go 50%+ past HoD, only happen in high liquidity/strong conditions.
Due to the proactiveness of reading accumulation structures and timing longs at the bottom… versus the reactiveness of shorting extended stocks near their highs… you will almost never find a trader who likes to both long and short in this market.
Shorts will often find it too confusing to do both. They are used to simply reacting to something which has already happened. And when a stock there are short is fading, they simply find it easier to turn their brain off. No need to see HOW the stock is fading and WHAT type of structure/price action the stock would need to do to reclaim highs. The assumption is, “The ticker is crap, why would I need to look at it?” And since their wide risk style often requires them to make BIG money on their shorts to make up for their losses, this reinforces this thinking even more.
Long traders, however, are much more open to the idea of shorting, but just barely. Because, after all, how would you know where to sell your long without having some idea of topping structure in low float stocks? The momentum can only last forever, and gravity is constantly pulling these stocks down. After seeing the same long trap push 500 times, some long traders eventually think, “Why don’t I try shorting some of these?”
However, only a few long traders are like this in my experience. Most are psychologically opposed to shorting. They like to enter in and see their tickers go up. They like to see big explosive green candles to the upside. There is a certain thrill being on the right side of a very strong ticker in low floats, and shorting largely goes against that. Not to mention the expensive borrow/locate fees and massive risk potential.
However, I think it’s helpful for short-only or long-only traders to study the opposite side of the move, even if you choose to never trade it. One thing I always teach in my Patreon/Discord is to understand what the opposite thesis is on every trade you take.
If you’re short, what is the potential accumulation structure on the way up? How is the stock being controlled on the way down and what levels/time frames/moving averages should you be paying attention to? What are the common algo tricks that could give you an idea of intention to take the ticker higher, perhaps past your risk?
And if you’re a long trader, how should you view aggressive premarket/intraday pops and the “looseness” of the move? What are common long trap tricks on different time frames that get repeated again and again? How does things like price point / float / volume factor into the price action and potential accumulation structures? All of these things matter to various degrees.
Anyway I think that’s enough for today. One final note is I don’t see this market as “longs vs shorts.” I see it as the rigger/MM’s constant quest for creating and attacking liquidity. It’s not just about squeezing shorts, it’s also about shaking out longs. And when fading, it’s not just about knifing long stop losses, but also about baiting shorts to cover early. I think they are mostly ambivalent to your position, they are simply figuring out what is the easiest way to make the most money.
Hey Fintwit, sorry for missing yesterday. Today’s topic will be about Chinese small cap / low float stocks. My favorite topic!
Lots to talk about, and I can’t cover it all in one tweet. But the Chinese truly are my favorite people. And their low float stocks move in very unique, interesting ways.
That being said, even Chinese stocks follow the laws of liquidity. They can’t just do whatever they want, and their actions have consequences. We’ll talk more about this later.
Chinese low float stocks are interesting, because they have their own style of “rigging” tickers that is separate from non-Asian tickers. (Btw, you probably noticed that many Asian stocks from countries like Japan/Korea/Malaysia etc. move very similarly to Chinese/Hong Kong tickers, there’s a reason for that! I’m sure you can figure it out!)
Anyway, there are a few things we need to establish:
First, Chinese/Asian tickers have VERY empty order books, and their float/os numbers cannot be trusted. It’s usually best to treat them as their own subsect of the low float market, with specific price action unique to them.
The reason Chinese/Asian tickers have empty order books is because nobody touches these things with a 10 foot (meter?) pole. They usually IPO for around $4 for about 2M shares through very shady underwriters. They have no analysts covering them and almost zero real market participation. This creates a truly blank canvas for a low float rig.
Next is their style of rigging. The joke in my Discord/Patreon room is “the Chinese only press one button at a time.” They are either almost exclusively pressing their buy button… or exclusively pressing their sell button.
Their short traps often work like this. They “buy buy buy buy buy buy buy” up 100% or w/e… stall a bit to bait some shorts… build a few higher lows… knife 10-20%… then back to “buy buy buy buy buy” straight up. Every “weak” lower high bounce you think will stall is potentially pure strength and accumulation.
And since the order books are so empty to the upside, Chinese stocks can squeeze WELL past HoD, especially on initial frontside of the move.
There is a wide variety of things that could happen when a Chinese/Asian ticker pops. Are we going to get a 30% premarket pop into a 80% down only fade? Or are we gonna get INHD intraday running 4000%? With the Chinese you never know. The order book is both empty to the upside and downside.
So the main goal with Chinese tickers is to both understand the unique technicals of how they control stocks… and to devise the intention of the ticker. If you pick the right bias (bearish or bullish) at the right moment, you can truly make insane amounts of money. As the Chinese will often keep pushing the stock in their chosen direction (buy buy buy buy buy or sell sell sell sell sell).
But like I said before, their nonstop buy buy buying has consequences. Their nonstop buying builds an insane amount of higher lows, which all become liquidity targets for a fade. Also, the order book is VERY empty to the downside, even as the stock keeps pushing hundreds of % higher, baiting shorts repeatedly with “weak” price action at the top.
This is one of the major reasons why Chinese stocks fade harder than perhaps any other ticker. Once the overtly aggressive short squeeze is over, they will often fade the stock STRAIGHT DOWN. Little-to-no bounce, little-to-no backside trapping. I’m not saying it doesn’t happen, but often when they sell, they sell HARD.
The Chinese also love half/whole dollar manipulation, both at support and resistance. If they are heavily painting a half/whole dollar level, you can almost be sure they will go for it.
These Chinese also love to leave HUGE wicks on the 1m chart at HoD. Sometimes this is apart of the rig to go higher, sometimes it is legit topping action before a massive fade lower. But the Chinese swipe and they swipe fast. When the intention is higher, this causes shorts to often chase well below HoD, often 10% or more. And since everyone uses HoD as an anchor for risk/decision making, especially if the intention is higher, they will get shorts into REALLY bad averages, then squeeze everybody risking the same level up higher.
The Chinese also love moving averages. The 5m and 15m moving averages are very common, both for legitimate price action to go higher, and for trapping.
Tbh, I think it’s great the Chinese are here in this market. It takes a bit of skill and getting used to trading them, but the profit potential both long and short is massive. Most of my biggest long winners have come from choosing a bullish bias on a Chinese ticker, even if it’s up multiple 100%s. In many contexts, the gapping % can often be bait in low float tickers, and that is especially true for Chinese/Asian tickers.
Ok I think that’s enough for today. Some of the more interesting cool Chinese/Asian rigs have been INHD/MTC/BMGL/SOGP/MLGO/HOLO, amongst many others. I suggest studying them individually and noticing what things stick out.
Hey Fintwit, sorry for missing yesterday. Today’s topic will be about Chinese small cap / low float stocks. My favorite topic!
Lots to talk about, and I can’t cover it all in one tweet. But the Chinese truly are my favorite people. And their low float stocks move in very unique, interesting ways.
That being said, even Chinese stocks follow the laws of liquidity. They can’t just do whatever they want, and their actions have consequences. We’ll talk more about this later.
Chinese low float stocks are interesting, because they have their own style of “rigging” tickers that is separate from non-Asian tickers. (Btw, you probably noticed that many Asian stocks from countries like Japan/Korea/Malaysia etc. move very similarly to Chinese/Hong Kong tickers, there’s a reason for that! I’m sure you can figure it out!)
Anyway, there are a few things we need to establish:
First, Chinese/Asian tickers have VERY empty order books, and their float/os numbers cannot be trusted. It’s usually best to treat them as their own subsect of the low float market, with specific price action unique to them.
The reason Chinese/Asian tickers have empty order books is because nobody touches these things with a 10 foot (meter?) pole. They usually IPO for around $4 for about 2M shares through very shady underwriters. They have no analysts covering them and almost zero real market participation. This creates a truly blank canvas for a low float rig.
Next is their style of rigging. The joke in my Discord/Patreon room is “the Chinese only press one button at a time.” They are either almost exclusively pressing their buy button… or exclusively pressing their sell button.
Their short traps often work like this. They “buy buy buy buy buy buy buy” up 100% or w/e… stall a bit to bait some shorts… build a few higher lows… knife 10-20%… then back to “buy buy buy buy buy” straight up. Every “weak” lower high bounce you think will stall is potentially pure strength and accumulation.
And since the order books are so empty to the upside, Chinese stocks can squeeze WELL past HoD, especially on initial frontside of the move.
There is a wide variety of things that could happen when a Chinese/Asian ticker pops. Are we going to get a 30% premarket pop into a 80% down only fade? Or are we gonna get INHD intraday running 4000%? With the Chinese you never know. The order book is both empty to the upside and downside.
So the main goal with Chinese tickers is to both understand the unique technicals of how they control stocks… and to devise the intention of the ticker. If you pick the right bias (bearish or bullish) at the right moment, you can truly make insane amounts of money. As the Chinese will often keep pushing the stock in their chosen direction (buy buy buy buy buy or sell sell sell sell sell).
But like I said before, their nonstop buy buy buying has consequences. Their nonstop buying builds an insane amount of higher lows, which all become liquidity targets for a fade. Also, the order book is VERY empty to the downside, even as the stock keeps pushing hundreds of % higher, baiting shorts repeatedly with “weak” price action at the top.
This is one of the major reasons why Chinese stocks fade harder than perhaps any other ticker. Once the overtly aggressive short squeeze is over, they will often fade the stock STRAIGHT DOWN. Little-to-no bounce, little-to-no backside trapping. I’m not saying it doesn’t happen, but often when they sell, they sell HARD.
The Chinese also love half/whole dollar manipulation, both at support and resistance. If they are heavily painting a half/whole dollar level, you can almost be sure they will go for it.
These Chinese also love to leave HUGE wicks on the 1m chart at HoD. Sometimes this is apart of the rig to go higher, sometimes it is legit topping action before a massive fade lower. But the Chinese swipe and they swipe fast. When the intention is higher, this causes shorts to often chase well below HoD, often 10% or more. And since everyone uses HoD as an anchor for risk/decision making, especially if the intention is higher, they will get shorts into REALLY bad averages, then squeeze everybody risking the same level up higher.
The Chinese also love moving averages. The 5m and 15m moving averages are very common, both for legitimate price action to go higher, and for trapping.
Tbh, I think it’s great the Chinese are here in this market. It takes a bit of skill and getting used to trading them, but the profit potential both long and short is massive. Most of my biggest long winners have come from choosing a bullish bias on a Chinese ticker, even if it’s up multiple 100%s. In many contexts, the gapping % can often be bait in low float tickers, and that is especially true for Chinese/Asian tickers.
Ok I think that’s enough for today. Some of the more interesting cool Chinese/Asian rigs have been INHD/MTC/BMGL/SOGP/MLGO/HOLO, amongst many others. I suggest studying them individually and noticing what things stick out.
Today, I want to talk about a concept I call the initial frontside of the move.
So we established that in low floats/small caps, order books are inherently empty. And when big volume comes into a play, there is quite a lot of uncertainty. How high is the stock going to go? What’s the long entry? What’s the short entry? In the beginning, it is often unclear.
Most short sellers try to create rules of thumb early on in the move to keep them safe. “Don’t short stocks under x%.” “Wait for initial highs to get broken.” “Wait for some type of common topping pattern/higher low break before sizing in.” etc.
Not bad, those rules can certainly save you a lot early losses.
And keep in mind there stocks that make one quick pop, maybe push a new high, then immediately die. There is a lot of variation in this market.
But something to be generally aware of is what I call the initial frontside of the move. This is when a stock initially pops and starts making new highs with consistent and increasing volume, especially on shorter time frames (1m, 3m, 5m, etc.)
This is, by far the most dangerous time to short. Or I should say, it carries the greatest amount of risk. Especially in stronger conditions when the low float market is consistently producing large % moves on a daily basis. But it’s something to be aware of in all markets.
One of the better examples of this concept that happened in a recent strong market is STI from June 4, 2026.
Now there are a few details besides “strong market” that we need to know. The most important of which is the price point and the float. STI falls under what I call “high priced, tiny float” stock. This is usually reserved for plays over $6-ish with quite small floats (<5M-ish)
High priced tiny float stocks have very specific order books which produce a unique type of price action compared to low float stocks of smaller price ranges. I do not have time to go into all the details, and if you really care I cover this extensively in my discord room/patreon, but here are the most important points:
High price tiny float stocks tend to “float” near their highs, like a balloon that’s lost a bit of helium, before potentially squeezing back up higher.
They tend to hold higher lows (often called “bid props”) before pushing new highs.
They also tend to aggressively knife from HoD clearouts and/or long traps near the highs, and have a habit of reclaiming the knife shortly after.
Another important fact about high priced tiny float is they tend to trade on much shorter, more volatile time frames, most notably the 1m and 3m chart, sometimes 5m.
I said in my last post that often in low float stocks, a stock can produce a “bearish” pattern on the 1m chart, only to simultaneously produce a “bullish” pattern on a longer time frame. Notably the 3m/5m for high priced tiny float stocks.
This is especially true on the initial frontside of the move, as a stock is pushing on consistent/increasing volume while making new highs, before any significant pullback.
For STI, we will look at the premarket action early on, before it pushed into $20+.
The FIRST image is fairly easy to understand. We have a high priced, tiny float stock pushing with increasing vol straight up the 1m9ema/1m20ema.
This is the initial frontside of the move. At this point, we have zero idea what the intention is of the stock. Most traders try to derive intention based on the gapping %. They say, “once a stock gets over x%, the intention is to fade the stock back down.” After all, the data shows that stocks that gap up over x% tend to fade (what x% actually is doesn’t matter here, btw. Could literally be any number.)
But short edge is not derived from “shorting things over x%” – it’s derived from understanding how liquidity works, and, more specifically here, how accumulation works.
The increasing volume up the 1m9ema/1m20ema is dangerous, because this is commonly how high priced tiny float stocks accumulate. Because, as I mentioned in my last post, in order for a stock to push up 1000%, you must accumulate at a lower % first.
One thing that more astute traders might have noticed is for stocks that push, say, 500-1000% intraday, they don’t set that many prolonged pullback/consolidation structures.
What I mean is, the way a 1000% intraday runner often pushes is not from pushing 100%, having prolonged period of consolidation (say 45-90+ minutes), then push up to 200%, then another 45-90+ mins of consolidation, then push up to 300%... over and over again until you reach 1000%.
No, the way you do it is you push STRAIGHT UP 200-400% first, trap in ONE prolonged structure, then IMMEDIATELY push to 800-1000%.
The idea behind how this works is very simple:
1. The “rigger” (or MM or w/e we want to call it) accumulates on initial frontside of the move, pushing it to a very high % gap.
2. People start to short the “insane” move. After all, the data shows that stocks over 300% have an X% chance to fade and blah blah blah.
3. The stock stays in the top of the range, often pulling back into the 9ema/20ema on the 3m/5m time frame (this is the time frame the stock is ACTUALLY moving on, although initially we don’t know that yet.)
4. The “rigger” often baits common short patterns on the 1m chart. Hod clearouts get rejected HARD, or higher low pushes right below highs experience HARD knives back to support. Meanwhile, deeper higher lows at support are building, convincing people that a HUGE crack is about to come.
5. After enough trapping and consolidation, the rigger holds the higher lows, and initiates the stock higher, causing a massive squeeze on a tiny float stock through an extremely empty order book.
The SECOND picture below shows how the chart looks like on the 3m chart.
So, as we see here, the initial frontside of the move is not just denoted by the 1m9/1m20emas. The initial frontside of the move can also be done on LONGER time frame MAs. Including the 3m/5m/15m charts. With the 9ema/20emas being the most commonly used.
So, on STI, what they are doing is accumulating on the 3m chart, pushing it straight up the 9ema. The 3m chart is very commonly used on high priced tiny float. Then, after pushing it high enough, they start giving common topping/short patterns on the 1 min, repeatedly rejecting any attempt at making new highs (see THIRD chart). They pull it back to the 3m20ema, and start grinding it higher. After a few more short bait pushes that fail to break highs, they hold the higher lows and initiate the short squeeze through a VERY empty order book.
Btw, in case you forgot what happened, STI not only did STI push to $38 at market open, it also pushed to $57 on day 2 of this move.
One final point I want to make here is low float stocks are moving on multiple time frames, all at once. There are people hyperscalping 15 second moves, there people trading on the 1m, on the 3m, on the 5m, etc. And they all exist simultaneously together. That’s why in my last post I said there is a delicate dance which must be done in low float stocks. Everyone is trying to get their piece, and they are all reading the same price action differently. It pays to study the most common time frames to see how they all line up with each other, and things will start making more sense.
Today, I want to talk about a concept I call the initial frontside of the move.
So we established that in low floats/small caps, order books are inherently empty. And when big volume comes into a play, there is quite a lot of uncertainty. How high is the stock going to go? What’s the long entry? What’s the short entry? In the beginning, it is often unclear.
Most short sellers try to create rules of thumb early on in the move to keep them safe. “Don’t short stocks under x%.” “Wait for initial highs to get broken.” “Wait for some type of common topping pattern/higher low break before sizing in.” etc.
Not bad, those rules can certainly save you a lot early losses.
And keep in mind there stocks that make one quick pop, maybe push a new high, then immediately die. There is a lot of variation in this market.
But something to be generally aware of is what I call the initial frontside of the move. This is when a stock initially pops and starts making new highs with consistent and increasing volume, especially on shorter time frames (1m, 3m, 5m, etc.)
This is, by far the most dangerous time to short. Or I should say, it carries the greatest amount of risk. Especially in stronger conditions when the low float market is consistently producing large % moves on a daily basis. But it’s something to be aware of in all markets.
One of the better examples of this concept that happened in a recent strong market is STI from June 4, 2026.
Now there are a few details besides “strong market” that we need to know. The most important of which is the price point and the float. STI falls under what I call “high priced, tiny float” stock. This is usually reserved for plays over $6-ish with quite small floats (<5M-ish)
High priced tiny float stocks have very specific order books which produce a unique type of price action compared to low float stocks of smaller price ranges. I do not have time to go into all the details, and if you really care I cover this extensively in my discord room/patreon, but here are the most important points:
High price tiny float stocks tend to “float” near their highs, like a balloon that’s lost a bit of helium, before potentially squeezing back up higher.
They tend to hold higher lows (often called “bid props”) before pushing new highs.
They also tend to aggressively knife from HoD clearouts and/or long traps near the highs, and have a habit of reclaiming the knife shortly after.
Another important fact about high priced tiny float is they tend to trade on much shorter, more volatile time frames, most notably the 1m and 3m chart, sometimes 5m.
I said in my last post that often in low float stocks, a stock can produce a “bearish” pattern on the 1m chart, only to simultaneously produce a “bullish” pattern on a longer time frame. Notably the 3m/5m for high priced tiny float stocks.
This is especially true on the initial frontside of the move, as a stock is pushing on consistent/increasing volume while making new highs, before any significant pullback.
For STI, we will look at the premarket action early on, before it pushed into $20+.
The FIRST image is fairly easy to understand. We have a high priced, tiny float stock pushing with increasing vol straight up the 1m9ema/1m20ema.
This is the initial frontside of the move. At this point, we have zero idea what the intention is of the stock. Most traders try to derive intention based on the gapping %. They say, “once a stock gets over x%, the intention is to fade the stock back down.” After all, the data shows that stocks that gap up over x% tend to fade (what x% actually is doesn’t matter here, btw. Could literally be any number.)
But short edge is not derived from “shorting things over x%” – it’s derived from understanding how liquidity works, and, more specifically here, how accumulation works.
The increasing volume up the 1m9ema/1m20ema is dangerous, because this is commonly how high priced tiny float stocks accumulate. Because, as I mentioned in my last post, in order for a stock to push up 1000%, you must accumulate at a lower % first.
One thing that more astute traders might have noticed is for stocks that push, say, 500-1000% intraday, they don’t set that many prolonged pullback/consolidation structures.
What I mean is, the way a 1000% intraday runner often pushes is not from pushing 100%, having prolonged period of consolidation (say 45-90+ minutes), then push up to 200%, then another 45-90+ mins of consolidation, then push up to 300%... over and over again until you reach 1000%.
No, the way you do it is you push STRAIGHT UP 200-400% first, trap in ONE prolonged structure, then IMMEDIATELY push to 800-1000%.
The idea behind how this works is very simple:
1. The “rigger” (or MM or w/e we want to call it) accumulates on initial frontside of the move, pushing it to a very high % gap.
2. People start to short the “insane” move. After all, the data shows that stocks over 300% have an X% chance to fade and blah blah blah.
3. The stock stays in the top of the range, often pulling back into the 9ema/20ema on the 3m/5m time frame (this is the time frame the stock is ACTUALLY moving on, although initially we don’t know that yet.)
4. The “rigger” often baits common short patterns on the 1m chart. Hod clearouts get rejected HARD, or higher low pushes right below highs experience HARD knives back to support. Meanwhile, deeper higher lows at support are building, convincing people that a HUGE crack is about to come.
5. After enough trapping and consolidation, the rigger holds the higher lows, and initiates the stock higher, causing a massive squeeze on a tiny float stock through an extremely empty order book.
The SECOND picture below shows how the chart looks like on the 3m chart.
So, as we see here, the initial frontside of the move is not just denoted by the 1m9/1m20emas. The initial frontside of the move can also be done on LONGER time frame MAs. Including the 3m/5m/15m charts. With the 9ema/20emas being the most commonly used.
So, on STI, what they are doing is accumulating on the 3m chart, pushing it straight up the 9ema. The 3m chart is very commonly used on high priced tiny float. Then, after pushing it high enough, they start giving common topping/short patterns on the 1 min, repeatedly rejecting any attempt at making new highs (see THIRD chart). They pull it back to the 3m20ema, and start grinding it higher. After a few more short bait pushes that fail to break highs, they hold the higher lows and initiate the short squeeze through a VERY empty order book.
Btw, in case you forgot what happened, STI not only did STI push to $38 at market open, it also pushed to $57 on day 2 of this move.
One final point I want to make here is low float stocks are moving on multiple time frames, all at once. There are people hyperscalping 15 second moves, there people trading on the 1m, on the 3m, on the 5m, etc. And they all exist simultaneously together. That’s why in my last post I said there is a delicate dance which must be done in low float stocks. Everyone is trying to get their piece, and they are all reading the same price action differently. It pays to study the most common time frames to see how they all line up with each other, and things will start making more sense.
Today’s topic is about edge erosion. A topic I almost never think about, but according to my discord room it’s a popular topic on fintwit, so might as well talk about it.
I believe, fundamentally, edge erosion does not exist, at least not in the way people think it does.
The basic argument people make is this: In small caps, people discover some type of technical pattern or some type of data-driven “edge” in a spreadsheet, and use it to their advantage. Once the data driven pattern gets repeated too often, or the information becomes too “well-known” across social media, the edge “disappears” or gets eroded.
As if there is a secret cabal of market makers keeping tabs on all social media to find out which information is becoming too disseminated or well-known.
Now one thing that absolutely exists in small caps is how market makers abuse recency bias in day traders, especially after a major outlier/extreme event. I will talk about this some other time. But this is not the same as edge erosion.
The reason edge erosion doesn’t exist in small caps is because edge is not derived from trading some repeatable technical pattern or “following the data” (data, which in 99.9% of situations, is oversimplified and over-generalized, to the point of being near useless. For example, did you know premarket gappers often fade? Wow!).
Btw, true fact, the more commonly held a belief exists on small cap twitter, the less edge it produces. You could even say commonly held beliefs on here produce negative edge. Since, after all, 99% of people in this space never make money.
True edge comes from understanding how liquidity in small caps works. And that is the only constant changing force, liquidity. As liquidity changes (this includes both the liquidity in the small cap market itself (the “conditions”), and liquidity in the individual stock you are trading) – the patterns change. Or I should say, the potential for certain liquidity moves to happen changes.
Because, after all, low float small cap stocks are near empty liquidity vehicles. When they are not “rigged”, they trade insanely low daily volume with near random swings in price. They have little-to-no participation and their order books are empty - until the big volume comes in.
But the stock market is, fundamentally, very simple. First, there is the order book, which represents all of the bids and asks for a particular stock’s current market. And then there is the tape, the actual orders being executed. In order for the stock price to go up, you must buy through the asks; and for it to go down, you must sell through the bids.
In small caps, what ultimately determines what pattern gets executed is the amount of liquidity present in that stock at that time, combined with what orders exists on the order book. And your job as a small cap trader is to analyze, in real-time, the liquidity situation of the current stock and determine what bearish and/or bullish liquidity patterns are possible at that moment in time.
And here’s the thing, market makers cannot just do whatever they want. They are bound by the laws of liquidity, which work, in many ways, very similar to the laws of physics.
For example, if last year, it rained a lot in your home town, then the next year it didn’t, does that mean the laws of physics changed? Of course not. The change is dependent on the various factors which influences how much rain you get in your area. There is no secret market maker weather man who is pulling the puppet strings, changing the weather when things get too “normal” or “common.”
Small caps are the same way. Different types of stocks have different types of order books, and therefore price action. Penny stocks move in certain ways, $2-5 move in certain ways, $5-10+ move in certain ways, etc. Their order books limit what MMs can potentially do.
Btw, Chinese small cap order books are notoriously empty. And in periods of high liquidity, they will abuse this fact to gap up a stock a huge %, often on relatively little buying power, get shorts interested in it, then squeeze higher through and even emptier order book as the price increases.
Recent stocks like TDIC and INHD do not break the laws of liquidity. They are abusing how much liquidity is in the system + that specific stock, and taking advantage of an empty order book to break people’s expectations (the same expectations your data graciously points you towards) to squeeze higher.
However, there is good news. In order to push a stock up, say 500%, or 1000%, or whatever big number you can think of, you must accumulate first. And thanks to the laws of liquidity, there are only so many ways you can accumulate a stock. Because in order to push a stock up 1000%, you must accumulate a smaller % of that first. And even though there is a lot of variance in how this is done, it is not random.
Which means by studying accumulation patterns, there are times where you can be very bullish a stock up multiple hundreds of %. And times where you will be very bearish. It’s not what the gapping % is, it’s HOW it gets there.
To truly understand liquidity, you must analyze HOW stocks move. And unless you are some Ph.D level math genius, I recommend NOT starting with data. There is too much risk where, regardless of how many data points you have, that you are generating an incomplete picture which will, at best, give you a tiny sliver of how liquidity actually works.
No, you must study charts. Especially across multiple time frames. The most common in small caps are the 1m, 3m, 5m, and 15m. Sometimes 30m/60m are useful on longer MDRs. And you must understand how various patterns across the different times frames work in tandem with each other. There are many times when stocks produce a “bearish” pattern on the 1m chart, only to simultaneously produce a “bullish” pattern on the 3m or 5m.
There is an ebb and flow to liquidity. A delicate dance which the market maker must maintain. Your job is to analyze the situation and figure out what is possible based on what you know about that ticker at that point in time. A combination of technical factors such as common “algo tricks” on different time frames, along with other various important factors to know (float, price point, any catalysts/theme, overall “conditions” of the market that day).
Btw I will talk about market conditions sometime later. It’s a quite complex topic that deserves to be talked about piece by piece.
Anyway, I think I rambled long enough. I truly believe edge in small caps comes from understanding how liquidity works. When I look at charts from when I started in 2019, and then every year until today, I see the exact same shit. The only thing that really changes is the amount of liquidity present in that stock at that moment in time. Everything else is the same. MMs are bound by what they can do, I would suggest studying it.
Today’s topic is about edge erosion. A topic I almost never think about, but according to my discord room it’s a popular topic on fintwit, so might as well talk about it.
I believe, fundamentally, edge erosion does not exist, at least not in the way people think it does.
The basic argument people make is this: In small caps, people discover some type of technical pattern or some type of data-driven “edge” in a spreadsheet, and use it to their advantage. Once the data driven pattern gets repeated too often, or the information becomes too “well-known” across social media, the edge “disappears” or gets eroded.
As if there is a secret cabal of market makers keeping tabs on all social media to find out which information is becoming too disseminated or well-known.
Now one thing that absolutely exists in small caps is how market makers abuse recency bias in day traders, especially after a major outlier/extreme event. I will talk about this some other time. But this is not the same as edge erosion.
The reason edge erosion doesn’t exist in small caps is because edge is not derived from trading some repeatable technical pattern or “following the data” (data, which in 99.9% of situations, is oversimplified and over-generalized, to the point of being near useless. For example, did you know premarket gappers often fade? Wow!).
Btw, true fact, the more commonly held a belief exists on small cap twitter, the less edge it produces. You could even say commonly held beliefs on here produce negative edge. Since, after all, 99% of people in this space never make money.
True edge comes from understanding how liquidity in small caps works. And that is the only constant changing force, liquidity. As liquidity changes (this includes both the liquidity in the small cap market itself (the “conditions”), and liquidity in the individual stock you are trading) – the patterns change. Or I should say, the potential for certain liquidity moves to happen changes.
Because, after all, low float small cap stocks are near empty liquidity vehicles. When they are not “rigged”, they trade insanely low daily volume with near random swings in price. They have little-to-no participation and their order books are empty - until the big volume comes in.
But the stock market is, fundamentally, very simple. First, there is the order book, which represents all of the bids and asks for a particular stock’s current market. And then there is the tape, the actual orders being executed. In order for the stock price to go up, you must buy through the asks; and for it to go down, you must sell through the bids.
In small caps, what ultimately determines what pattern gets executed is the amount of liquidity present in that stock at that time, combined with what orders exists on the order book. And your job as a small cap trader is to analyze, in real-time, the liquidity situation of the current stock and determine what bearish and/or bullish liquidity patterns are possible at that moment in time.
And here’s the thing, market makers cannot just do whatever they want. They are bound by the laws of liquidity, which work, in many ways, very similar to the laws of physics.
For example, if last year, it rained a lot in your home town, then the next year it didn’t, does that mean the laws of physics changed? Of course not. The change is dependent on the various factors which influences how much rain you get in your area. There is no secret market maker weather man who is pulling the puppet strings, changing the weather when things get too “normal” or “common.”
Small caps are the same way. Different types of stocks have different types of order books, and therefore price action. Penny stocks move in certain ways, $2-5 move in certain ways, $5-10+ move in certain ways, etc. Their order books limit what MMs can potentially do.
Btw, Chinese small cap order books are notoriously empty. And in periods of high liquidity, they will abuse this fact to gap up a stock a huge %, often on relatively little buying power, get shorts interested in it, then squeeze higher through and even emptier order book as the price increases.
Recent stocks like TDIC and INHD do not break the laws of liquidity. They are abusing how much liquidity is in the system + that specific stock, and taking advantage of an empty order book to break people’s expectations (the same expectations your data graciously points you towards) to squeeze higher.
However, there is good news. In order to push a stock up, say 500%, or 1000%, or whatever big number you can think of, you must accumulate first. And thanks to the laws of liquidity, there are only so many ways you can accumulate a stock. Because in order to push a stock up 1000%, you must accumulate a smaller % of that first. And even though there is a lot of variance in how this is done, it is not random.
Which means by studying accumulation patterns, there are times where you can be very bullish a stock up multiple hundreds of %. And times where you will be very bearish. It’s not what the gapping % is, it’s HOW it gets there.
To truly understand liquidity, you must analyze HOW stocks move. And unless you are some Ph.D level math genius, I recommend NOT starting with data. There is too much risk where, regardless of how many data points you have, that you are generating an incomplete picture which will, at best, give you a tiny sliver of how liquidity actually works.
No, you must study charts. Especially across multiple time frames. The most common in small caps are the 1m, 3m, 5m, and 15m. Sometimes 30m/60m are useful on longer MDRs. And you must understand how various patterns across the different times frames work in tandem with each other. There are many times when stocks produce a “bearish” pattern on the 1m chart, only to simultaneously produce a “bullish” pattern on the 3m or 5m.
There is an ebb and flow to liquidity. A delicate dance which the market maker must maintain. Your job is to analyze the situation and figure out what is possible based on what you know about that ticker at that point in time. A combination of technical factors such as common “algo tricks” on different time frames, along with other various important factors to know (float, price point, any catalysts/theme, overall “conditions” of the market that day).
Btw I will talk about market conditions sometime later. It’s a quite complex topic that deserves to be talked about piece by piece.
Anyway, I think I rambled long enough. I truly believe edge in small caps comes from understanding how liquidity works. When I look at charts from when I started in 2019, and then every year until today, I see the exact same shit. The only thing that really changes is the amount of liquidity present in that stock at that moment in time. Everything else is the same. MMs are bound by what they can do, I would suggest studying it.
The stocks that intend to fade the hardest push the highest. Someone has to be willing to put the BP behind the constant higher lows and expect to make their money back later.
@kelanfar@ouraring Getting old is realizing going to bed early and lifting first thing in the morning is the play. Especially if you ever have kids. Only way I ever found consistency month after month. And consistency > optimization always. Excited to hear about your progress.
I love strong stocks because they spend 95% of their time looking weak/baiting common bearish patterns then 5% of their time ripping higher and it's just the best.