Thanks to feedback from @JeffClark, here's rivers and subbasins of the Great Lakes, take two. I'd mistakenly excluded Canadian lakes in my earlier render. Also took the opportunity to add more rivers.
#rayshader adventures, an #rstats tale
@researchremora Beautiful! I noticed it doesn't have smaller lakes like Lake Simcoe between Lakes Ontario and Huron. Does Hydrosheds have the data and you are just simplifying to focus on the streams and rivers?
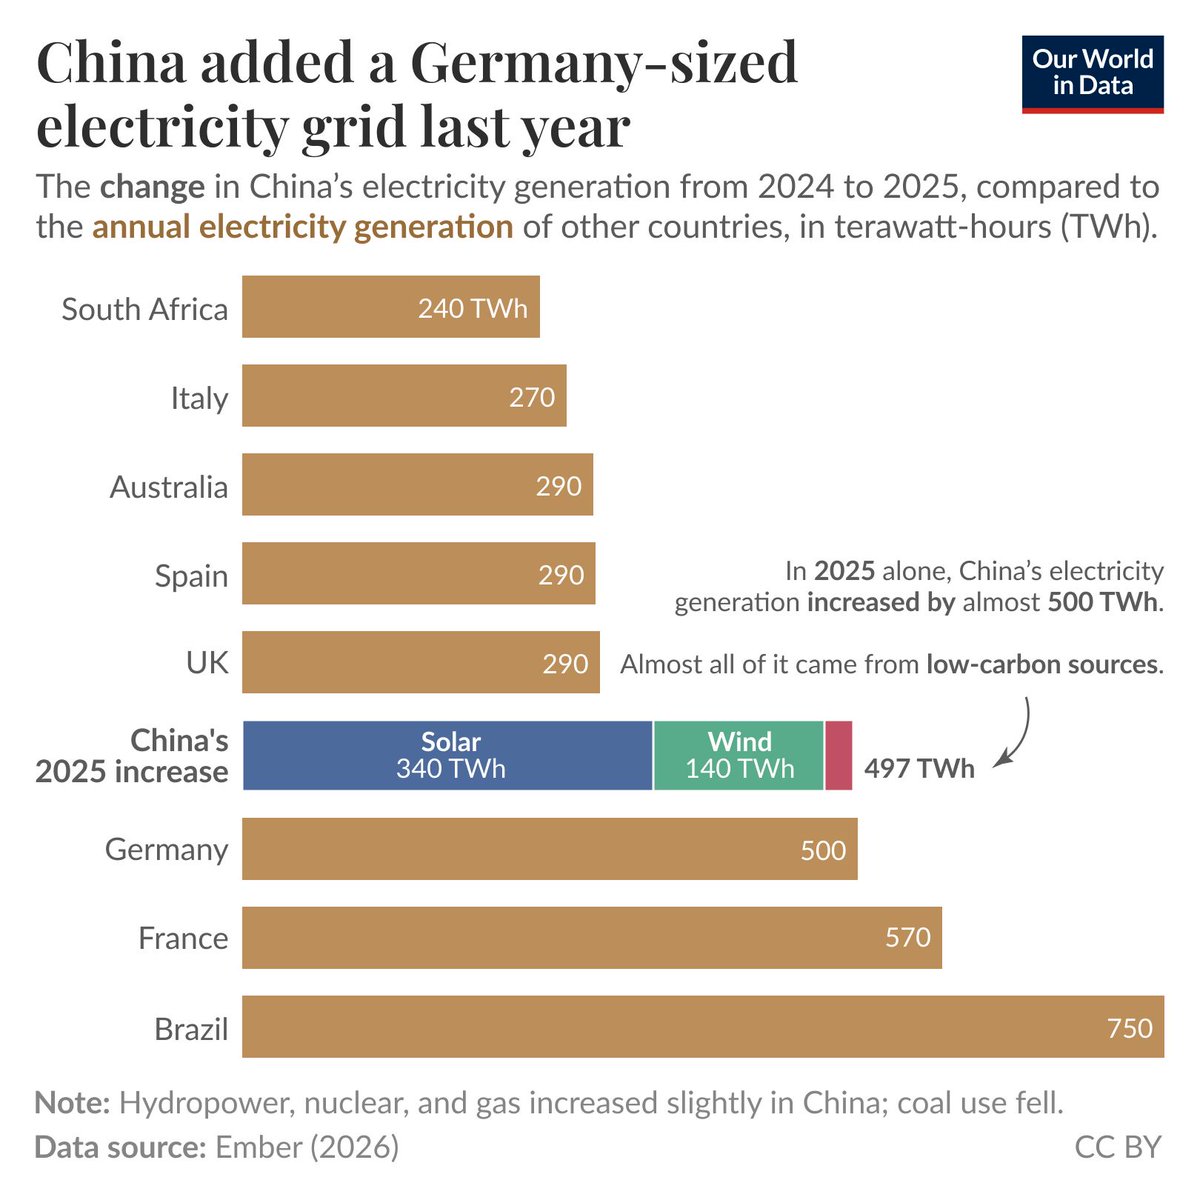
China added a Germany-sized electricity grid last year—
(This Data Insight was written by @_HannahRitchie and Pablo Rosado.)
We’ll often see headlines quoting how many gigawatts of new solar farms or coal plants China is building. But it’s hard to get a meaningful sense of scale for how electricity generation in China is changing.
The chart puts it in perspective.
In 2025 alone, China’s electricity generation increased by almost 500 terawatt-hours (TWh). This is compared here to the total amount of electricity that whole countries generate each year.
Germany generates almost exactly that amount. That means China effectively added a Germany-sized grid to its electricity system in just one year.
What’s also quite staggering is that almost all of this new generation came from solar and wind. China generated 340 TWh more electricity from solar than the year before.
That’s more than our two home countries, the UK and Spain, generate from all sources each year.
Low-carbon sources grew so much that coal power in China actually fell slightly.
@Open_TO I did a simple project about coffee shop density in the city back in 2017. It's out of date but might be interesting. I used data from OSM
https://t.co/SOO5au1S43