What keeps me awake at night?
This.
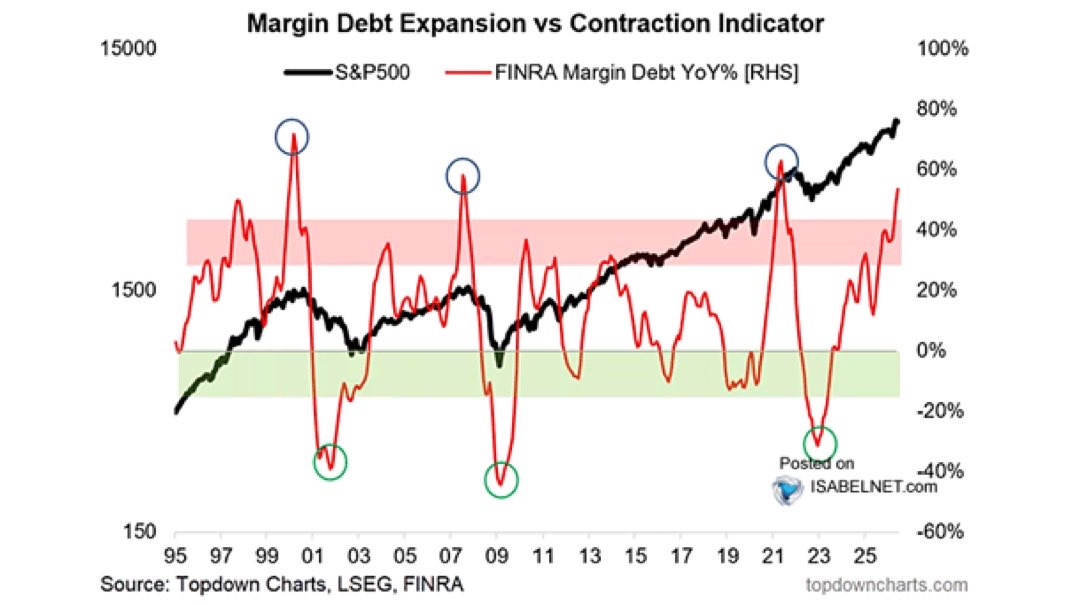
One of the oldest froth gauges on Wall Street: the year-over-year change in margin debt. How fast investors are borrowing money to buy stocks.
May 2026 reading: 53.7%. A new record high in absolute terms, $1.42 trillion borrowed against portfolios.
Look at the chart. Every blue circle is a major top. 2000. 2007. 2021. The pattern is always the same. The line climbs into the danger zone, rolls over, and the rollover is the signal. Not the peak itself. The turn down from it.
That's the part most people get wrong. They wait for a number. A line in the sand at 55%, or 60%, or wherever. But the market doesn't ring a bell at a level. The tell is direction.
While margin debt is rising, leverage is being added. Genius on the way up. It amplifies every gain and makes the bulls look like prophets.
When it turns down, the machine runs in reverse. Borrowed money gets called back. A normal 10% dip triggers margin calls. Forced selling begets forced selling. The leverage that built the top accelerates the fall.
So here's what I'm watching now. Not whether we hit a magic number. Whether this line stops climbing and starts to fall.
The peak in margin debt growth has marked the edge of every major top for two generations. We're sitting at the second-highest reading in years, still rising.
The day it rolls over is the day to pay attention.
Up is the party. Down is the bill.
🚨 WARNING: NEXT WEEK WILL BE THE WORST TIME OF 2026!!
When markets open on Monday, this won't be “just a dip.”
Stocks will dump.
Metals will dump.
Bitcoin will collapse.
If you hold any assets right now, you MUST be prepared for the biggest sell-off event of the year:
Insiders are nonstop dumping ALL assets right now.
They are not buying the dip.
They are moving into cash, reducing exposure, and preparing for a market crash.
And the warning signs are already appearing.
Bitcoin has already dumped below $60,000.
Stocks are falling.
Gold is falling.
Silver is falling.
This is not isolated weakness.
This is capital exiting risk across the board.
Capital freezes.
Confidence evaporates.
Global growth expectations reset lower instantly.
Meanwhile:
→ Japanese bond yields are surging
→ Foreign nations are dumping U.S. Treasuries
→ Global bonds are falling
→ Oil markets are becoming unstable
→ The dollar is losing stability
→ Liquidity is tightening worldwide
This is no longer one isolated problem.
This is systemic pressure building across MULTIPLE fronts simultaneously.
Inflation spikes globally.
Which means central banks will keep interest rates higher for longer.
And that creates the exact environment markets cannot survive in:
→ Slowing growth
→ Sticky inflation
→ Tight liquidity
→ Rising geopolitical risk
→ Collapsing investor confidence
Now connect the dots.
When geopolitical stress collides with a fragile financial system, reactions do not stay contained.
They COLLAPSE.
Capital does not rotate slowly.
It stampedes toward safety all at once.
And risk assets?
They do not dip.
They DUMP HARD.
This is exactly how chain reactions begin.
Once markets start pricing prolonged instability instead of temporary fear, the entire system changes.
Watch oil.
Watch bonds.
Watch interest rates.
Because once this accelerates, there will be no time left to react.
I have spent decades tracking macro and systemic market reactions like this.
When the next move becomes clear, I will share it here publicly.
Follow and turn notifications on.
Because by the time it reaches the headlines, it is already too late.
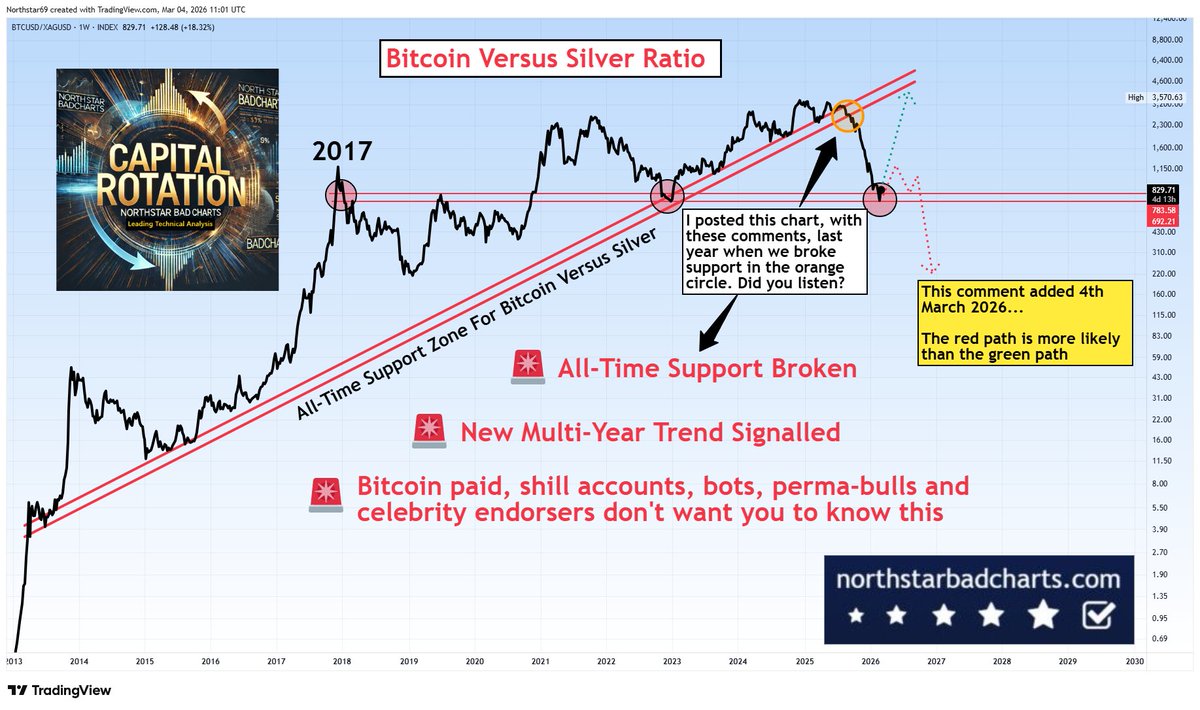
Bitcoin is bouncing up versus silver. Weight of evidence suggests it's a bear market rally until/unless Bitcoin recovers its 50-week moving average. Silver is likely to be the long-term winner moving for some time yet. If/when that changes, our members will know first.
Joseph Lubin, Ethereum Co-Founder and Consensys CEO just described Qubic.
He calls it the next crypto supercycle.
He talks about:
→ Personal AI agents
→ Decentralized identity
→ AI running on decentralized protocols
→ Protection from Big Tech manipulation
→ Users controlling their own interfaces
Read that again.
That is exactly what Qubic is architected for.
• Useful Proof of Work powering AI training.
• Quorum-based BFT consensus.
• Sub-second finality.
• Zero fees.
• Bare-metal nodes.
• Decentralized AI infrastructure with Aigarth.
While most of crypto is still optimizing financial primitives…
The real shift is intelligence sovereignty.
Ethereum’s co-founder is pointing at the future.
Qubic is already building it.
Most people will not connect the dots yet.
That is why it is still early.
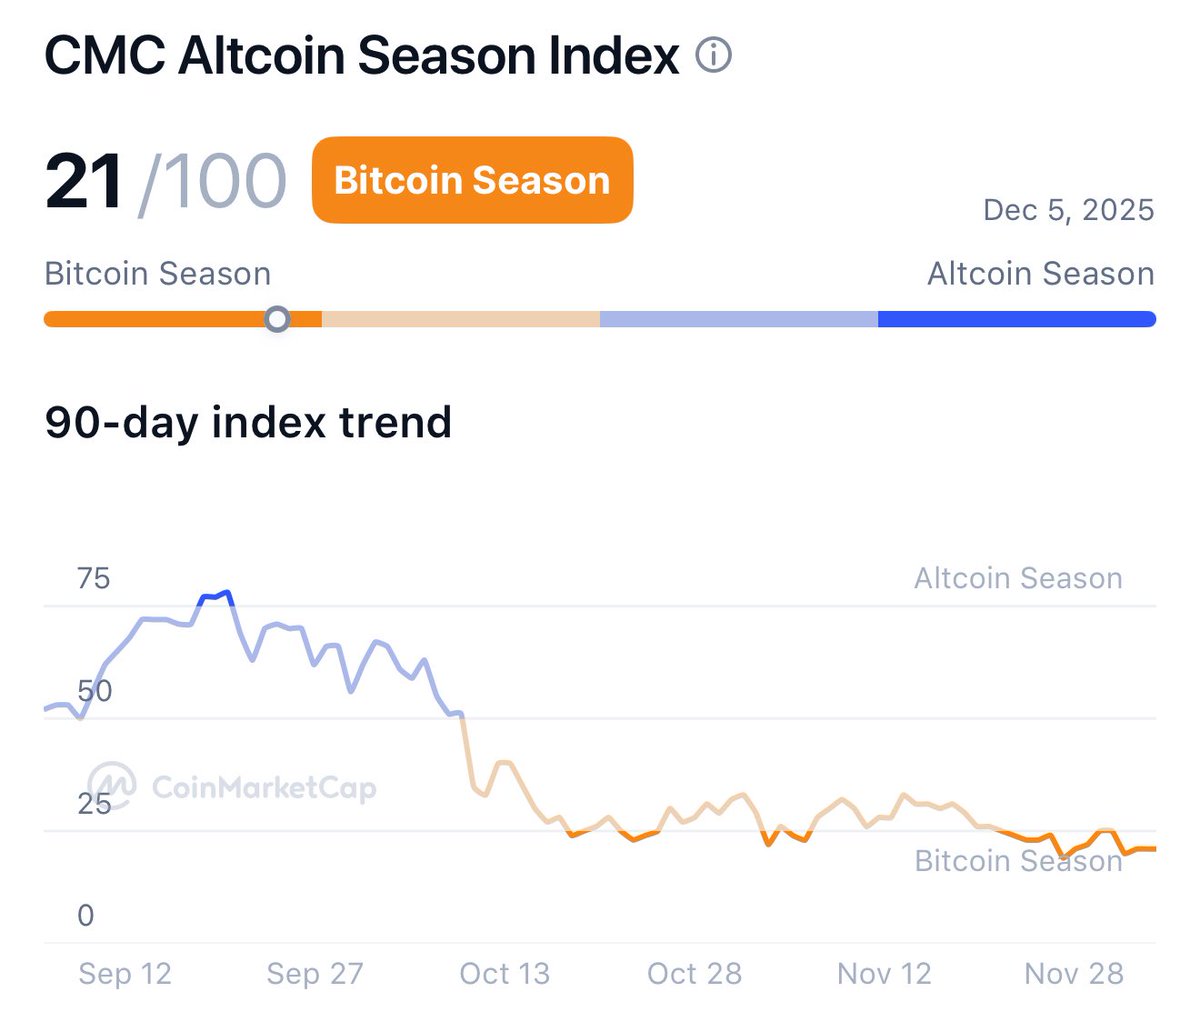
THEY TOLD YOU ALTSEASON IS DEAD
They are asking the wrong question.
The crypto market you knew no longer exists.
In 2025, it quietly split into two completely separate games. Different rules. Different players. Different winners.
And almost no one noticed.
GAME ONE: INSTITUTIONAL CRYPTO
Bitcoin. Ethereum. ETF assets. Quarterly cycles. Pension funds and advisors setting prices. Volatility crushed from 84% to 43%. Time horizon: months.
GAME TWO: ATTENTION CRYPTO
37 million tokens. 36,000 new ones launching daily. 98.6% collapse below $1,000 liquidity. 75% dead within 24 hours. Survival rate: 1.4%. Time horizon: hours.
Here is what should terrify you:
Major altcoin/BTC ratios have returned to December 2020 levels.
Five years of building. Partnerships. Ecosystems. Narratives.
Zero progress against Bitcoin.
The transparency paradox destroyed everything. When every wallet, every transaction, every accumulation is visible instantly, information edge vanishes. Only speed remains. Milliseconds, not conviction. Algorithms, not analysis.
Capital no longer rotates from Bitcoin to alts.
It flows directly to whichever game the mandate specifies.
Traditional altseason probability: 10 to 15 percent.
Not because speculation died.
Because the unified market that altseason required has been structurally dismantled.
Your only choices now:
Play Institutional Crypto with patience and macro awareness.
Or play Attention Crypto with speed and infrastructure.
The middle ground, holding altcoins on thesis for months, is now the worst possible strategy.
You are not early to altseason.
You are waiting for a market structure that no longer exists.
Full thesis below.
https://t.co/ZO6TJx2247
@crypto_banter Correct for the time period your show here but that’s not complete and also we did see Nov, Dec and then a very red Jan in the years you do show. So it’s a very manipulative post.
Here is what you all need to understand.
I'm going to explain this in detail for you so you know where we are, and why this is nothing like 2021.
Bitcoin, and the rest of the market, are liquidity vessels.
Their cycles are NOT dependant on an arbitrary 4 year number.
But they ARE dependant on the wider liquidity and business cycle, which is totally different this time.
And you can see here on this chart that BTC mirrors exactly the:
- COPPER/GOLD chart
- ISM/PMI chart
So what are these?
The COPPER/GOLD chart is one of the best indicators to understand that state of the economy.
COPPER is one of the most widely used metals on Earth for almost all form of building and development.
When COPPER is pushing higher, it is because the economy is expanding and the demand for it is high.
GOLD, is used as a hedge and safety trade, and when that is expanding, it is because the global market is shaky and people are keen for too much risk.
What this means overall is that when COPPER/GOLD goes up, COPPER is stronger because the demand for that is higher(expansion globally) and GOLD is trending lower, because everyone is more risk on.
You can see very clearly that when COPPER/GOLD goes up, BTC moves at the same time and always has.
At the bottom of the chart we have the ISM/PMI, which is the index used to understand whether the economy is expanding or contracting.
Historically, when this is below 50, like it is now, the economy is contracting.
When this happens, as you can see, COPPER/GOLD goes down and so does BTC.
Literally in unison.
And right now, we are in the longest contraction of PMI ever recorded.
When PMI ticks over 50, we enter expansion and COPPER/GOLD also goes up... and yes, so does BTC.
So what does this tell us?
Well, look at 2021.
COPPER/GOLD had been expanding for months and was topping out, just like PMI.
In 2021 we were at the peak of the business cycle and only massive contraction lay ahead.
Right now, COPPER/GOLD is bottoming and PMI is grinding up towards 50+.
All at the same time as we are about to come out of the longest liquidity contraction ever, and into easing.
Ask yourself...
Do you think this is all a coincidence?
That this has been the longest contraction cycle, and the longest COPPER/GOLD and PMI contraction also?
No, it is not.
And that is because ALL of this is linked.
The expansion phase of this liquidity/business cycle has not even properly got underway yet, and you can see this with your own two eyes looking at this chart.
The fact here is that BTC has been pushing higher in an overall contracting global environment, and as i keep saying, the only thing that has been pushing it higher has been institutions and government adoption.
The reason it is weak, totally different to any other bull market, and cannot sustain a true pump, whilst the altcoin market has been down only is because of what I have just told you here.
Todays conditions could not be more different to 2021...
I have made this crystal clear for you in this and many other of my posts.
If you think you are gonna get a 2022 bear market from here and you can sell or your bags now, add a massive 50x short, ride it easy, then chuck your profits into BTC at 75% down...
You're fucked.
Massive expansion is what lies ahead.
Not a deep bear market.
BITCOIN’S SILENT REVOLUTION: $50 BILLION VANISHED WITHOUT A TRACE
Old guard Bitcoin whales just executed the largest wealth transfer in crypto history. 470,000 coins dumped since January. $50 billion in raw selling pressure. Zero crash.
Price locked above $100,000.
Every precedent shattered. 2013 collapsed 85% on whale exits. 2017 bled 84%. 2021 knifed 53%. Today? Institutional titans swallowed every coin like it never existed.
BlackRock, MicroStrategy, and corporate treasuries absorbed the avalanche. ETFs vacuumed $64 billion year to date. November 7th alone reversed six straight days of $660 million outflows with $240 million flooding back in. MicroStrategy now hoards 641,000 coins. Corporate buyers snatched 131,000 coins in Q2 alone while ETFs grabbed 111,000 more.
The physics changed overnight.
When institutions control supply, 80% crashes compress to 30% corrections. Volatility cut 40% below every historical cycle. Miners generating $48.6 million daily post-halving yet holding reserves instead of panic selling. This is structural transformation, not speculation.
Traditional cycle indicators still pulse but stretch across institutional time horizons. Pi Cycle sits dormant at $114,000 while its trigger threshold waits at $205,600. Three cycles, 100% top prediction accuracy. Today? Silent, not broken.
MVRV Z-Score: 2.06, miles below the 5.0 euphoria threshold. Supply in profit: 71%. Realized Unrealized Loss: 3.1%, textbook mid-cycle consolidation. Puell Multiple: 0.95, screaming undervaluation. Every metric signaling accumulation disguised as distribution.
JPMorgan models $170,000 targets. Bitcoin to gold ratio at 0.05 implies 70% upside to historical norms. Not hype, mathematical reversion.
Three futures crystallize by mid-2026:
Bull extension at 60% probability: ETF inflows exceed $50 billion annually, rate cuts below 4.5%, price surges $150,000 plus. Confirmation signal: weekly inflows sustaining above $1 billion.
Consolidation at 25% probability: Selling pressure equals institutional buying, range-bound $90,000 to $110,000. Trigger: dollar index spiking above 110.
Bear reversal at 10% probability: Whale volume exceeds 500,000 coins annually, collapse below $80,000. Trigger: recession coupling with $2 billion weekly ETF outflows.
Hyperaccumulation at 5% probability: Sovereign treasury adoption, price exceeds $200,000. Trigger: formal reserve laws passing Congress.
Critical tripwires: sustained whale selling above 500,000 coins yearly pressures sub-$100,000 levels. ETF outflows exceeding $1 billion weekly shifts sentiment bearish. Watch corporate treasury filings for acceleration signals.
This is not weakness. This is generational handoff from speculative holders to balance sheet buyers with infinite time horizons. Retail sold fear. Institutions bought structure.
Markets don’t crash when absorption exceeds distribution. They consolidate then explode.
Position accordingly. Stay Blessed!
I know no one wants to hear bullish ideas and everyone is scared and wants to fling poo at each other... but the Road to Valhalla is getting very close.
If global liquidity is the single most dominant macro factor then we MUST focus on that.
REMEMBER - THE ONLY GAME IN TOWN IS ROLLING $10TRN IN DEBT. EVERYTHING ELSE IS A SIDESHOW. THIS IS THE GAME OF THE NEXT 12 MONTHS.
Currently the gov shutdown has forced a sharp tightening of liquidity as the TGA builds up with no where to spend it.
This is not offset by the ability to drain the Reverse Repo (it is drained). And QT drains it further.
This is hitting markets and in particular crypto which is the most liquidity driven. TradiFi asset managers have had one of their worst years of performance vs benchmark and are now having to chase markets and that is allowing tech to be more stable than crypto. 401K flows help too. If this liquidity drain keeps going longer, stocks will get hit hard too.
However...
As soon as the gov shutdown ends, the Treasury begins spending $250bn to $350bn in a couple of months. QT ends and the balance sheet technically expands.
The Dollar will likely begin to weaken again as liquidity begins to flow. Tariff negiotiations will have largely been completed, removing uncertainty
Ongoing bill issuance increases, adding more liquidity via bank balance sheets and money market funds (and stable coins).
Ongoing rate cuts (we will have economic weakness from the shutdown that will add to the evidence that rates need to come lower but no, there is no recession)..
SLR changes free up more of the banks balance sheets allowing for credit expansion.
The CLARITY ACT will get passed, giving the crypto regs so deserately needed for large scale adoption by banks, asset managers and businesses overall.
The Big Beautiful Bill then kicks in to goose the economy into the midterms. The entire system is now being geared toward a strong economy and strong market in 2026 for these elections.
China will continue to expand its balance sheet. Japan will work to strenghten the Yen, and also fiscally stimulate.
The ISM will rise as rates fall and tarrif uncertainty drops away.
You just need to get through the Window of Pain and The Liquidity Flood lies ahead.
Always remember the Dont Fuck This Up rules...and wait out the volatility. Drawdowns like this are common place in bull markets and their job is to test your faith.
BTFD if you can.
td:dr - When this number goes up, all number go up.
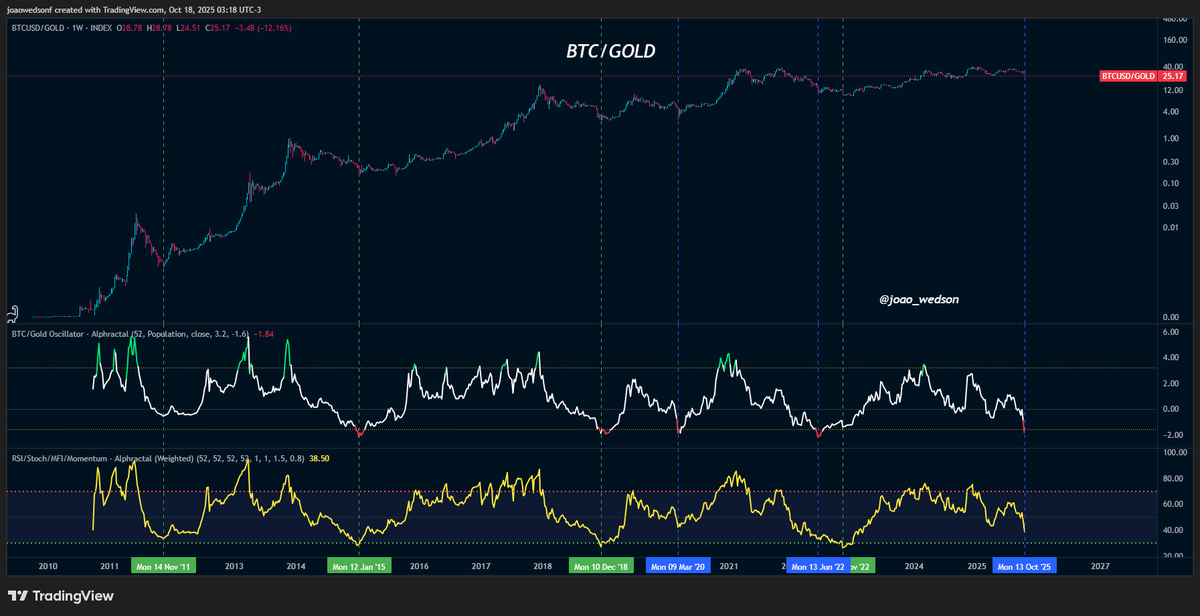
Historic Opportunity: Trade Gold for Bitcoin. 🟡⮕₿
Bottom signals in the BTC/Gold ratio are extremely rare, and they tend to appear during high-volatility moments and sharp BTC drawdowns.
Well, we’re exactly there right now.
The blue signal marks the current bottom, revealed by a normalized oscillator that’s basically screaming: “time to sell gold and buy Bitcoin.”
The green signal, on the other hand, is even stronger. It shows up when both metrics align at their lows, and historically those moments have been the best BTC/Gold opportunities ever recorded.
My message goes out to institutional gold accumulators:
if I were you, I’d take a close look at this chart.
The risk-reward profile of Bitcoin looks far more attractive right now, especially considering the current gold euphoria.
Use this chart however you want.
But mark this moment — it could be remembered as the turning point between Gold and BTC.
The elephant in the room:
Confidence in fiat currencies has collapsed.
As a result, absolutely no one wants cash right now.
In fact, cash allocation for institutional investors is down to 3.8%, the lowest percentage in 12 years.
The Fed will soon lose its independence, rate cuts are coming into stagflation, and global debt jumped +$14 TRILLION in Q2 2025, to a record $337.7 trillion.
You are either buying stocks at record highs, piling into gold and silver, or buying crypto.
Meanwhile, corporations are investing hundreds of billions into AI and governments will soon join the AI arms race, prompting more money printing.
This is exactly why we have been constantly stating to "own assets or be left behind."
Fiat currencies are losing their purchasing power and asset owners are looking to defend against it in any way possible.
As investors, we can only play the hand we are dealt.
🔥Central banks' rush for gold is HISTORIC:
Central banks now own more gold than US government bonds for the first time in decades.
Their gold holdings as a share of international reserves hit 24%, the highest since the 1990s, surpassing Treasury holdings’ share of 23%.
Wanted to share a few thoughts tonight...
This is from the September 11th MIT publication that dropped on @RealVision:
For starters, unemployment keeps grinding higher, exactly as our lead indicators and GMI/MIT work flagged back in Q1.
That keeps the Fed engaged and is why, as I noted in last week’s video update, the market has started pricing in a higher probability of cuts at the September, October, and December meetings...
US unemployment is now at 4.3%, right on the Fed’s low estimate for 2025 (chart 1).
If it drifts toward 4.5% or 4.6%, as our lead indicators suggest, that’s a green light for more cuts into 2026, even though there are early signs the employment cycle has already turned up. More on that in a moment...
At the same time, unemployment breadth peaked over a year ago and continued to fall in August (chart 2).
Quantitatively, this is a good sign. The index rises into recession, it doesn’t fall…
We peaked last June at 92%, but it has since dropped to 62% of US states reporting a year-on-year rise in unemployment.
Now, take a look at this next chart...
This index tracks weekly overtime hours in the most cyclical parts of the US economy, with data back to the 1950s (chart 3).
Every recession has come when it rolls over toward the -2 standard deviation level, and we are nowhere near that.
Additionally, the August data showed a further pick-up in overtime hours, which, as I have been highlighting in these reports, is much more consistent with an early-cycle economy trying to build momentum than anything else...
This is exactly why S&P earnings revisions keep exploding higher, just as we’ve been expecting (chart 4).
The Fed is cutting rates right as the business cycle is turning up. That’s hugely bullish for risk assets.
These aren’t late-cycle recession cuts. They’re early-cycle insurance cuts... two very different things.
The end of The Waiting Room is near...