Bitcoin – What’s Next?
The Big Sunday Report: All We Need to Know
🚩 TA / LCA / Psychological Breakdown: In February at 60k, I made it very clear that Bitcoin would stop its downtrend at that moment and that we would see a relief rally. Since then, Bitcoin went up to 75k (up by 27%) and is still moving within the current box formation. What many fail to understand is that Bitcoin, or any other asset, never goes up or down in a straight line. We always see in-between fluctuations of sideways movement or even short-term relief rallies.
In this case, we have seen an upside of 27%. At this point, I don’t consider an entry attractive in terms of risk-reward, as I remain extremely bearish, but there is still room for upside and it is not off the table. So what does this mean for the current strategy? As mentioned in the last weeks Sunday report, the strategy has not changed much. We keep the short from 115–125k open, including adding short orders between 79–84k if the market allows us to revisit that zone. This means that if the market sees another rally, I will enter shorts in the mentioned area, buying and betting that we will reach those areas is something I would not do.
Is it certain that 79–84k will be reached? As mentioned, I have been observing these levels for two months and I see a slight high medium probability. However, due to the geopolitical scenario we are currently in, I consider the risk-reward NOT WORTH IT to be positioned in spot or in a long, even if those targets have a probability. Rather, I see Bitcoin in a bear market that has not bottomed yet. For that reason, placing short orders between 79–84k is, in my view, the much safer bet, with targets below 50k.
Join Premium: https://t.co/WAXkjQ12uM
This is the official roadmap for the next 5 years.
Read this carefully.
Stage 1: 20% Correction. (2026)
Stage 2: Blow-off top to 10,000. (2026–2030)
Stage 3: Worst crash in stock market history. (2030+)
This correction is the last great buying opportunity of the DECADE.
The blow-off top hasn't happened yet.
AI mania will fuel the last leg to 10,000.
Then the bubble POPS.
Here's what you do:
Stack cash on this correction.
Ride the blow-off top.
Get out before 2030.
When I call the bottom — YOU BUY.
When I call the top — YOU SELL.
By the time people realize I was right all along, it will be too late.
NIFTY 50🔥
NIFTY is very close to my major zone now. Be ready for a truckload of stocks. 👀📈
Once NIFTY approaches that key area, I will be actively tracking high-probability setups across multiple names. The focus will be on stocks showing strength, clean structure, and sharp reactions from key levels.
It turned out to be a great decision to completely book mutual funds around the 26,200 level. Also booked nearly 35% of my stock positions, which helped lock in gains at the right time.
Two days ago, I redeployed 40% of the mutual fund capital that was booked earlier. The remaining 40% is planned to be deployed around the first major zone that is approaching and rest will use as cash for any further big dip and pyramiding .
#StockPortfolio #stockmarketinvestor #niftycrash #nifty50
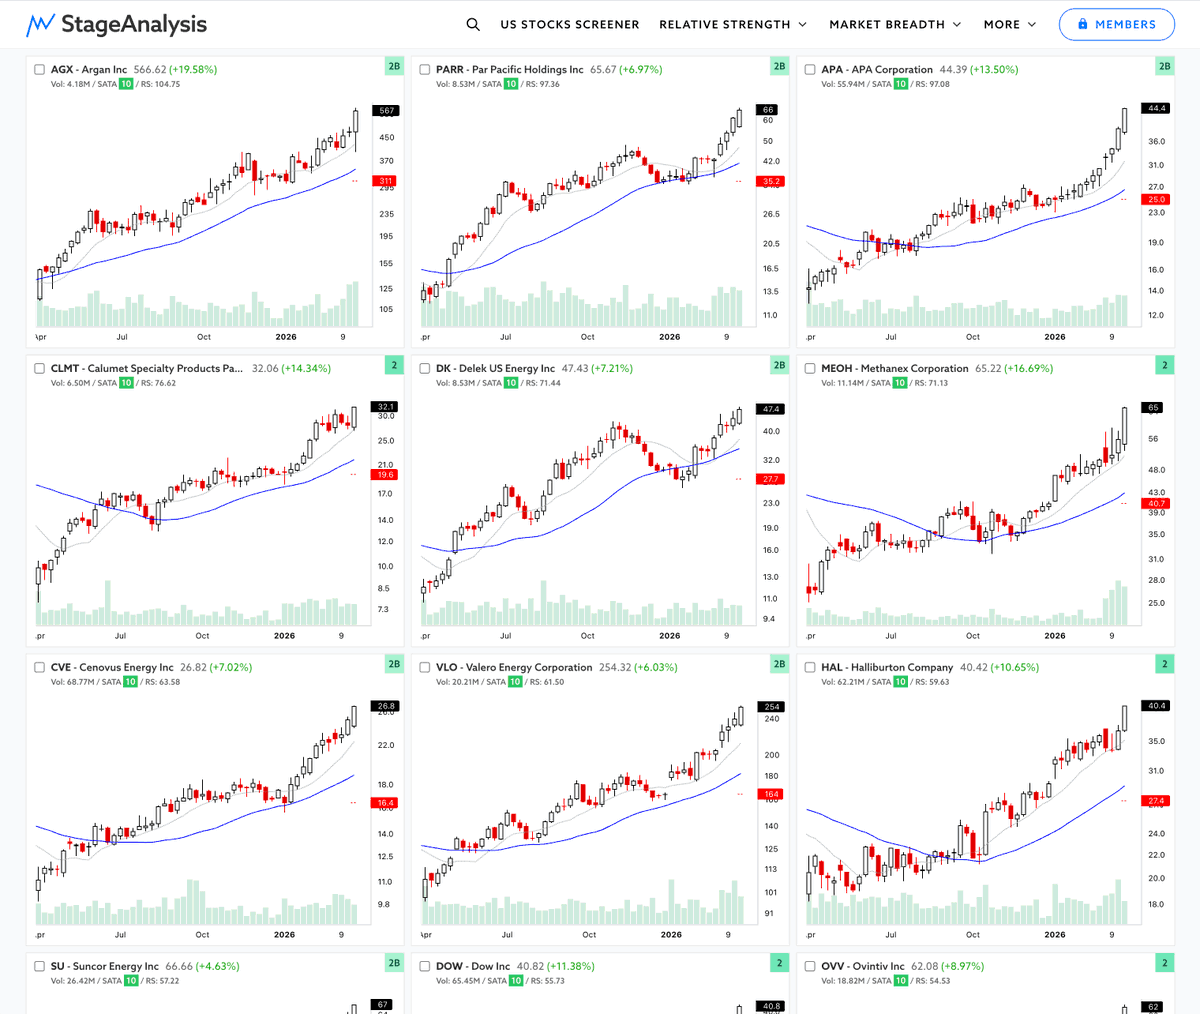
Some of the current leading stocks:
AGX, PARR, APA, CLMT, DK, MEOH, CVE, VLO, HAL, SU, DOW, OVV, OIH, DVN, OXY, PSX, XOM, CRC, XOP, MTDR
Energy sector dominating at the moment with powerful Stage 2 advances, while the majority of the market is falling in Stage 4 declines.
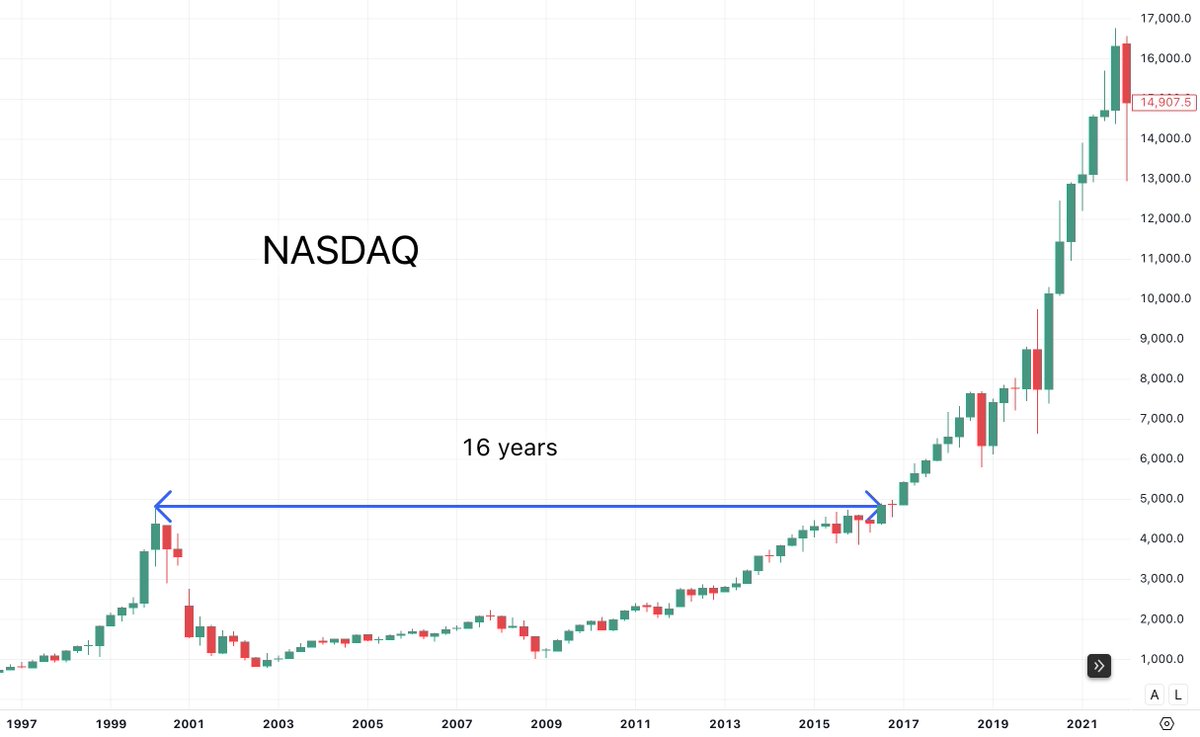
The Nasdaq enters the week down 10 of the last 11 trading weeks. Red dots on the chart below show the prior four times that’s happened (it has never been down 11 weeks in a row). Thoughts?
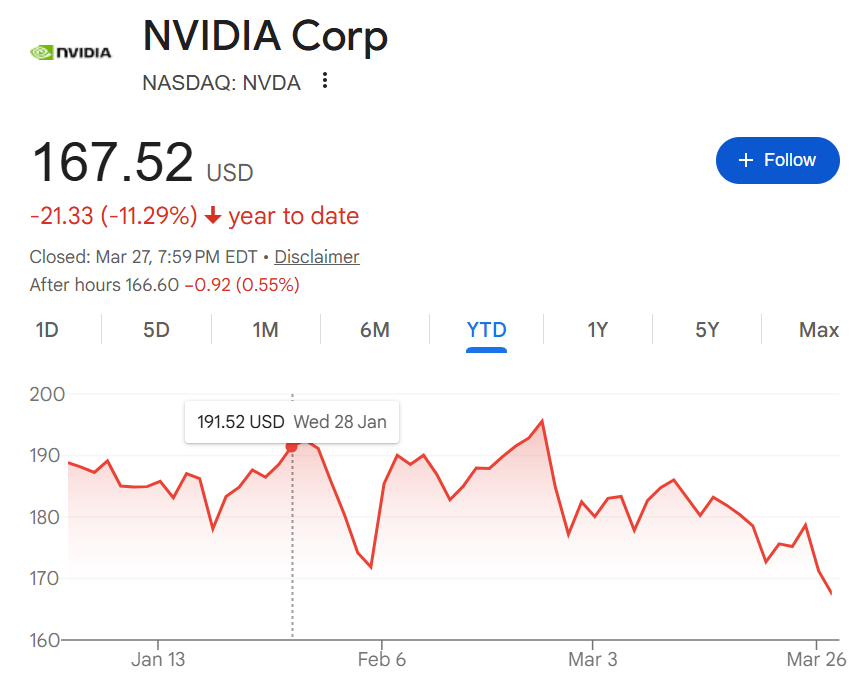
$NVDA was at $207 just a few months ago. Now it’s $167 AFTER record revenue and strong AI demand. If this is not one of the best discounts on the best AI company in the world, I don't know what is.
One simple trick which can simplify your market view:
In downtrends, you want to see two thing:
1. Price break the downtrend channel
2. Price reclaim 21EMA
this is the very first thing you'd see to confirm a bottom.
There is a big difference between: Bottom vs a confirmed bottom
Just looking at this chart- $SPY has a lot of work to do
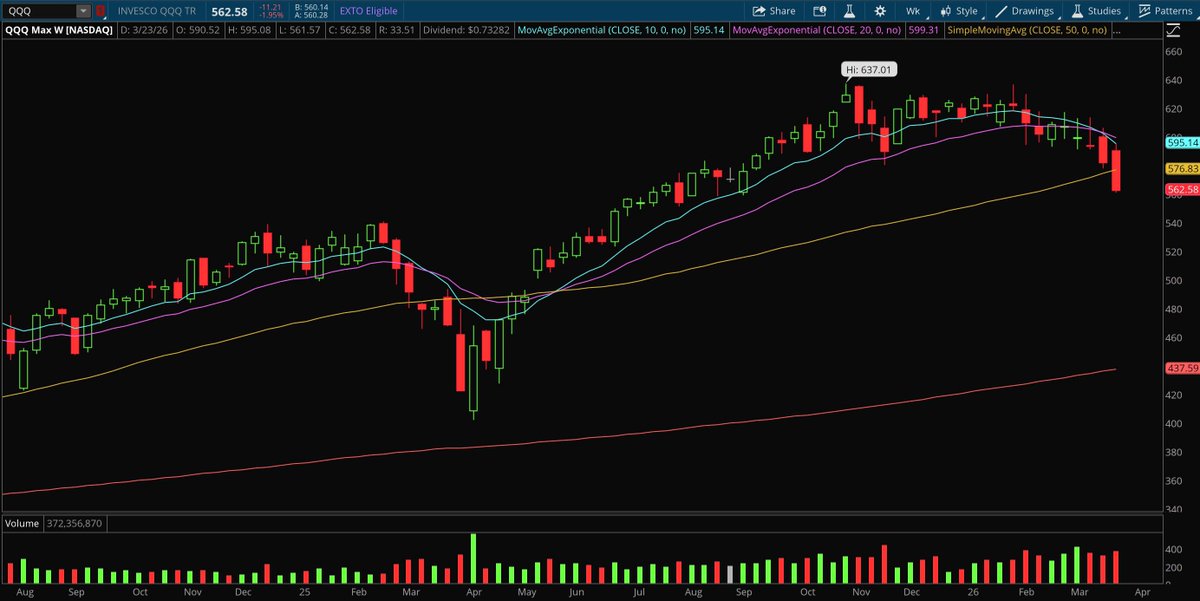
Look at the uptrend that followed the bottom in the Nasdaq last April.
You do not need to be the first back in.
There were a few weeks of basing off the bottom, then off to the races.
Watch for basing + big volume, those will be two key signals to get heavily involved again.
It's hard to overemphasize how important tech is to this market, so here's a statistic that helps to drive it home.
Tech is expected to account for a whopping 87% of annual S&P 500 earnings growth in Q1.
As goes tech, so too goes the market.
$MSTR (March 30, 2026-weekly chart)
Never bet against the combo (Volatility Hole + Yellow Candle)! Simply using yellow and red candles alone doesn't always work.
The Volatility Hole is a highly effective tool for improving the accuracy of yellow and red candles. It also serves as a reliable indicator to predict volatile trends.
The most recent Volatility Hole (highlighted in white) is still in force. If $MSTR fails to return to the previous price range, expect another drawdown.
@cantonmeow@matthughes13@chad_ventures


![Chart_Wallah108's tweet photo. 𝟭𝟱 𝗥𝗼𝗰𝗸𝗲𝘁𝘀 𝗶𝗻 𝗰𝘂𝗿𝗿𝗲𝗻𝘁 𝗕𝗲𝗮𝗿 𝗠𝗮𝗿𝗸𝗲𝘁 🔥
Stocks which are up 40%-260% in 1 year 💥
Save it for Later 🔖
A Mega [Thread] 🧵
1] Acutaas Chemicals Ltd https://t.co/07gcoYLYs8](https://pbs.twimg.com/media/HElZtOdbwAALpkD.png)