Since WWII there have been 48 total 10% corrections on the S&P 500.
How many turned into bear markets? Only 12 of them, so about 25% of the time.
Then don't forget we already had two bear markets to start this decade and those were the two closest bear markets in history.
Yesterday was the worst day of the yr for the S&P 500 at -2.7%.
Turns out even the best yrs usually have a bad day. I found 22 times >20% for the year and the average worst day in those years was -3.5%.
1997 had a 6.9% worst day and still gained 31% for the year in fact.
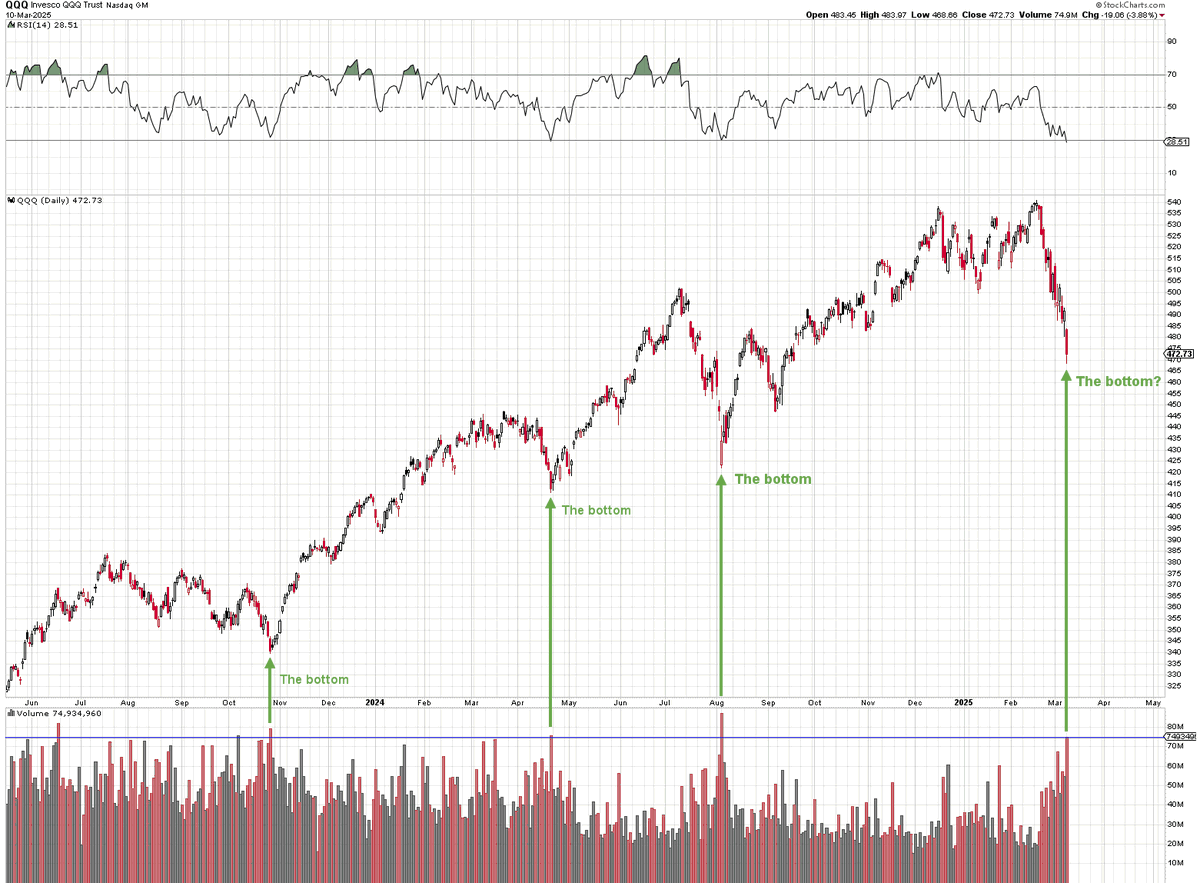
🚨 $QQQ Chart for bulls eyes only! 🚨
Today marked the 4th largest volume day since October 2023.
What happened to the top 3 largest volume days?
All three marked THE bottom.
Extrapolate how you see fit.
.
Bottoming Signals Galore on S&P 500
The S&P 500 is forming a quadruple bullish divergence on the RSI it's 60 minute chart. This is the STRONGEST reversal signal in technical analysis. A big rally is coming late in today's session or tomorrow that will continue into next week. Additionally the MACD is forming bullish divergence.
These divergences on the hourly chart are forming at the 200 day MA on the daily chart. A massive rally is about to happen to complete the blow-off top on the S&P 500. We'll see if the rally starts today or tomorrow.
$SPX $SPY $QQQ $NDX #Tariffs #tradewar #Trump #inflation #recession #stockmarketcrash
Mainz Biomed is on the front lines of
the fight against colorectal cancer this month,
calling for prevention first.
Together, we can make a real difference! 💥🚀
#sweepstakes $ARM #NASCARatCOTA $AVGO
#zelena $QCOM #shailenzo $META
#srchafreen $CAG
S&P 500 closed above/in the Election Gap and inside trading range that has been in place for 16 wks. An upward-sloping black 250-day moving average (5607) sits below the current range. If the market backtracks to 5607, that would be an 8.74% pullback from the recent closing high.