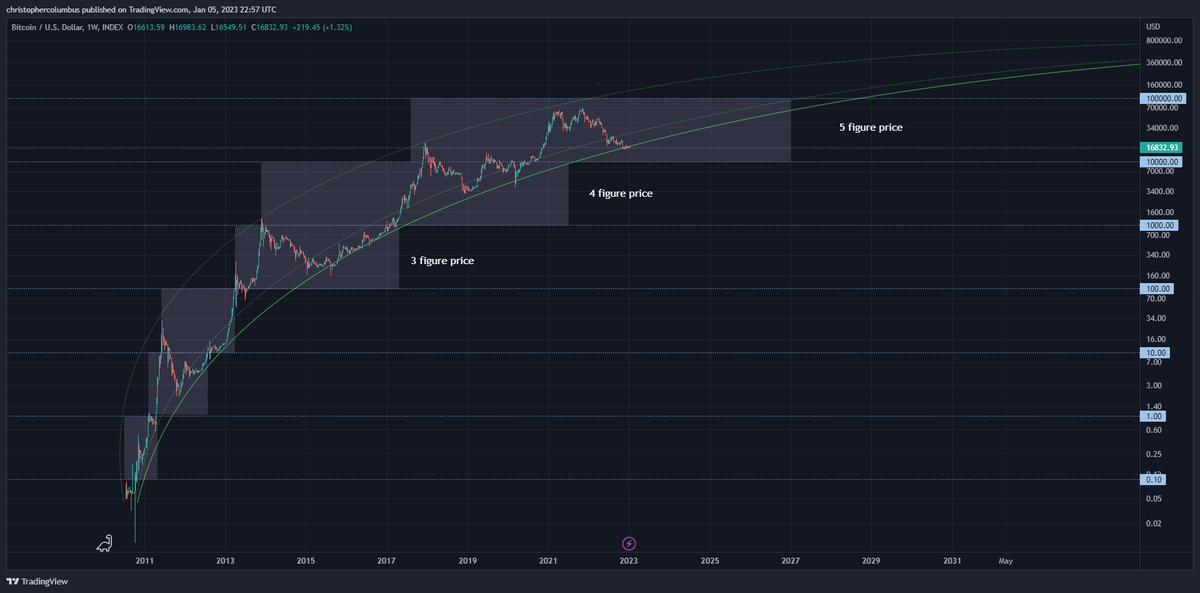
#BTC Chart Analysis
Support Zone : 16680 - 16600
Resistance : 17090 - 17275 - 17655 - 18400
If #Bitcoin Breaks Below 16680 - 16600 Then We Will Consider That A Support Broken
We Should Wait For Sometime (Until Break Below Support) To Call A Top Of C Wave
#Bitcoin Time & Cycles ⌛️♻️
In the past 2 cycles when December started, the top was in for #BTC. From there it took 13 months for the Bear Market to come to an end in January.
Well, it's been 13 months since December 2021 and January's just started.
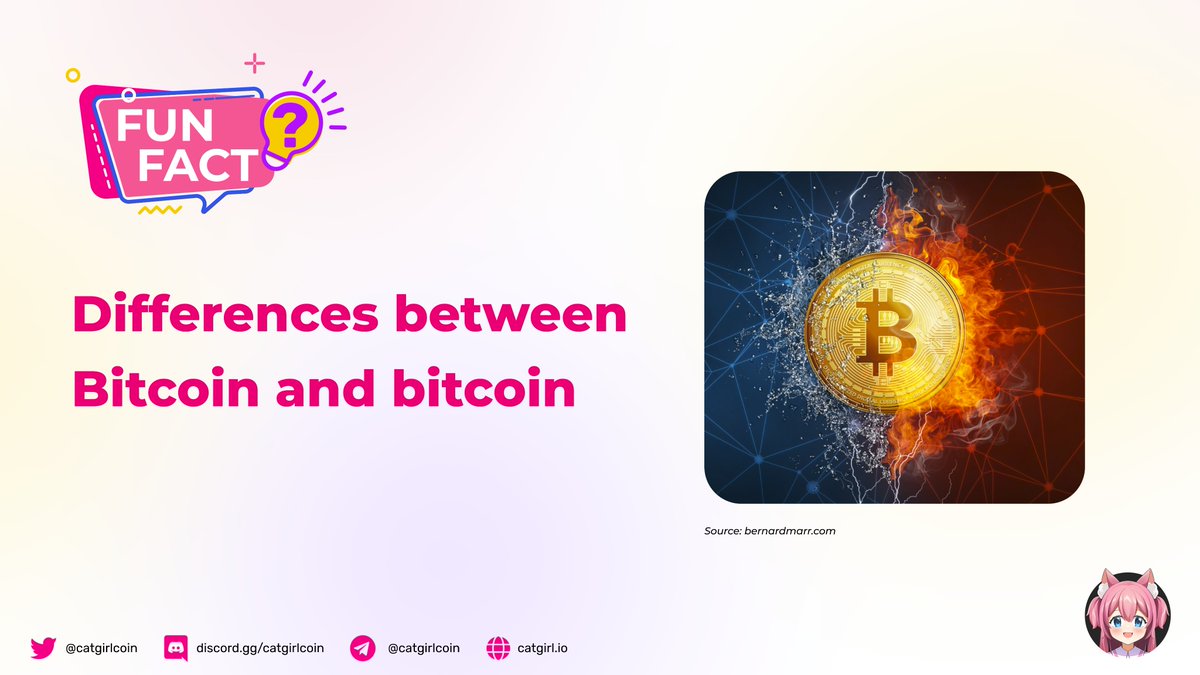
Bitcoin with the uppercase B refers to the #payment network & ecosystem.
Ex: “We’re learning about #Bitcoin.”
Bitcoin, with the lowercase b refers to the currency itself
Specifically in reference to the amount of transaction
Ex: “I just sent a few #bitcoins to your wallet.”
#BTC
#Bitcoin / $BTC
Finally looks like BTC is ready to break out of the $16K - $17K base range it’s been stuck in the past several weeks.
Initiate the squeeze.
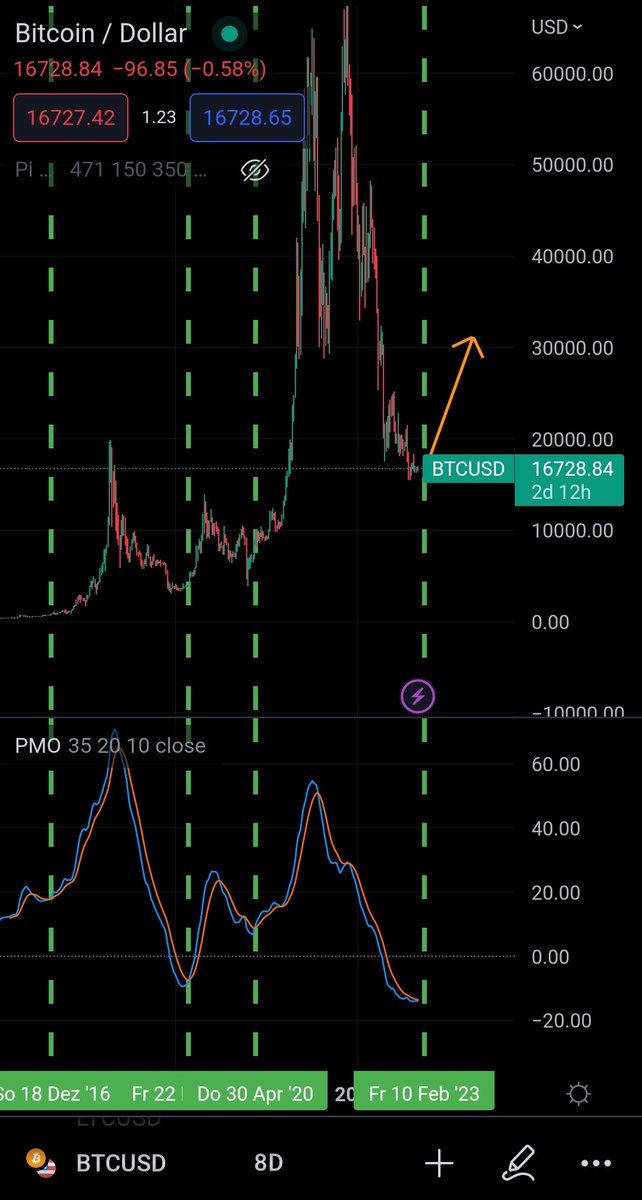
#bitcoin bull-market imminent 🚨
Always when the #PMO indicator crossed to the upside on the 8 day chart, a bull-market followed in $btc historically. It is very close to cross again, potentially within the upcoming two weeks 🫡 #crypto
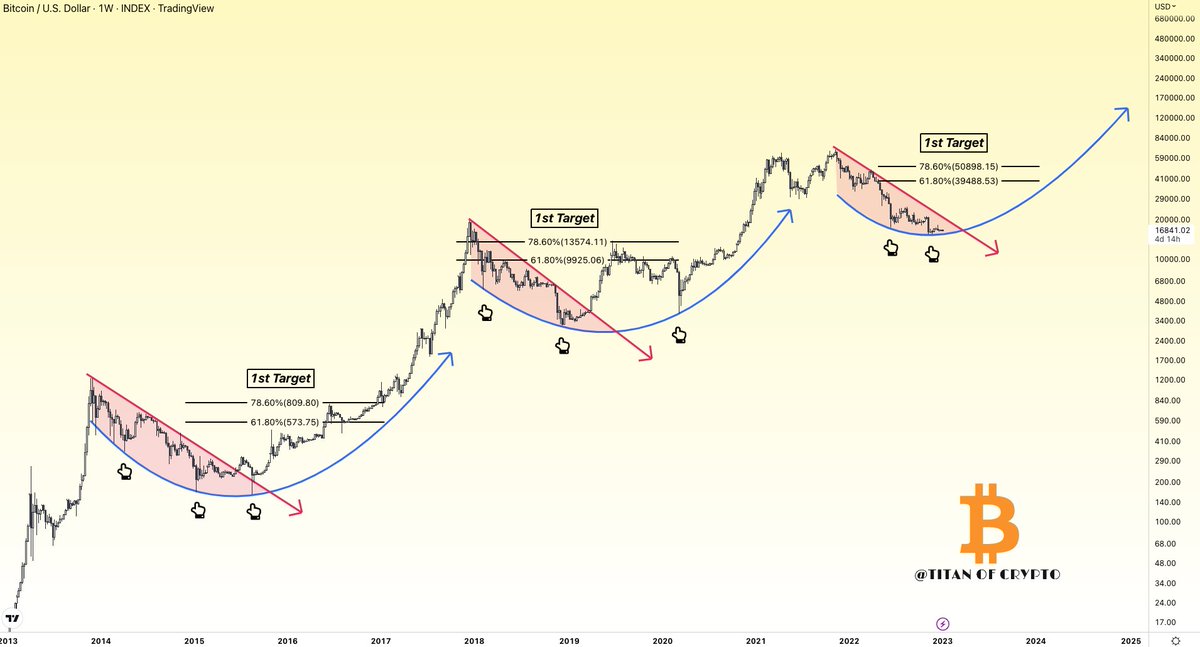
#Bitcoin Bottoming Area
#BTC likes to find its bottom around the 78.6% fibonacci retracement. This area is usually where the accumulation phase of a cycle takes place.