Deputy team leader & senior equities reporter for US stocks @business. Formerly @USATODAY @WSJ. Proud Texan living the dream in NYC. @TAMU alumna. Views mine.
The SOX, home to chip bellwethers like Nvidia, Intel and AMD, trailed the Invesco S&P 500 Low Volatility ETF (SPLV) by more than 11 percentage points on Friday — its widest underperformance in history relative to its counterpart, per data compiled by Bloomberg going back to 2011.
This week's Trump-Xi meeting could be the next test for stocks that are clocking one record after the next. @JessicaMenton and I broke down the stakes for equity investors and some of the companies in focus, including $NVDA and $BA.
Gift link: https://t.co/rERdIaqxhi
The $SOX has trounced $SPX by nearly 62 percentage points since early January — on track for its second-widest outperformance versus the benchmark equities gauge in the first six months of the year ever, according to data compiled by Bloomberg going back more than three decades.
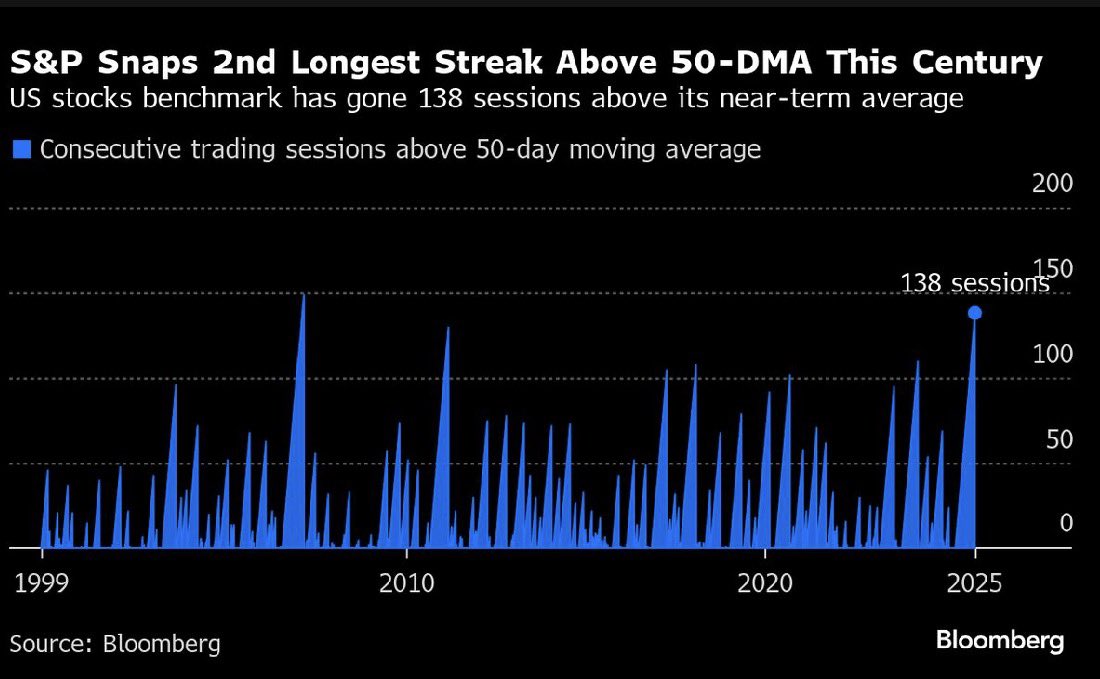
The S&P 500 snapped 138 sessions during which it held above its 50-day moving average — its second-longest stretch this century behind the one ending in February 2007, which ran for 149 sessions, data compiled by Bloomberg show.
My scoop from earlier today: Brian Belski has left BMO Capital Markets
Lots of major strategist exits past 2 years - Chris Harvey from Wells Fargo, Jonathan Golub from UBS, Marko Kolanovic from JPM & Goldman's David Kostin will retire later this year
https://t.co/5yqnJyT2XO
The S&P 500 Index $SPX has spent 125 sessions above its 50-day moving average, its longest stretch since 2011, data compiled by Bloomberg show. The benchmark has clocked only three longer runs in the past 30 years via @markets https://t.co/IY7xZ7F7QA
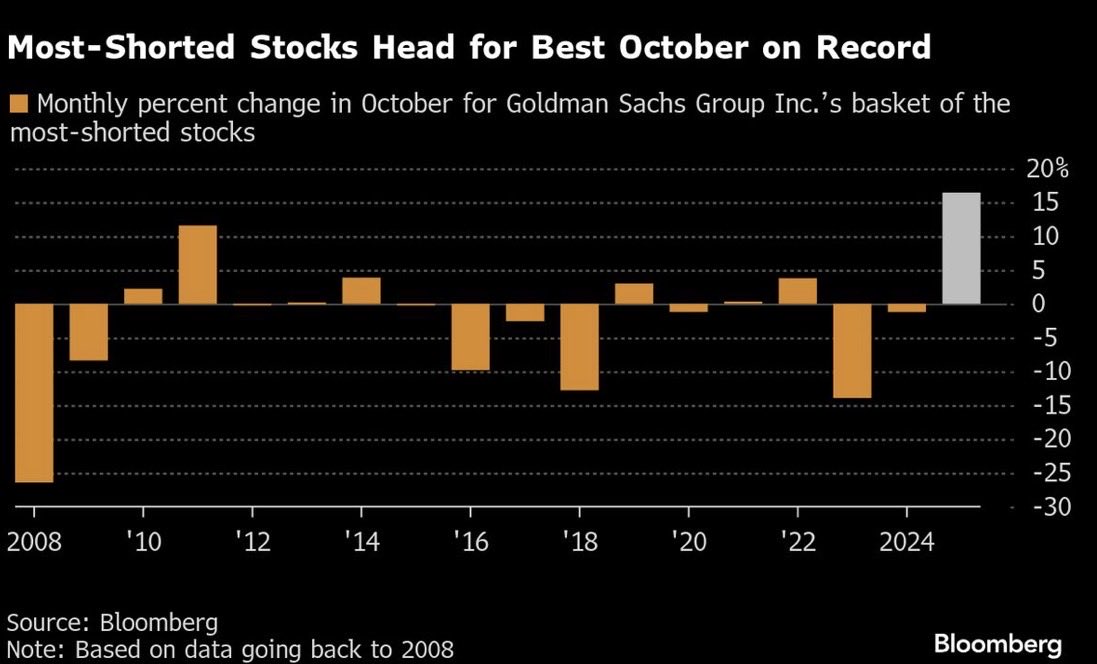
Goldman Sachs Group Inc.’s basket of the most-shorted stocks has surged 16% this month, beating the S&P 500’s 0.7% advance and putting the bank’s tracker on pace for its best October on record, based on data compiled by Bloomberg, going back to 2008 https://t.co/LX8PK04hyW
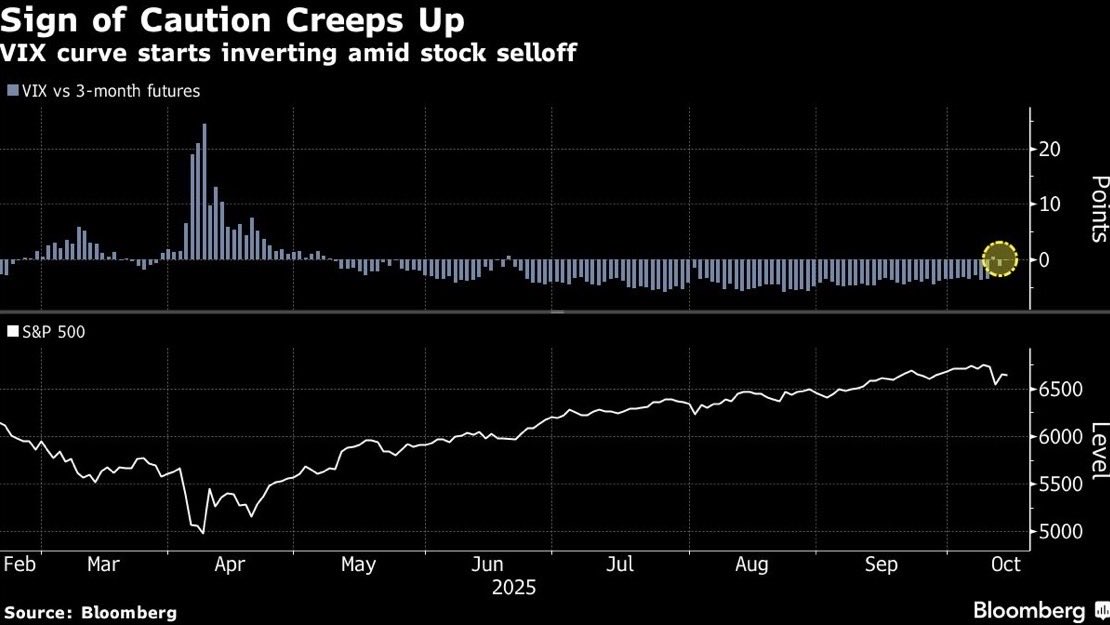
Almost all stock-market troughs in the past have occurred in periods of backwardation — when the VIX curve is higher near-term. But that usually happens when $SPX has suffered a steeper correction beyond 5% from a record. The good news for bulls is it’s a mild inversion for now.
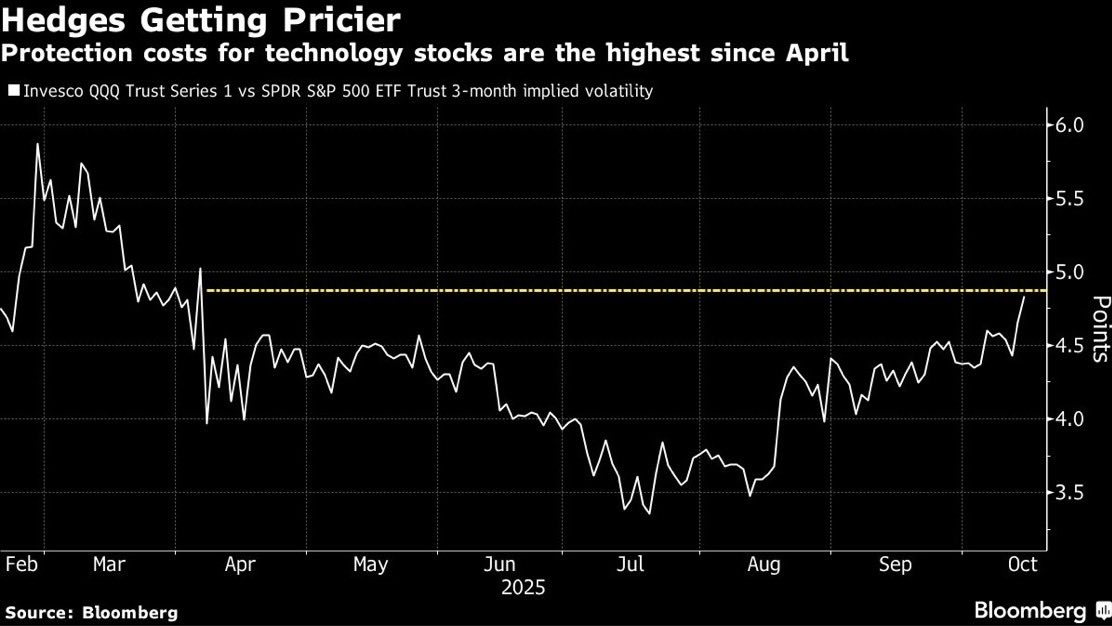
For some, the spike in near-term derivatives pricing is a signal froth had been blown out of the market, and there is no ominous warning emanating from the options market. To others, the inverted VIX curve is a precursor of more pain for stocks. https://t.co/GHk7RhMGik
An equal-weight version of the S&P 500 has trailed the version that is weighted by market value by 21 percentage points since October 2022 — the widest underperformance from the start of a bull market since at least the 1990s, data compiled by Bloomberg show.
The S&P 500 began its current bull run on Oct. 12, 2022, soaring 83% in that time and adding about $28 trillion in market value. The benchmark’s 13% jump the past 12 months is twice the average rise in the third year of a bull market, per @StovallCFRA https://t.co/fdfV5mjuuK
Of the 13 prior bull markets since World War II, 7 completed a 4th year, with an average gain of 88%. This one has essentially done that in three years, putting $SPX’s trailing price-to-earnings ratio at 25 — the highest ever for a bull market in its 3rd year, via @StovallCFRA