When Will $BTC Fully Reverse?
Bitcoin is getting close to the area where Cyclical Bottoms are usually built… but that does NOT mean the Bear Market is already over.
Don’t be the retail that gets trapped in these zones because: The Cycle Momentum is already in a deep historical support zone, but it has not broken back above the neutral zone yet.
Meaning: $BTC is weak enough to be near a bottoming area, but not strong enough to confirm a new Bull Trend. Hence, no reversal yet.
The Realized Price Level is showing something very similar. Historically, BTC bear-market bottoms usually came near or even below Realized Price — basically the average cost basis of the Bitcoin network.
That region is now around the low-$50Ks.
So, yes:
A bounce can happen.
A violent relief rally can happen.
But the clean Macro Bottom is still more likely after the market finishes its final ugly phase.
So no, this is not “BTC is dead.” And no, this is not “new bull run confirmed.”
Average people see red candles and panic or FOMO. But the Macro Investors prepare for opportunity to stack future wealth in advance.
Macro Report members already know the deeper roadmap. Cheers!
Here’s How (and Why) Dollar-Cost Averaging Works — with a Micro‑Cap Twist
(Very exclusive Wall Street @ P-Circle’s Content 🌟)
You must've heard BIG Investors talk about “buying the dip” all the time, but ever wondered how to do it without losing sleep?
That’s where Dollar‑Cost Averaging (DCA) Strategy is used. Instead of putting all your money in one lump sum, you invest smaller, equal amounts at regular intervals — say, every week or month.
That approach helps you buy more shares when prices are lower and fewer when they’re higher. It doesn’t tell you what to invest in, just takes the stress out of when to jump in, which is perfect for volatile assets like micro‑cap stocks.
Getting Off to a Safer Start: Two Ways to Read a Chart
Imagine you’re looking at a 1‑month chart of a small company in a sector you believe in (see attached chart). You have two main strategies:
1. Lowest risk, lowest return – wait for the price to close above the down‑trend line (the purple one on Mark’s chart). Even safer traders wait until it rises past a parallel resistance line. Patience is your friend here.
2. Higher risk, higher return – buy in earlier, even if the monthly trend hasn’t fully reversed. In micro‑caps, it’s normal to see dips of 10–20% along the way, so don’t panic if the price wobbles.
Either way, there’s no need for FOMO. With micro‑caps, lower often means a better value if you’re patient, and higher means there’s less risk because the trend has already turned. Pick the strategy that makes sense for you.
What About Price Targets?
Mark gave some examples of “deal levels.” Think of them like discount bins at your favourite store:
• Very conservative buyers might wait until prices fall to around $0.036 (his chart’s “yellow” line).
• More ambitious bargain hunters might start nibbling around $0.33.
• “I want a deal!” shoppers look for $0.25–$0.28.
It’s like choosing between the clearance rack and the full-price section — both have their perks, depending on your style.
How The Actual Wall Street Builds a Position
Here’s a neat trick from the pros: rather than dumping cash in all at once, they’ll often buy one‑sixth of their desired position every Friday near market close. Over six weeks they’re fully invested. This is textbook dollar‑cost averaging — it spreads out your entry price and helps smooth out the bumps. Simple, yet effective.
Why Micro‑Caps Are Not for the Faint‑Hearted
If the roller‑coaster analogies didn’t tip you off, micro‑caps are wild. These tiny companies can surge or crash dramatically, making them better suited for traders or very patient investors. They also warn that high volatility means you should keep your position sizes small and diversify.
So if you dive into micro‑caps, be ready to stomach big swings and do your homework — or stick to a sensible dollar‑cost averaging plan.
Final Thoughts
Long‑term investing is a marathon, not a sprint. Dollar‑Cost Averaging helps you stay disciplined, avoid emotional “buy high, sell low” mistakes, and build positions gradually. Combine that with a clear strategy for risk and reward, and you’re on your way to being the calm one when everyone else is either panicking or chasing hype.
(And yes, I’ll keep sharing exclusive content and signals if this post gets enough love!)
If this Post has EXACTLY 91 Reposts & 0 Likes in EXACTLY 24 Hours, I'll Gift $10,000 to 6th Comment. If not, I'll still gift $100 to the First Comment but Repost Target needs to be met.
$ETH, Liquidity & Alt‑Season Conditions – Explained
Look at $ETH Liquidity chart the same way we did for the $SPX: liquidity regimes matter. If you're waiting for Alt‑season since last proper one in 2020-21, watch ETHEREUM more closely than $BTC. It’s a better barometer for Alts performance.
Let's see the pattern of when Alts last took off... There are only two true Alt‑season periods to learn from: 2017‑18 and 2020‑22. In both cases, Bitcoin rallied first and then slowed while capital rotated into smaller coins.
• 2017‑18: Money supply was high and liquidity was loose. That was enough for a decent Alt‑season.
• 2020‑22: Liquidity wasn’t just loose, it was very loose. The money supply expanded, the Federal Reserve’s balance sheet and the U.S. dollar index $DXY were falling, and short‑term interest rates (2‑year yield) were dropping. Those combined factors created a monster rally in Altcoins. A drop in Bitcoin dominance followed, signalling that traders were rotating into riskier assets.
So why was 2017‑18 only “loose” while 2020‑22 was “very loose”? Because in 2020‑22, even though money supply wasn’t as high as 2017‑18, the $DXY and 2‑year yield were dropping and that’s more important than raw money supply. A falling balance sheet and lower yields add more fuel to liquidity than money printing alone.
We don’t bother with 2010‑13 data because Crypto (BTC) was born during a QE environment. To compare apples to apples, we start from 2016 onward.
Why Money Supply alone isn’t enough?
Money supply matters, but it’s not everything. For example, in 2024 the money supply was rising, and $BTC did fine, but $ETH and most altcoins didn’t. They need a special cocktail: loose money supply plus falling yields and a weakening $DXY. BTC can rally in tighter conditions; Alts can’t. The higher you go on the risk curve, the looser the liquidity you need.
What about now (2026)? Right now liquidity is very tight:
• $DXY is moderately high (not supportive).
• Money supply growth is weak.
• The 2‑year yield is elevated and stubborn.
Even with FED pausing its balance‑sheet tightening (QT), the overall mix remains restrictive for alts. That’s why there’s no real Alt‑season yet—and why even $BTC has struggled recently. Though, the Bright Spots:
• The FED’s balance sheet is no longer shrinking aggressively.
• Money supply looks like it could start improving (though it might take a recession or market crack to trigger it).
• $DXY is stable, and while it might bounce (a “dead‑cat” rally), it’s not in a runaway uptrend. This is also mentioned in Report 2-B.
I can’t predict the 2‑year yield with confidence. It depends on too many factors. But until it moves lower, liquidity stays tight.
So what’s the play?
• Don’t expect an Alt season soon. Altcoins might front‑run improving liquidity and rally before conditions fully loosen, but that’s usually after a scare (a spike in yields or DXY).
• Survive the scare. A mid‑year “2‑year yield scare” or DXY spike could be the positioning opportunity before the real easing cycle.
• Be selective. Out of thousands of Alts, only a handful will truly perform. $ETH is the safest bet if you want exposure; it tends to lead Alt‑moves. And when the right conditions arrive, Alt gains can embarrass $BTC and BTC gains can embarrass the S&P 500's.
In Summary: Know the right Alt‑season conditions—as 2017‑18 and 2020‑22 taught us—and compare them to today’s tight regime. Until liquidity loosens again, focus on surviving and positioning.
Now, you're equipped with far more knowledge, hence far more power, than majority on X shouting "ALT SEASON!! ALT SEASON!!!" in literally every other post.
40 Days. Less than 1 in 84,000 People Currently believe this.
Less than 1 in 84,000 have the Privileged Access to Mr. P edge.
Spread The Word when nobody sees it coming.
Nfa. Think of it as Real Estate Priced CURRENTLY near $64K that is worth EASY $84K in few months? Is it not a GREAT DEAL.... Big Players are no longer Selling, Panic will soon be behind us. Give or take a test of lows or slightly lower, doesn't matter. Don't leverage. Don't underestimate appeal on SPOT here.
Friday Game on Telegram: https://t.co/g4ZheALp5q
Join for the BIGGEST Crypto Freebie ever Shared on Telegram Ever 🌟
Why am I doing it after successfully predicting This Crash that left Many Surprised?
To help you in these Red times like I would do for my Younger brother for being here and reading (with best of my Abilities, whatever I know, I could be wrong though)
Mr.P
I’m getting flooded with one common question:
“Mr. P… when should we sell Alts? What’s the right Exit strategy?”
I’ve finally prepared a full, noob-friendly breakdown thread. If this post gets 100 reposts, I’ll share it for FREE today at 6 PM UTC.
Meanwhile, you can drop your spot holdings in the comments section.
THE BULL RUN ENDGAME 🐂
Part #1: Markets Are Quietly Repositioning Ahead Of The Next FOMC Meet (Oct 28-29).
Fed Governor Waller has already hinted at another 25 bps rate cut, even with limited data coming in because of the US Government Shutdown. It lines up perfectly with the Liquidity Window I've outlined in the October Crypto Report (check pinned post).
That’s what makes the next 10 days so crucial… Liquidity Expectations are building, and Risk Assets are sniffing it early. If the Fed confirms easing again, October might close with one of the Strongest Macro Tailwinds for Crypto in 2025.
➡️ For Part #2, Re-Quote This Post With Caption: "CONVICTION BY MR P"
OCTOBER CRYPTO REPORT IS HERE - by Mr. P
This time it’s 100% FREE for all Premium fam, no paywalls. Just pure alpha from someone who actually cares about his community ❤️
Inside you’ll find:
• $BTC direction heading into Q4
• $ETH's Next Move
• US Govt Shutdown Ending
• $SPX + Altcoins Cycle View
• Big macro shifts (rate cuts, QT)
• Early hints of a wild 2026 setup
If this hits 100 reposts, I’ll leak a tiny hint from one of these sections on Monday.
You already know what happens when Mr. P hints
Where are we in Macro Cycle?
We don’t have much time before this cycle ends.
The next leg of this BULL RUN will move fast.
Releasing My Crypto Report (inside telegram) right after $SPX close. Hit that repost Button and Drop a comment if you're ready for it
It’s a bold stance, and many in retail will resonate with the idea that “the bear is here to stay”
But my bias is different.
I continue to see this dip just as a correction inside the already ongoing final run-up, not the start of a drawn-out bear.
$BTC $104,790 – $99,999 region stands as the key bottoming zone on this dip. If conditions change, I’ll adapt and inform, but this is my working map. From there, I expect the next big leg higher with $118,397 as the first major target.
And unlike the “no altseason” call, I do expect one explained in latest $ETH post on my channel.
The market will ultimately decide whose path gets validated. For now, I see patience during this correction, then continuation higher into year’s end before we switch BEARISH
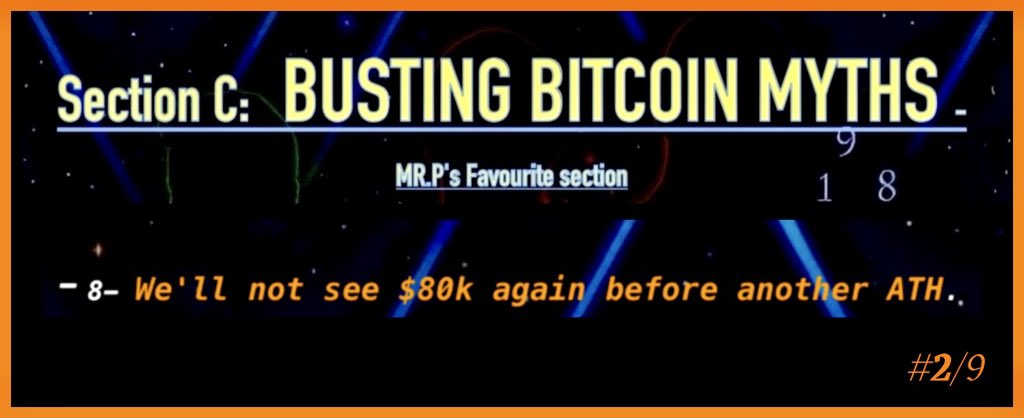
#2/9 - Myth Buster Series from My Macro Report:
❓ Myth: We’ll see $155k+ BITCOIN this cycle.
✅ Busted: “Not even 1H close above $155,000+ shall come this cycle"
Based on my 4 variables, that I already released on X. I say $BTC won't close above $155k+ for even an hourly candle. I used Gann Box, FIB Regression, 𝕸𝖗. 𝓟's Natural Cyclical Method, and did some Time Analysis in my Macro Report's part B, that is solely written on finding Bitcoin's Cycle Top (Date + Price).
🌟 The Date of next Cross: MONDAY, 15th DECEMBER when the cycle top would already be in + $BTC's Bull Run would have already ended.
I want you guys to have all the 9 Myths ASAP, that were busted inside "Myth Buster" Section almost 3 months ago. The 2-Pack Report (A & B) was aimed at Predicting $BTC Cycle ATH Date and Price.
It’s the MOST-SELLING 𝕸𝖗. 𝓟 P𝔯𝔢𝔪𝔦𝔲𝔪 Macro Report ever. I'm Humbled! And I'm now releasing some general sections to The Public.
🔄 50 Reposts, and the Next X-Creators Myth gets Busted RIGHT AWAY!
#1/9 - Myth Buster Series from My Macro Report:
❓ Myth: DoomsDay. Top is in.
✅ Busted: “We'll see ANOTHER ATH before we can even dip to $80K"
Now this was Said 2-3 Months ago, at $107K Levels when people were calling for $80K Levels. Back then I made this Statement that we will Indeed get To NEW ATH, contrary to common back then. And We did!
Now AGAIN,
I'm seeing $70K $80K Calls - and I'm sharing this as the FIRST of 9 Myths > Because it is applicable yet again. As I believe We'll see Higher Prices Q4, and cycle is not yet over. Let alone $80K. I do believe short term correction isn't over, and Perhaps I might have closed my $123k short too soon at $117k levels. Well, Let's engage in Comments if you need further help interpreting.
I plan to QUICKLY release all the 9 Myths that were busted inside "Myth Buster" Section on page 18 of my Macro Report-A published almost 3 months ago as part of 2-Pack Report (A & B) aimed at Predicting BTC Cycle ATH Date and Price.
We broke all time Sales records for ANY Mr.P Reports. I'm Humbled! And I'm now releasing some general sections to The Public.
🔄 50 Reposts, and the Next X-Creators Myth gets Busted RIGHT AWAY!
We're thrilled to announce that the @StrawberryAI_5 Kickstarter has concluded and #STRAWBERRYAI will be listed on #MEXC!
🔹Deposit: Opened
🔹STRAWBERRYAI/USDT Trading in Innovation Zone: 2024-12-02 09:00 (UTC)
Details: https://t.co/qG9v5SP6AC