Extremregen nimmt weltweit - und auch bei uns - durch die Erderwärmung durch CO2 stark zu.
Warum erkläre ich im neuen Spiegel-Kommentar. 1/2
https://t.co/bVcXbw9ZlM
@PGrasarevic@NFliess Einspruch, habe erst vor einem halben Jahr damit angefangen (dank https://t.co/ClZaKjHsbi), und überlege mir im Dez ans Konzert in Berlin zu gehen ☝️😁
(lohnt sich doch oder, auch wenn sie nicht mehr die jüngsten sind?)
@Krstorevic@KoeppelRoger im Namen (fast*) aller Schweizer:innen bitte ich vielmals um Entschuldigung, tut uns leid, dass ihr den nun auch noch ertragen müsst!
*abgesehen von den üblichen Verdächtigen natürlich..
@HyperHydr0@HayleyJFowler absolutely! also for this, a Bayesian approach might be favourable, since it incorporates an implicit weighting of parameter combinations which are more or less likely given the data.
@HyperHydr0@HayleyJFowler It‘s already challenging to get good estimates of stationary shape parameters, so this would require massive amounts of data, and would potentially make the model too flexible, such that a trend in the location parameter (where the physical link is clearer) might be masked.
@HyperHydr0@HayleyJFowler I think there are two aspects be to considered here; first, is there physical evidence that the tail should be changing in comparison to the overall distribution? And second, is there enough data to detect such a change?
@HyperHydr0 Whereas there's usually not much one can do about the block size issue, I'd advise to use Bayesian estimates instead of maximum likelhood (especially when fitting non-stationary GEVs) and avoiding normal approx. CI for high return level/period estimates. I hope that makes sense!
@HyperHydr0 Hi Chris, yes, block maxima of temperature seem to be associated with negative shape parameters. However, we found that blocks of one year are generally too short (though larger blocks are usually not feasible in obs studies) and ML shape parameter estimates to be biased low..
“The glaciers are melting, and I have more work to do,” said one Swiss cartographer. A look at the graceful craftsmanship required to map the Alps, their extraordinary beauty and degradation. https://t.co/olVWiluy30
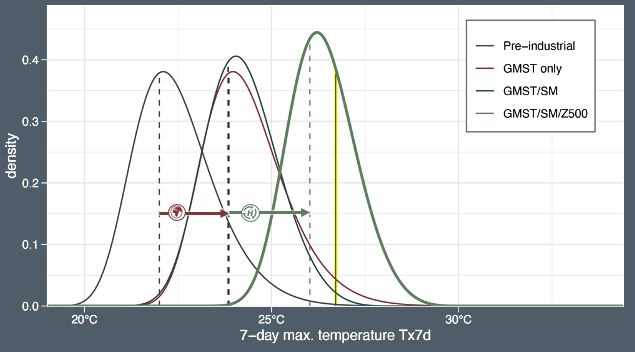
@HyperHydr0@erichfischer These numbers obviously have to be taken with a grain of salt (ESM/reanalysis comparison etc.), but the shift in distribution of expected Tx7d (5yr maxima) under the respective 2021 conditions (GMST and Z500) is roughly +1.9°C due to GMST🌡️ and +2.2°C due to circulation🔁
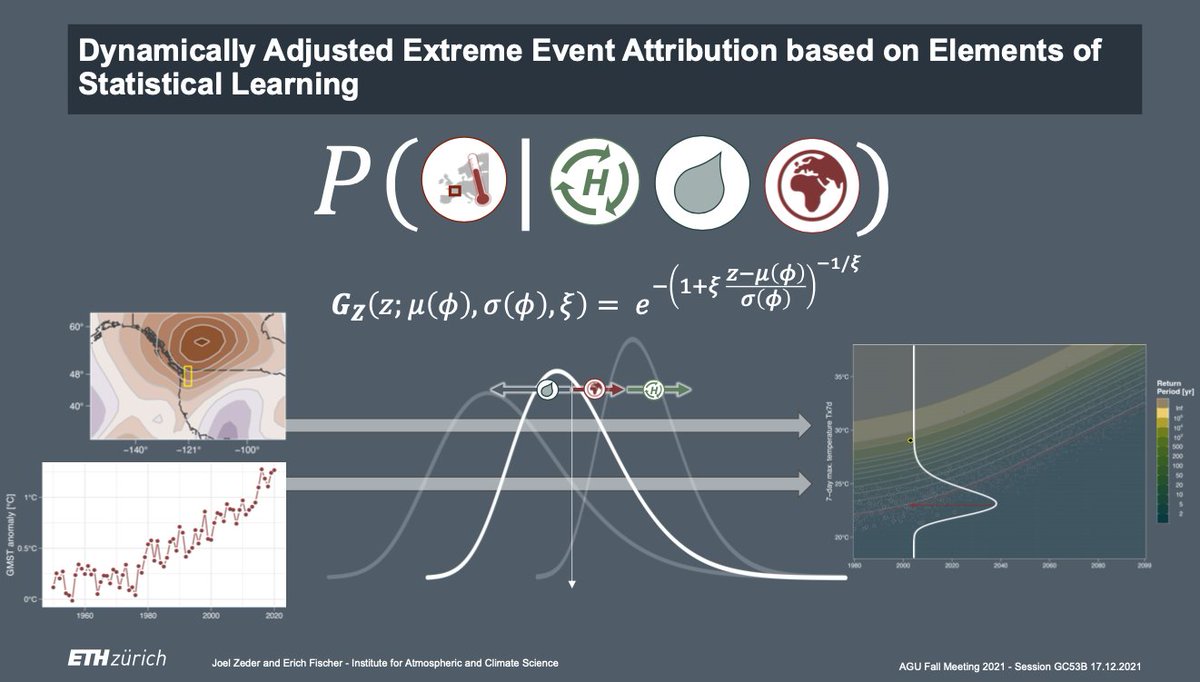
What can we learn from large climate model datasets and extreme value statistics enriched with elements of statistical learning in the context of climate extremes? 🤔🌎📈
Join our #AGU21 GC53B session on D&A of anthropogenic climate change and extreme events: 12:45CST/19:45 CET
For more information on the method (and analogue findings with respect to the 2003 heatwave in Western Europe), please check out the on-demand video: https://t.co/tBXADTFoLx
Based on work with @erichfischer, we find that
🌡️climate change explains ~40% and
🔁 atmospheric circulation explains another ~45%
of the 2021 Pacific Northwest heatwave intensity (compared to pre-industrial conditions).
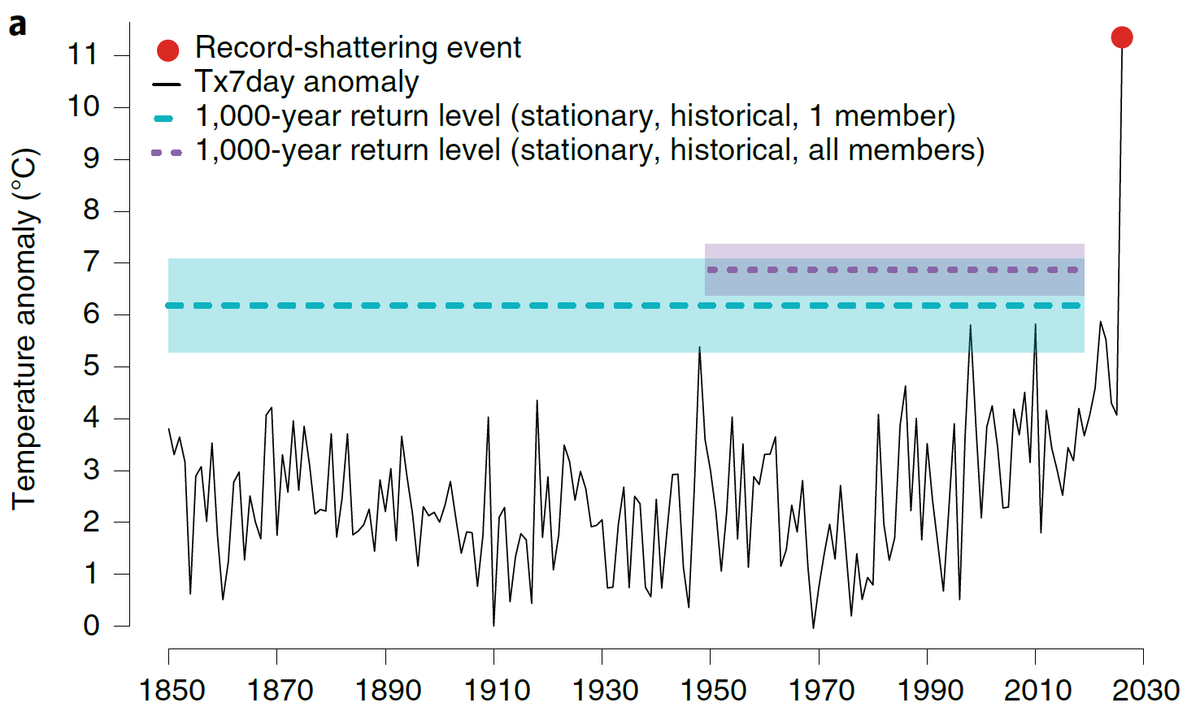
Hitzewellen in den USA und Kanada – pulverisierende Rekorde werden mit dem Klimawandel wahrscheinlicher, zeigt eine neue Studie. Artikel unserer neuen Studie mit @Knutti_ETH und
@ssippel87:
https://t.co/8oRA48b3Cp
1/n Prepare for the unthinkable.
Our new @NatureClimate study with @Knutti_ETH and @ssippel87 shows that the coming decades will bring more record heat that literally shatters existing temperature records like in the Pacific NW https://t.co/SaEwf7Fdoy
@rbock9@Knutti_ETH@Kachelmann@Axel_Bojanowski@erichfischer Das hat folgende Gründe, zum einen wurden die Niederschlagsdaten schon 2017 zusammengetragen (im Rahmen einer Masterarbeit), zum anderen waren da die Daten aus AT/CH nur bis 2013/14 verfügbar (dies ist in der Figur S1c) der Studie ersichtlich).