How much would U.S. IPOs have to raise this year to rival 1999?
Nearly $350 billion, once you account for how much the stock market has grown.
Led by SpaceX, U.S. IPOs had raised a record $149 billion through November 9, excluding SPACs. I get why that brings back memories of the dot-com boom. But investors absorbed the 1999 IPO wave in a stock market roughly one-fifth the size of today’s.
As a share of the market’s starting value, IPO proceeds were 0.5% in all of 1999 and 0.22% so far this year.
Anthropic is now targeting about $90 billion across its IPO and a private placement. Even if you counted every dollar of that deal, we’d still need more than $100 billion in additional IPOs this year to match 1999’s share of the market.
Looks like we can add a seventh month to the chart. Hourly pay rose 3.1% from a year ago, while prices rose an estimated 4.0%.
Consumers are still feeling the squeeze. For some households, keeping up their spending may mean dipping into savings or drawing on investments to cover the gap.
With the election behind us, affordability is still front and center.
Wage growth is one of the first numbers I’ll check in tomorrow’s jobs report. Annual growth in average hourly pay has trailed inflation for six consecutive months.
Next Tuesday’s CPI report will let us compare October’s wage growth and price gains. The annual comparison will require an estimate because last year’s shutdown left a gap in October’s inflation data.
Together, the reports will show whether hourly pay gained any purchasing power in October.
Building on my last post, I joined @MikeTownsendCS and @sam_vadas on @SchwabNetwork to walk through the the recent economic data, the Nasdaq-100 correction, and analysts 12-month earnings estimates.
The question I keep coming back to comes after that window: if a project opens a year late, which assets will cover the withdrawals a client has already planned?
#SchwabNetwork #Investing #WealthManagement
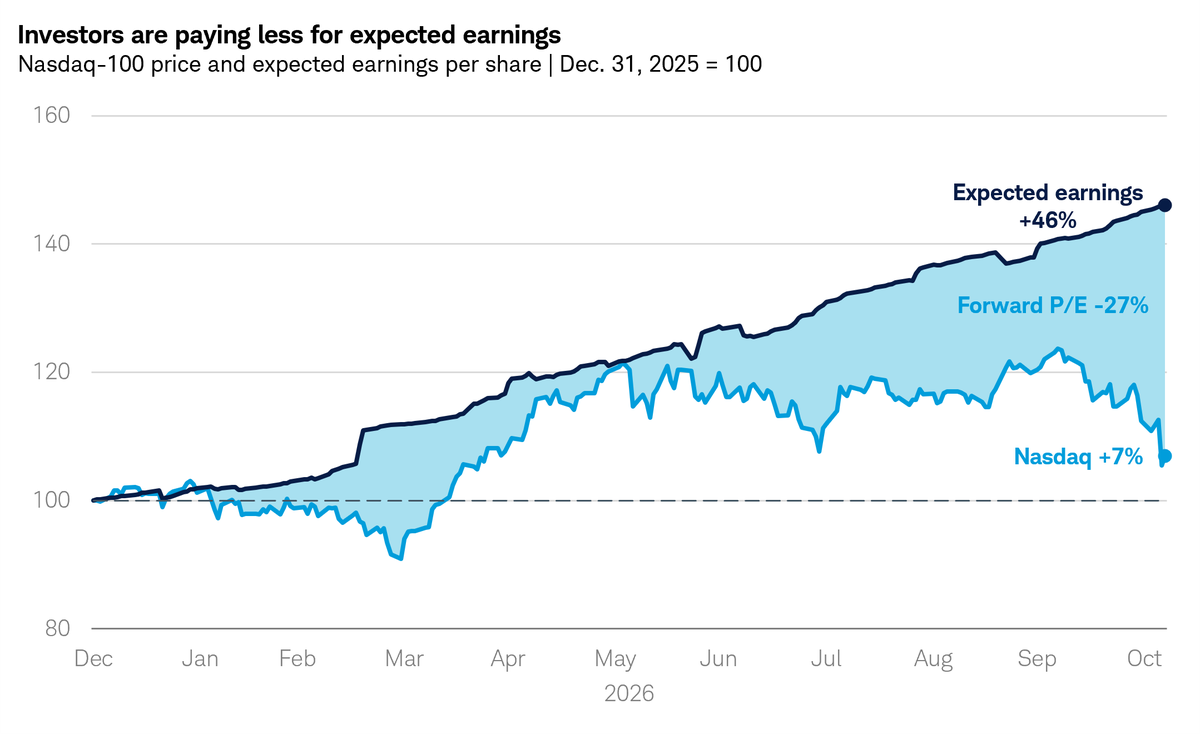
One habit I picked up managing bonds was to look for the date attached to a payment before deciding what it was worth. I found myself looking at dates again last week as the Nasdaq-100 entered a correction alongside encouraging news about the recent past. Employers added 165,000 jobs in October, and output per hour worked rose at a 3.6% annualized rate in the third quarter. Both reports told us how the economy was doing heading into the sell-off.
The earnings line on this week's chart gives us one view of the future. It shows what analysts expect Nasdaq-100 companies to earn over the next 12 months, and that estimate kept climbing as stocks fell. By November 6, forward earnings per share were up 46% from year-end, while the index itself had gained 7%. With earnings estimates rising faster than prices, investors were paying about 27% less for each dollar of expected earnings.
One reason investors might pay less is that they expect analysts to cut those estimates. But even if analysts get the next 12 months right to the penny, investors still have to value the cash those businesses could generate in the years that follow. For that earnings forecast, "beyond" begins in month 13. A project can meet demand and still earn less if it costs more or opens later.
Consider a data center with customers lined up and an opening date two years away. Tighter local rules could shift the project to a costlier site and push the opening back a year. Since both opening dates fall outside the forecast window, next year's earnings estimate could hold. The facility still gets built, but I'd pay less for the project today because the owner has to put up more money and wait longer for the first customer payment.
In a portfolio review, I'd look for that opening date in more than one holding. A chip supplier may be counting on equipment orders while a utility adds capacity for the same site. That leaves two businesses in different sectors exposed to the same construction schedule. The client's retirement date may be firmer than either company's forecast. If those businesses need another year, which assets will fund the withdrawals the client has already planned?
Stocks can fall even when earnings are rising.
This year’s market gains have been driven by stronger profits, while investors have paid less for each dollar of earnings. That puts more pressure on companies to keep delivering, particularly as energy costs threaten margins.
In my latest 2 Minutes on the Markets, I cover that earnings backdrop, the improved starting point for bonds, and how both shape our portfolio views.
What we know, what we favor, and what could change our minds.
https://t.co/6D7a5IEQcJ
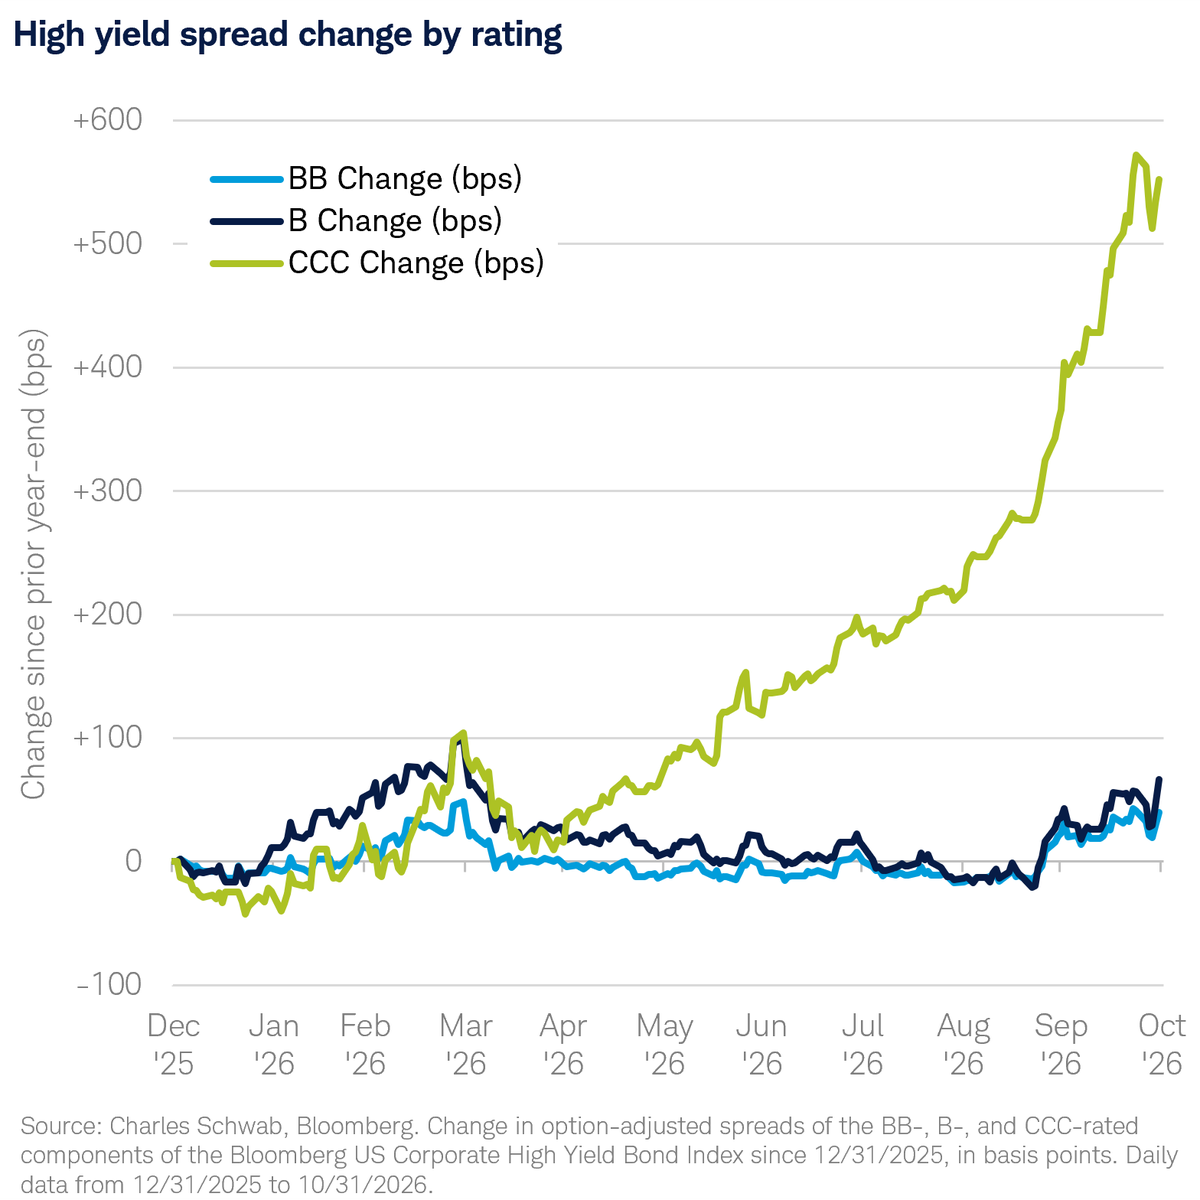
The midterms have the headlines. A widening gap in the bond market has my attention, too.
Spreads on CCC-rated bonds, among the lowest-rated corporate debt, have widened sharply as higher refinancing costs weigh on heavily indebted companies. Higher-rated BB and B bonds have seen much smaller moves.
So far, that points to stress concentrated among the weakest borrowers. Strong earnings and generally healthy balance sheets are helping the broader credit market hold up.
The next test is whether that pressure stays concentrated or begins to spread.
For more of our views across asset classes, check out the latest Schwab Market Insights.
https://t.co/7gxBBhF1DE
Has this year felt like a roller coaster?
The S&P 500 has returned about 11% year to date. A fairly ordinary gain by historical standards.
Yet leadership has swung sharply as investors work out where value will be generated next in this AI cycle.
Investors are weighing what AI could deliver against what it will cost to get there. They can remain in the market while reconsidering where they want to be invested.
I expect more of these swings. I’m watching how they change what’s driving portfolio returns, particularly how much depends on the largest companies.
Some of us will welcome this week's election results. Others will be deeply concerned. Elections have real consequences for our lives and finances. Decisions about taxes, spending and regulation can affect families and businesses.
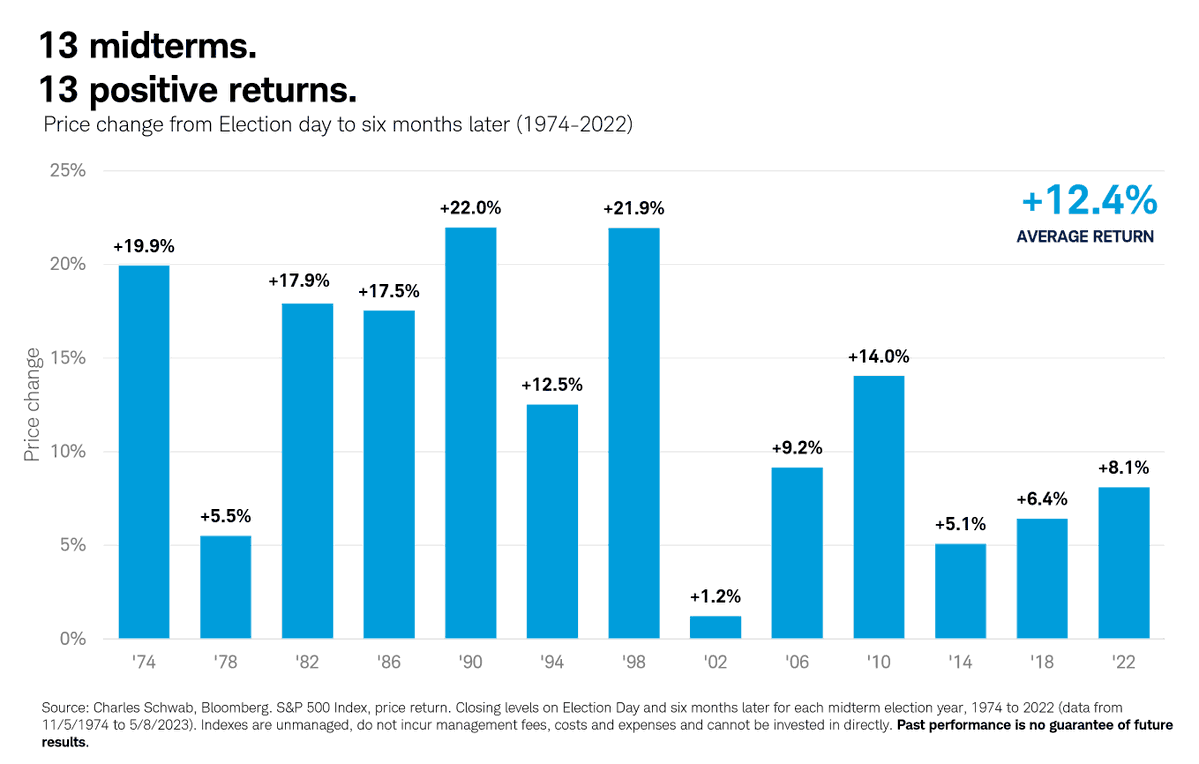
But here is a fact worth remembering: Since 1974, the S&P 500 has been higher six months after every midterm election. All 13. The average gain was 12.4%, excluding dividends.
That record includes victories for both parties. Investors did not need their preferred party to win for stocks to rise.
As our own Schwab Washington expert Mike Townsend puts it: "Markets don't care who wins the election, markets care that the election is over."
To me, the benefit is greater clarity. A settled result gives investors one less unknown as they assess what comes next for corporate earnings, inflation and economic growth. Policy remains part of that outlook, but investors can evaluate what the results mean rather than speculate about who might win.
Election night cannot tell us how much companies will earn next year or where interest rates will go. Those questions will continue to shape returns long after the votes are counted.
There is no guarantee this pattern continues, and a positive six-month return does not mean a smooth ride along the way. Still, the record offers some perspective when an election outcome feels discouraging.
As advisors, our responsibility includes helping our clients connect the headlines to their own circumstances. Their goals, spending needs and ability to withstand losses remain the starting point for investment decisions. If policy changes affect their finances, we should address them. An election result alone, however, does not tell us whether their portfolios need to change.
Our clients can be disappointed in the election and still make progress toward their financial goals.
What does $105 oil have to do with your technology stocks?
U.S. oil prices rose more than 2% today as stocks fell 2%. Their three-month correlation with the S&P 500 is roughly −0.5.
Higher oil prices leave households with less to spend elsewhere and raise costs for businesses. They can also keep inflation elevated and raise expectations for further rate hikes.
Companies building AI capacity are spending heavily, often years before they expect those investments to pay off. If financing stays expensive, projects need to earn more to justify their cost. Investors may also pay less today for those future profits.
There are plenty of company-specific questions to answer, and the correlation doesn’t establish what caused the selling.
I’m watching oil because the cost of financing that buildout can change even when demand for AI remains strong.
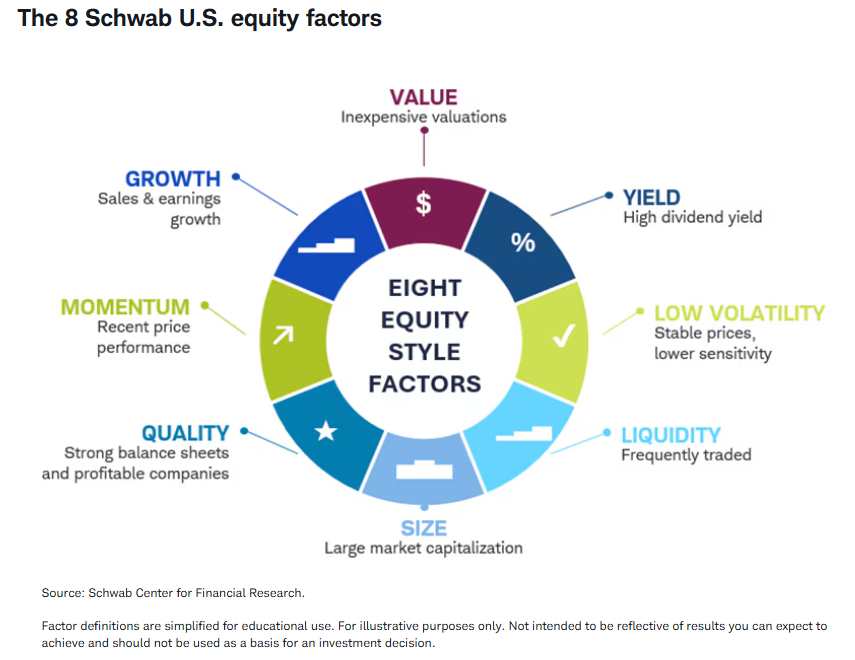
A guide to U.S. equity factors: Learn how U.S. equity factors are built, what drives performance, and how investors can use them to assess markets, portfolios, and investment strategies.
In this article, we discuss a new framework that tracks eight U.S. factors: Growth, Liquidity, Volatility, Momentum, Quality, Size, Value, and Yield.
📰 https://t.co/6OLe9U23wL
Walt Bettinger, Schwab’s former CEO and now Co-Chair of the board, had a reminder I always liked: “Disagree without being disagreeable.”
Today’s market brings it to mind. Alphabet, one of the S&P 500’s largest companies, fell more than 12% amid questions about its AI spending. Yet the index was down just 0.5%, with nearly four out of five stocks higher.
Big names make big headlines. They don’t tell the whole portfolio story.
Treasuries offered another example. Their prices rose as yields fell, providing some balance while the major stock indexes declined. That’s one reason we own different asset classes in the first place.
Investors have plenty to debate about who spends too much and who ultimately benefits from AI. A diversified portfolio has room for different outcomes.
We don’t need every holding moving in the same direction. Sometimes, a little disagreement makes the overall experience more agreeable.
You can be comfortable taking a risk you can't afford.
Risk capacity is math: what your finances can withstand. Risk tolerance is behavioral: what you're willing to live with. Those two don't always line up.
I joined Mark Riepe on Schwab's Financial Decoder to talk about the risk you're comfortable taking, the risk you can afford to take, and why "playing it safe" comes with trade-offs of its own.
If you've ever wondered whether you're taking too much risk, or too little, this one's worth a listen.
https://t.co/eaM6GayUFW
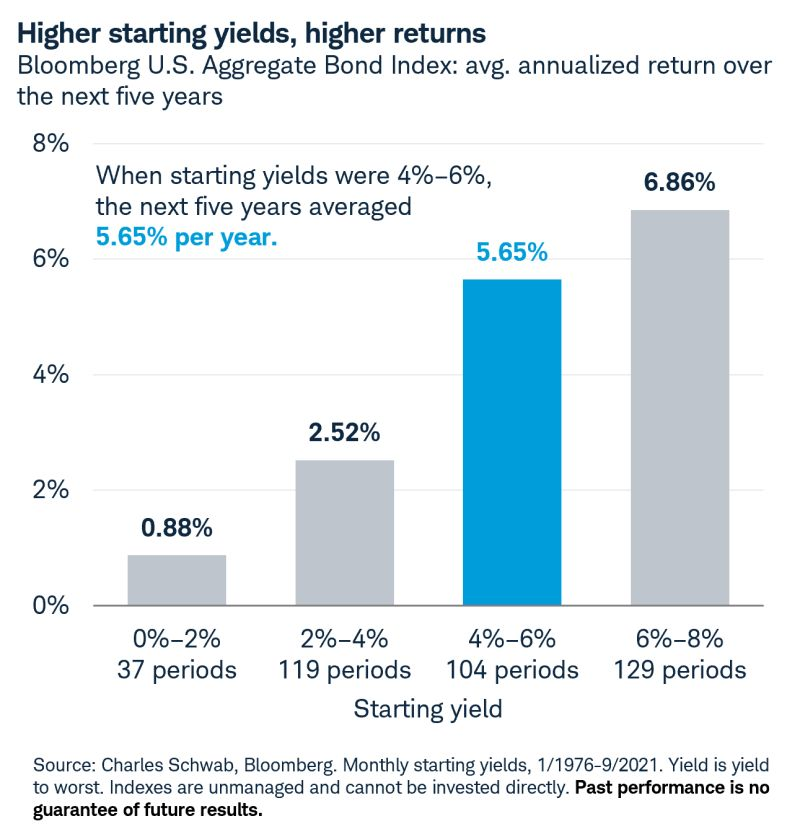
For years, investors complained that bonds didn't pay enough. Now yields are higher, and many are wondering whether bonds are worth owning.
Tough crowd.
The hesitation is understandable. Recent returns have disappointed, federal debt is unsettling, and yields could rise further. But the rise in yields that hurt bond prices has left investors with a better starting point, something that can be easy to miss when we're looking at a fund's trailing returns.
As the chart shows, starting yield has historically been a strong guide to returns from high-quality bonds. For the U.S. Aggregate Bond Index, starting yield and annualized returns over the following five years have had a 94% correlation. That's why yield is one of the first numbers I look at when considering return expectations.
Higher starting yields give investors more income to help offset losses if bond prices fall again. If yields stay where they are, investors still collect that income. A positive return doesn't require yields to fall.
An attractive yield also doesn’t settle the debt debate. Concerns about federal borrowing and inflation should inform how much interest-rate risk we take and what we expect to earn after inflation.
For advisors, I'd bring the conversation back to what the client needs this money to earn and when they'll need to spend it. Then weigh the yield available against the price swings they could face along the way.
Clients don't have to feel good about the federal budget to have a thoughtful conversation about their own.
I was recently asked, “How do I help a client trim a position they’ve become overly attached to?” My instinct is to reach for the numbers. I suspect I’m in good company, given our choice of profession.
Hendrik Bessembinder studied individual companies over calendar decades from 1950 through 2019. Among the 100 biggest wealth-creation outcomes, the average worst decline during those winning decades was 32.5%.
Those were the success stories.
Even a client who picks one of the great winners must be able to afford the bad stretches. Think about driving a car with four tires. If one blows out, you’re in for a rough ride. The other three don’t make the problem disappear. An oversized holding can do much the same to a portfolio.
Some clients will respond to the numbers. Others already understand the risk and still find it hard to sell.
For someone whose investment helped build their wealth, a recommendation to trim can feel like questioning the decision that got them here. An advisor might ask, “What would we need to set aside so you could keep owning the rest through a decline like that?”
Perhaps some of the proceeds, after taxes, could fund a child's education or the first few years of retirement. The client keeps an investment they believe in, with less pressure to sell it to meet spending needs during a downturn.
The stock may keep climbing after a trim. Our responsibility is to help clients weigh the gains they could miss against what the proceeds would allow them to do.
You can be right about the company and still have too much riding on it.
I joined @MikeTownsendCS on WashingtonWise to discuss the midterms, the policy debates ahead, and what they could mean for your portfolio. From federal debt to the AI buildout, we covered plenty of ground.
Thanks for having me, Mike!
On the new episode of my WashingtonWise podcast, @KaseyMcCurdy joins me for a great discussion about what may impact the markets after the midterms. We talk debt, interest rates, health care, data centers, tariffs, crypto and more. Check it out! https://t.co/01EORrQrGW
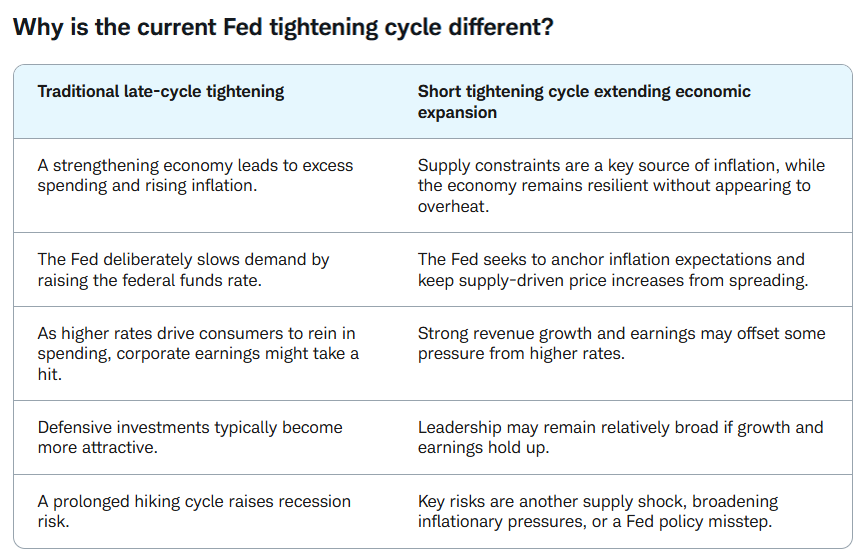
Higher rates can have very different consequences depending on what’s driving the Fed.
Our latest research examines the distinction between supply-driven inflation and an overheating economy, and what that could mean for stocks, bonds and the expansion. It also lays out alternative scenarios and the risks that could change our outlook.
Proud of the collaboration behind this piece, which brought together key leads across our research team.
Check it out here: https://t.co/z7B5kwonRJ