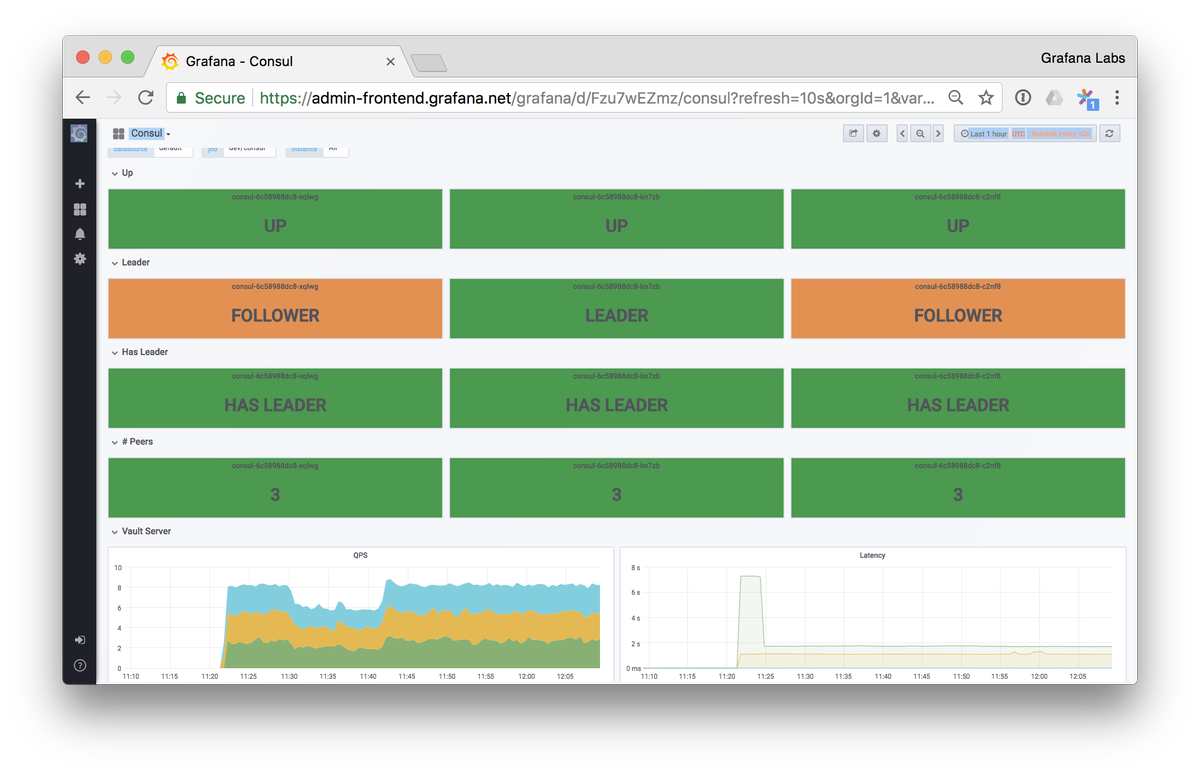
This time I'm publishing a monitoring mixin for @HashiCorp Consul: https://t.co/35sggooxBy; combining @PrometheusIO alerts and @Grafana dashboards in an extensible and reusable package, all powered by Jsonnet.
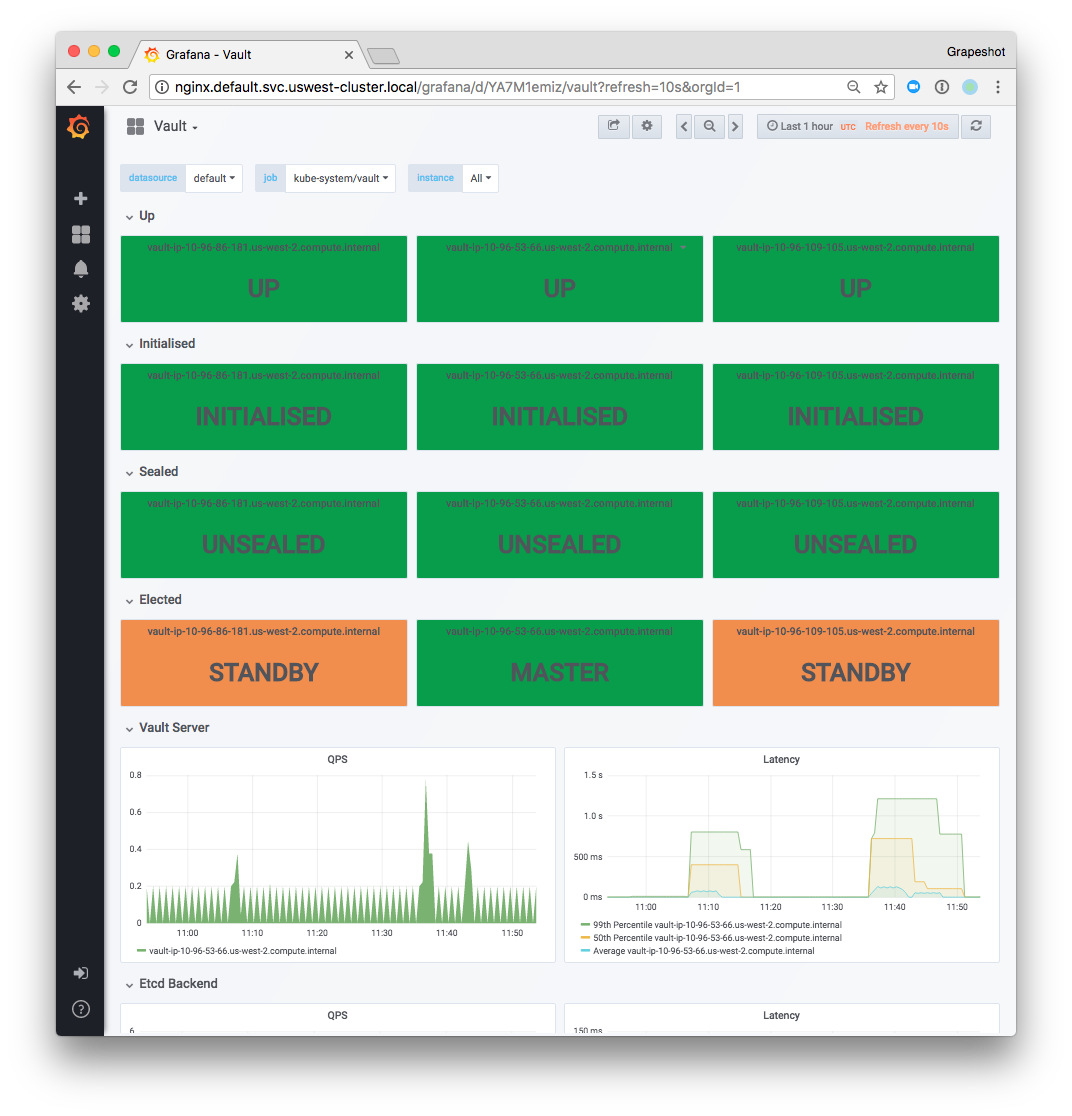
Today I published a monitoring mixin for @HashiCorp Vault: https://t.co/VHc48QzIaC; combining @PrometheusIO alerts and @Grafana dashboards in an extensible and reusable package, all powered by Jsonnet. Shoutout to @Grapeshot_ for sponsoring the work!
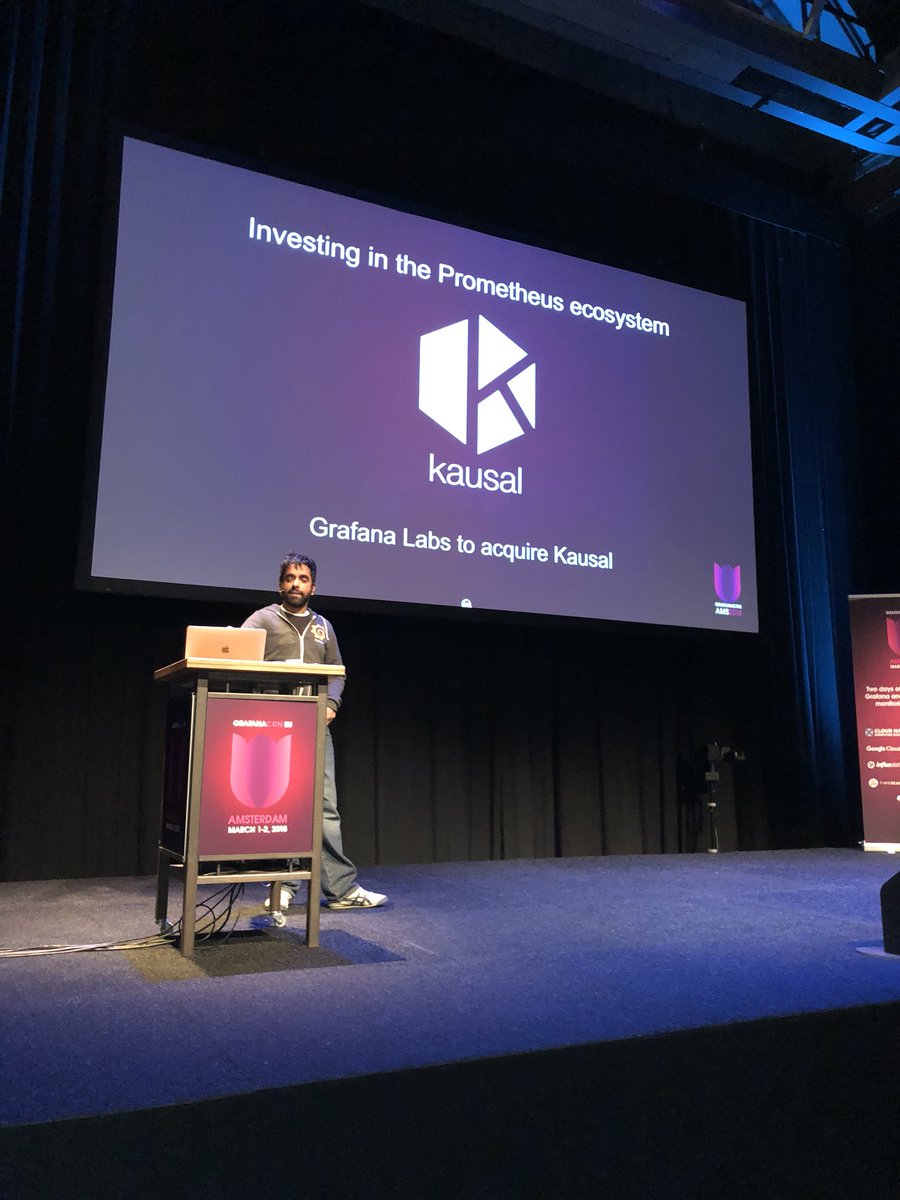
Videos are up from #GrafanaCon are up now, and there are 3 with me in it! TSDB Panel: https://t.co/TGtdFkWty7 RED Method: https://t.co/fvi0WRljdX @KausalCo acquisition: https://t.co/lxrmbOQur5
Grafana 5.0.2 is now available w/ improvements to dashboard browsing, alerting, teams & more! Download & check out the release notes: https://t.co/zCp5AjJA2q
Our team is excited to announce @flatcar_linux, a commercially supported fork of Container Linux. See the announcement for more info: https://t.co/xVrtlaDR98
Grafana v5.0 Stable Released & Announced at #GrafanaCon! New Dashboard Grid Engine, Foundational UX Updates, Dashboard Folders, Teams, Permissions and Provisioning! https://t.co/YGlh868K9I
@kinvolkio@KausalCo@discordianfish@LatencyAt Slides from my talk where we built a Prometheus Monitoring Mixin to monitor Consul with operational knowledge from the audience (I included the result!): https://t.co/wo8PXvh9sE