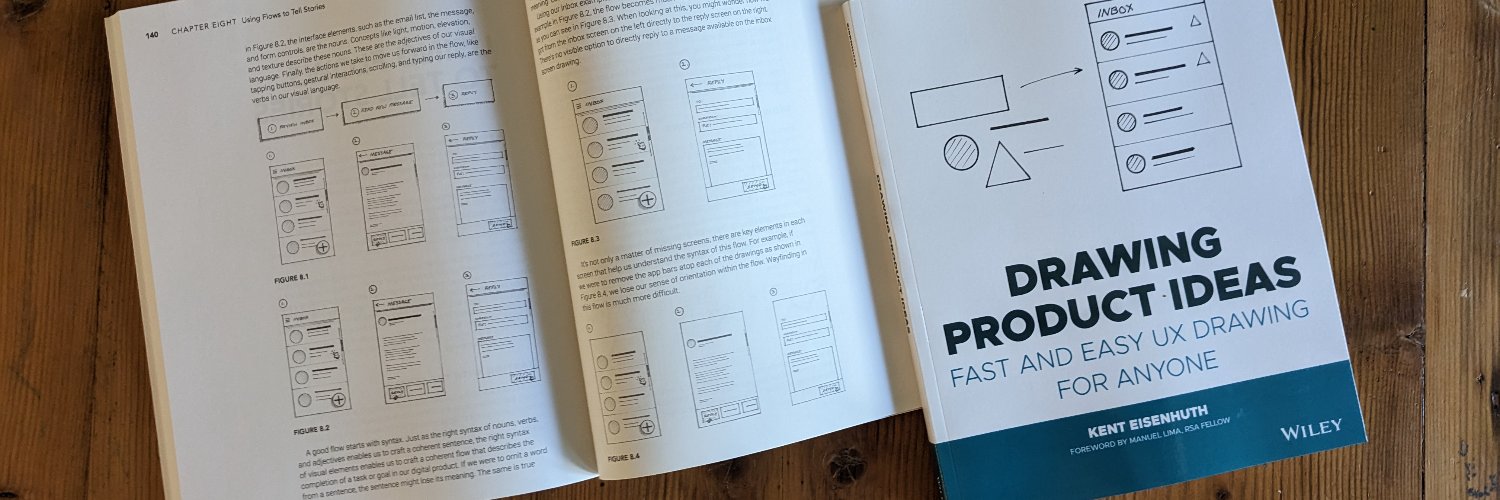
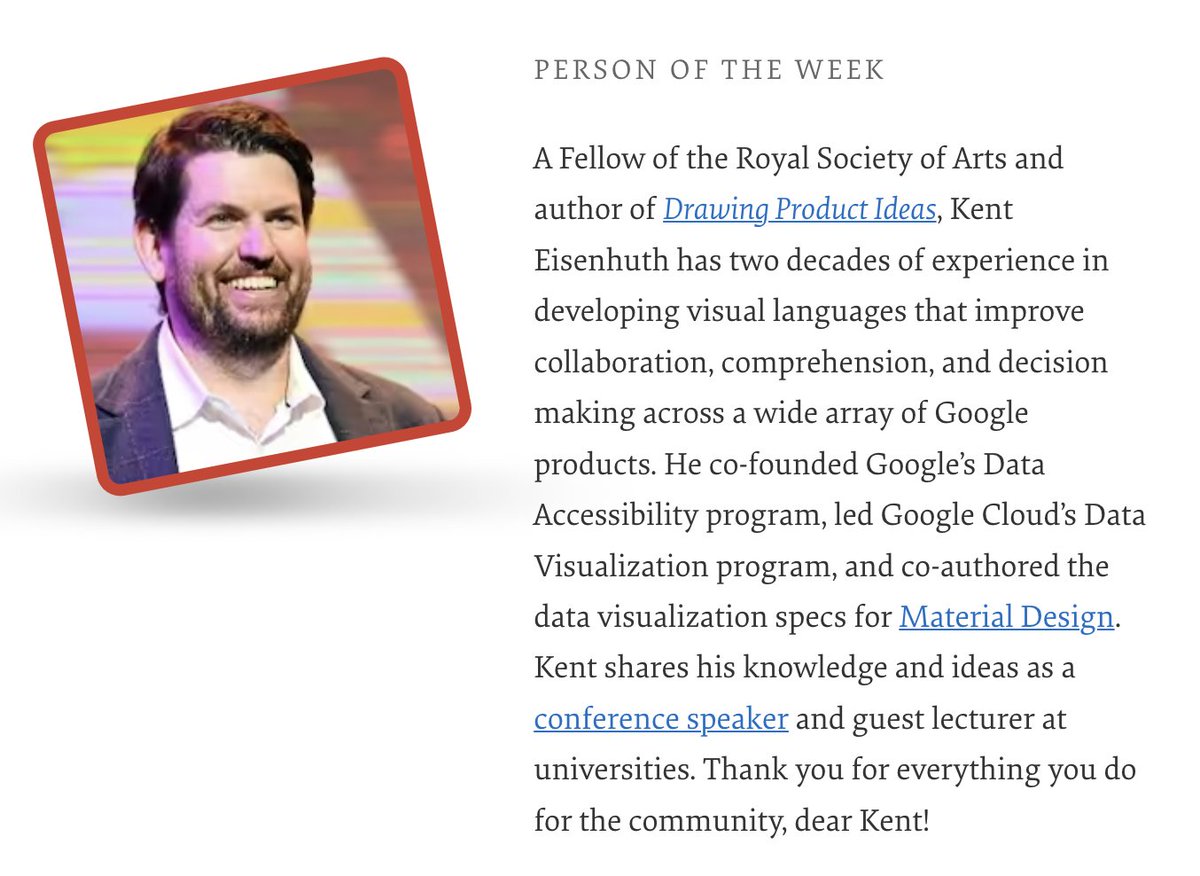
Our Person of the Week is a Datavis Lead at Google, passionate about visual languages, design systems, and data accessibility. Please give a warm round of applause for... Kent Eisenhuth!
Thank you for everything you do for the community, dear @KentTheHuth!
#smashingcommunity
Our Person of the Week is a Datavis Lead at Google, passionate about visual languages, design systems, and data accessibility. Please give a warm round of applause for... Kent Eisenhuth!
Thank you for everything you do for the community, dear @KentTheHuth!
#smashingcommunity
I had a blast sharing a talk on the importance of #datavisualization and #accessibility to a hall full of design, computer science, business and psychology students at @BrownUniversity today. I especially enjoyed the discussion at the end. The students' energy was incredible!
@FrankElavsky Thanks for the shout-out and kind feedback @FrankElavsky. This is one of my favorite examples. This approach to interaction states has tested well on an array of visualization types too. Excited to share more in the future too.
And some useful resources on accessible data visualization:
✢ An intro to designing accessible data visualizations - @sarahfossheim
https://t.co/WPULkFkC0q
✢ Which fonts to use for your charts and tables - @lisacmuth
https://t.co/XKVBrzPWZz
✢ What to consider when using text in data visualizations- @lisacmuth
https://t.co/QgcBtblcXO
✢ An Accessibility-First Approach To Chart Visual Design - @KentTheHuth and @syntagmatic
https://t.co/NEYysZEVtC
✢ How to choose an interpolation for your color scale -@lisacmuth
https://t.co/tq0qMr97uV
Join me for a @RethinkTalks workshop on all things #Datavis. This includes an intro to human perception, chart usage, designing dashboards, datavis in the age of #AI and #accessibility.
https://t.co/OeWk7u2oIH
In honor of #GAAD2023, here are some accessible datavis resources created by my colleagues and I:
Material Design's Top Tips For Data Accessibility https://t.co/KeHzSsCK5A
An Accessibility-First Approach to Chart Visual Design (@smashingmag Case Study)
https://t.co/EGu3plJ0fG
It's Data Accessibility, Not Data Visualization. (ISVIS 2022)
https://t.co/ev34SLePX0