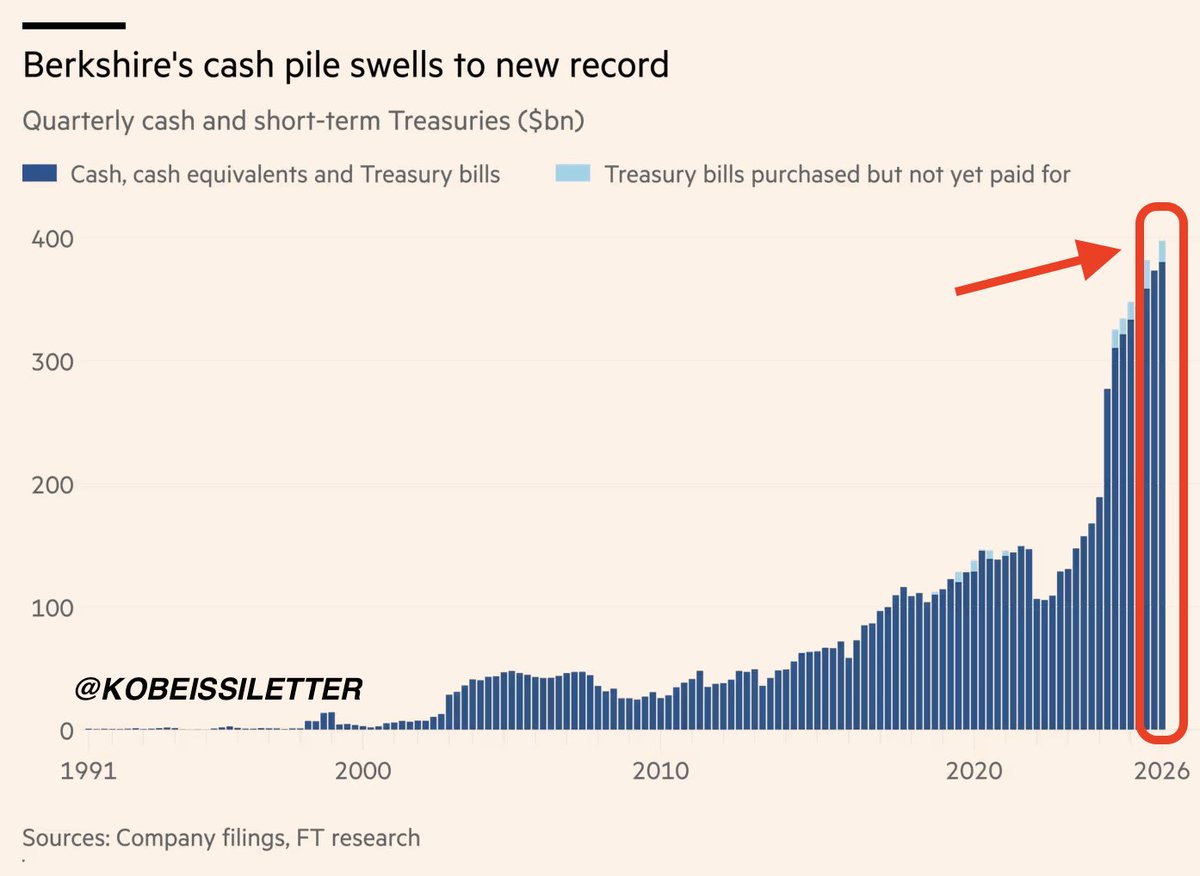
BREAKING: Berkshire Hathaway announces its cash balance is now up to a record $397 billion.
The company sold a net -$8.1 billion worth of stocks last quarter, marking its 14th-consecutive net quarterly sale.
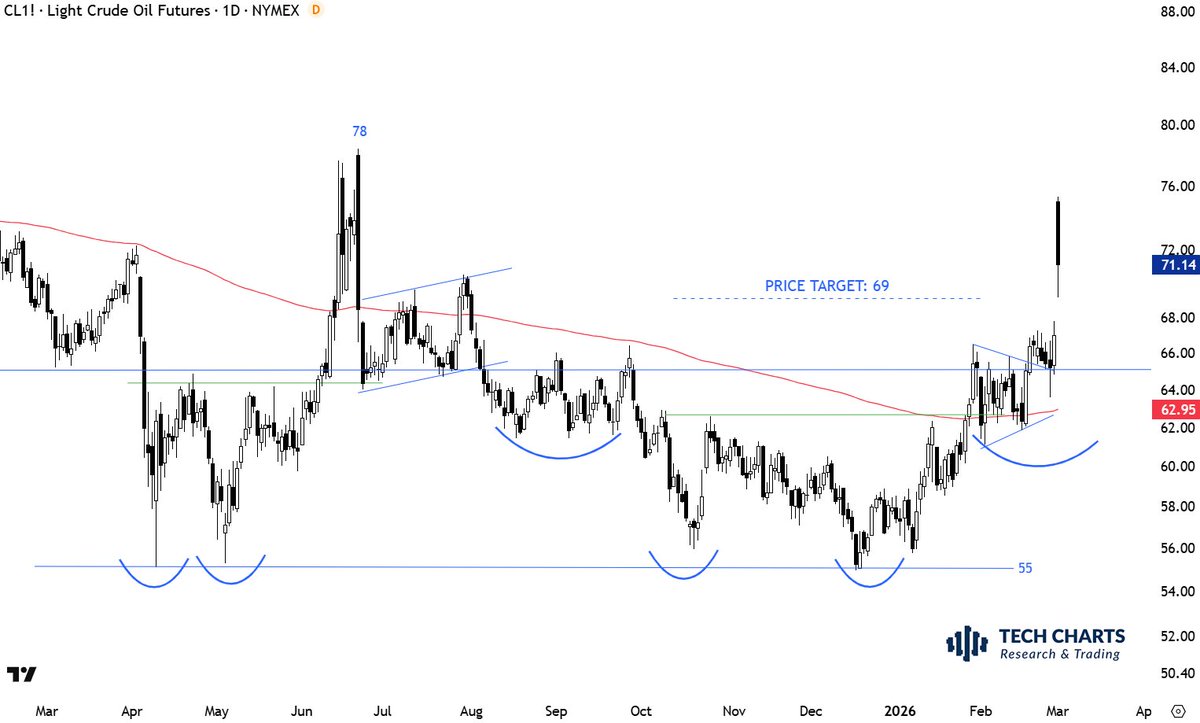
Now you see the importance. I guess nobody thinks the decision to strike Iran happened overnight... The bottom formed in December-January.
You can only see insider's movements through price action (or by being with the insiders).
I'm with the price action. Seeing it through price action requires objective/unbiased analysis of the chart.
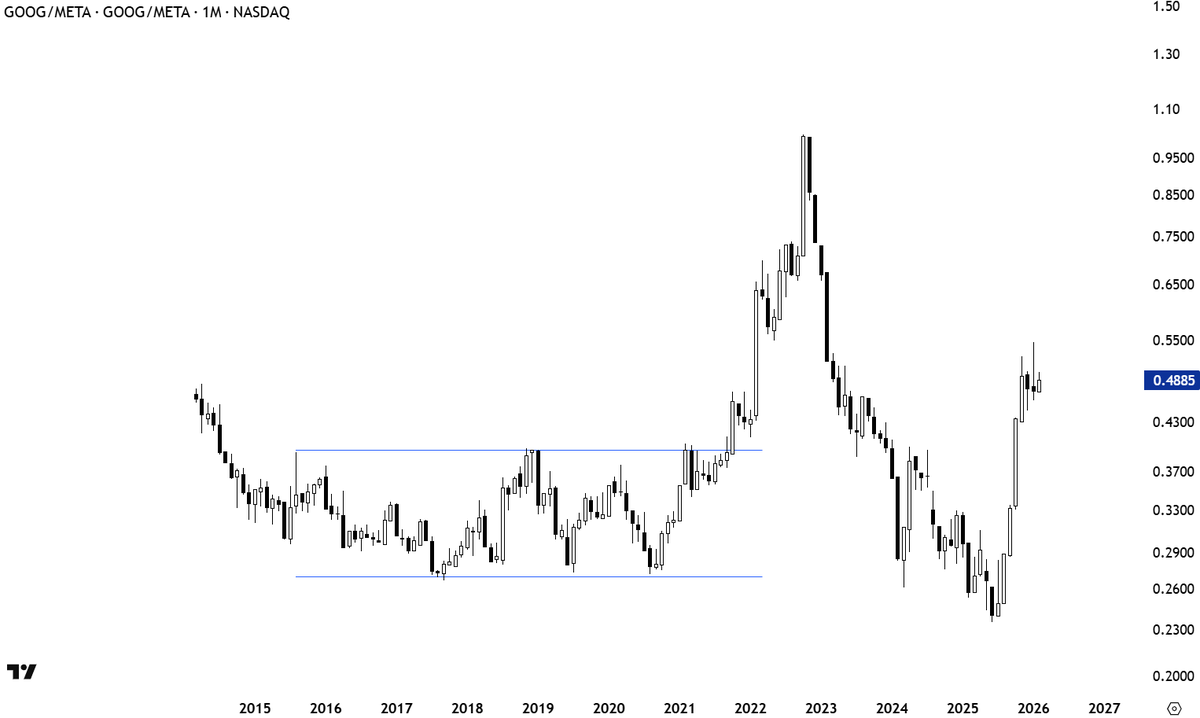
$GOOG vs. $META similar to price charts, patterns do not always/frequently present themselves as opportunities. They are rare. But needs constant monitoring. Because when the setup presents itself, you need to be on top of it to act.
Was that a flat range breakout?
$SDR got acquired.
This might look like an analysis in hindsight.
BUT it is NOT.
This chart was part of our breakout alerts due to its symmetrical triangle chart pattern development and breakout.
Do you see how that tight consolidation acted as a launching pattern?
Do you realize that symmetrical triangle was the area where "some" had access to inside information and accumulated the stock?
As I always say, charts and price action is as close as you will get to inside information without realizing.
To add on, the quickest and simplest way I've found to determine the market environment can be quantified by looking at the EMAs.
whether the major indexes are trading above, below, or chopping around the 9/21 + 50 EMA.
because these three moving averages give me everything I need to know about short-term momentum, intermediate structure, and the bigger trend without overcomplicating the analysis.
A "risk-on" environment can be defined when the indexes are trading above all three moving averages.
with the EMAs stacked in proper order (9 above 21, 21 above 50) and price is making higher lows while respecting those levels as support.
...which tells me that buyers are in control, institutional money is defending the trend, and I can afford to be more aggressive with my position sizing and give my trades more room to work.
A "risk-off" environment shows up as choppy behavior around the moving averages.
This is where price is constantly whipping above and below the 9 and 21 without any clear direction.
or it's currently in distribution or weakness when price is trading below the 9 and 21 EMAs and showing lower highs and lower lows.
which tells me that sellers are in control and I need to be defensive, size smaller, and potentially step back entirely until the environment stabilizes.
The 9 and 21 EMAs are what I use for short-term trend and momentum.
The 50 EMA is my last line in the sand... if price breaks below the 50 with velocity and volume, that's a major structure change and I'm not interested in playing offense until I see a reclaim and stabilization above that level.
What I'm really looking at is the behavior around these EMAs.
not just whether price is above or below them in a static sense, because the psychology of how price interacts with these levels tells me everything I need to know about whether the market is in a phase where directional swing trading makes sense or whether it's a phase where I should be sitting on my hands.
I can easily look at a chart of $SPY, $QQQ, or any individual name and, within seconds, tell you if it's in a clear "risk-on" or "risk-off" environment.
This is all based on how it's behaving around these moving averages, and this goes for all my analysis.
...whether I'm looking at the overall indexes to gauge market health or individual names to determine if they're worth trading.
Also, an important note is that in choppy markets where moving averages are no longer working as support and price is just whipping through them without respect, I become much more conservative on entries and wait for cleaner confirmation.
but when everything is bouncing cleanly off support and respecting those moving averages consistently, that's when I lean in and become more aggressive because the environment is telling me that the odds are in my favor!!
"The Cycle of Price Action" by @OliverKell_ is a great representation of how to use EMAs in different environments and understand the transitions between accumulation, markup, distribution, and markdown, and a big part of my approach has come from studying Oliver's material and then catering it to my own personal characteristics and tendencies.
Right now, @investingluc pointed out, $SPY has been sitting in a $20 range for almost three months chopping around its moving averages.
and $QQQ has been similarly messy, and $BTC has been in a strong downtrend, which tells me that breakouts can be unreliable until $SPY picks a true direction.
I believe speculative assets should be "risk-off" for now until proper basing occurs, and it's a stock picker's market where ideas should be rooted in only the strongest themes with the clearest relative strength.
I'm not super comfortable trading directional strategies in "non-directional" choppy markets, so I make sure the current environment is conducive to swing trading before committing to FULL size positions.
because fighting the environment is a losing battle, no matter how good your individual setups look on paper!!
This is something I'm actively thinking through over the next few week/months.
I'd recommend giving my friend @investingluc a follow. He provides true value, and I always find myself constantly reviewing his work every week!
So you want to learn the proper ways to analyze charts?
Forget the modern books
Go back to the originals on classical charting to find out the rules on how charts should be interpreted
Schabacker's 1934 book - in hard cover
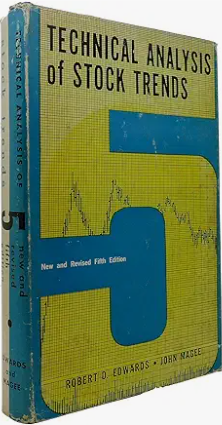
And Edwards & Magee (1948) - 6th edition OR OLDER ONLY. All editions newer than the 6th edition have been altered. The newer editions are simply spoofs - they have been altered irreparably
Order Schabacker here
https://t.co/GhY4hLGmrI
A big part of my system revolves around riding the wave after Stage 2 breakouts, so below I've explained exactly what I look for.
I'm not trying to catch the exact bottom or predict when a stock is going to explode.
I'm positioning myself in trend when structure, volume, and momentum all align, and that alignment happens during the transition from Stage 1 to Stage 2, which is when stocks move from accumulation into markup.
This is the phase where institutions start stepping in with size, volume increases meaningfully, and the character of the chart changes from sideways frustration to something that looks like linearity and strength.
I've spent years studying these transitions, and what I've learned is that if you can recognize the behavioral patterns that show up over and over again during this phase, you can put yourself in position to catch some of the biggest moves in the market without having to predict anything or get cute trying to pick bottoms.
The first thing I look at is the EMAs:
...specifically the 9/21/50 exponential moving averages, because they're the backbone of my system and they tell me everything I need to know about trend and momentum in real time.
The 9day tells me short-term momentum and whether buyers are still in control on a "day to day" basis.
The 21day defines structure and shows me whether the trend is orderly or erratic
and lastly the 50day confirms the bigger trend and tells me whether institutions are defending the move when the stock pulls back.
When all three of these EMAs align and start rising together, when price is holding above them and they're stacked in the proper order with the 9 above the 21 and the 21 above the 50, that's when I want exposure because the stock is showing me that it has both momentum and structure working in its favor.
I say it every single day, but it's worth repeating:
it's not about predicting what's going to happen next, it's about reacting to the evidence of strength that's showing up in real time, and the EMAs give me that evidence in the cleanest, most objective way possible.
The second thing I need to see is volume confirmation.
...because price without volume means absolutely nothing to me and I've learned the hard way that chasing breakouts without institutional sponsorship is a recipe for getting chopped up.
What I'm looking for are accumulation bars, which are high volume up days followed by low volume pullbacks, because that pattern tells me that institutions are quietly building positions and absorbing supply without pushing the stock too hard too fast.
You don't need to know which funds are buying or what their thesis is... the chart shows you through repeated volume surges on strength, and that's the footprint of institutional accumulation.
That's why I don't chase random breakouts just because a stock is moving, because I want to see the footprints first, I want to see the evidence that BIG DADDY money is involved (lol), and I want to see that the stock can digest gains on light volume before it makes the next push higher.
Volume is the fuel that powers the move, and without it, I'm just trading random charts that look "decent."
The third thing I look for is big bases.
because the bigger the base, the higher in space, and that's not just a catchy phrase my people... it's a proven pattern that shows up over and over again in the biggest winners.
Mult month or even multi year bases show long periods of accumulation, compression, and emotional reset, where weak hands get shaken out, institutions build positions, and the stock builds the energy it needs for the next major leg higher.
When these structures break with volume and momentum, the moves can be explosive because it's not just a breakout... it's months or years of "pent up" demand being released at once, and the stocks that come out of these bases with the right characteristics are often the ones that lead the market for the next cycle.
I'm specifically watching four names as candidates right now:
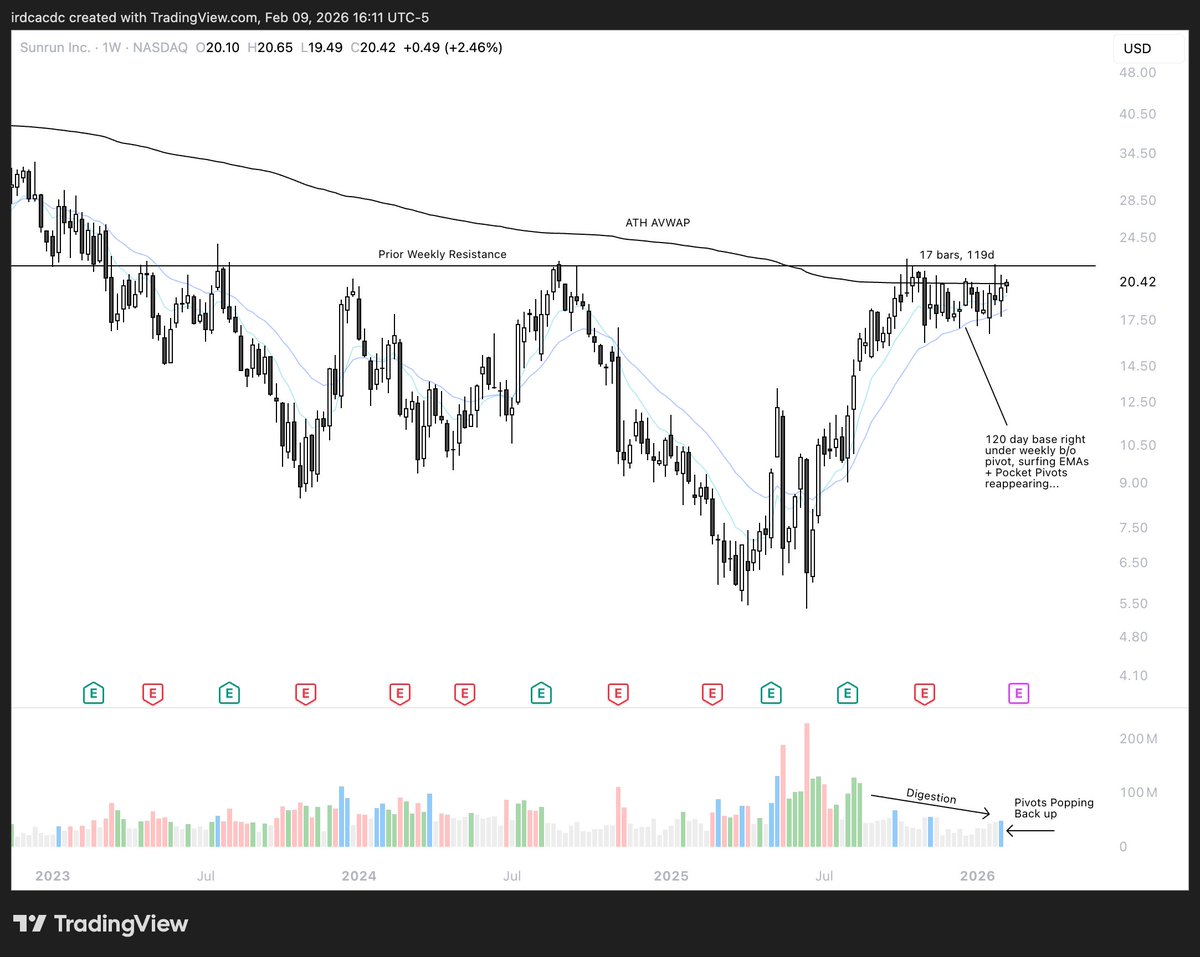
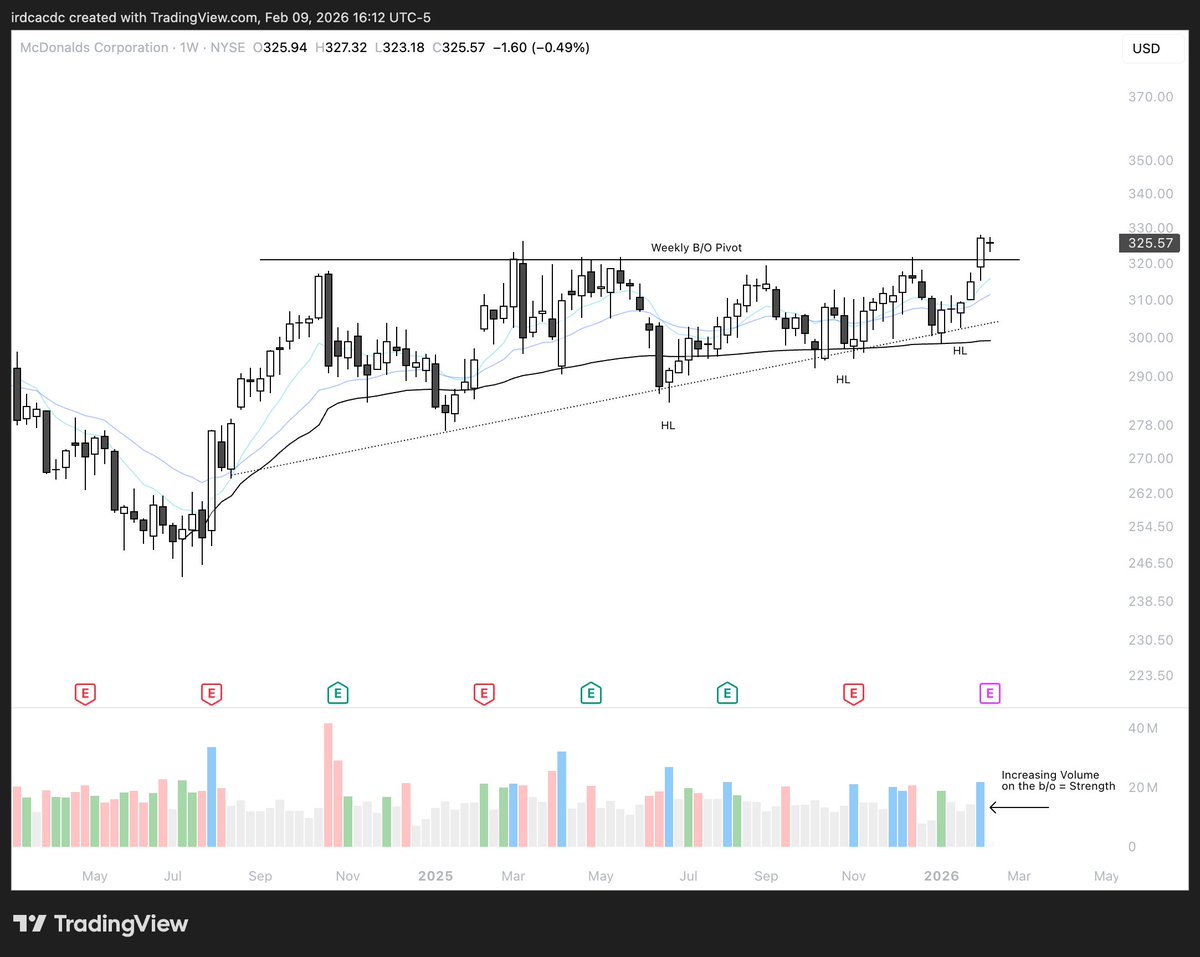
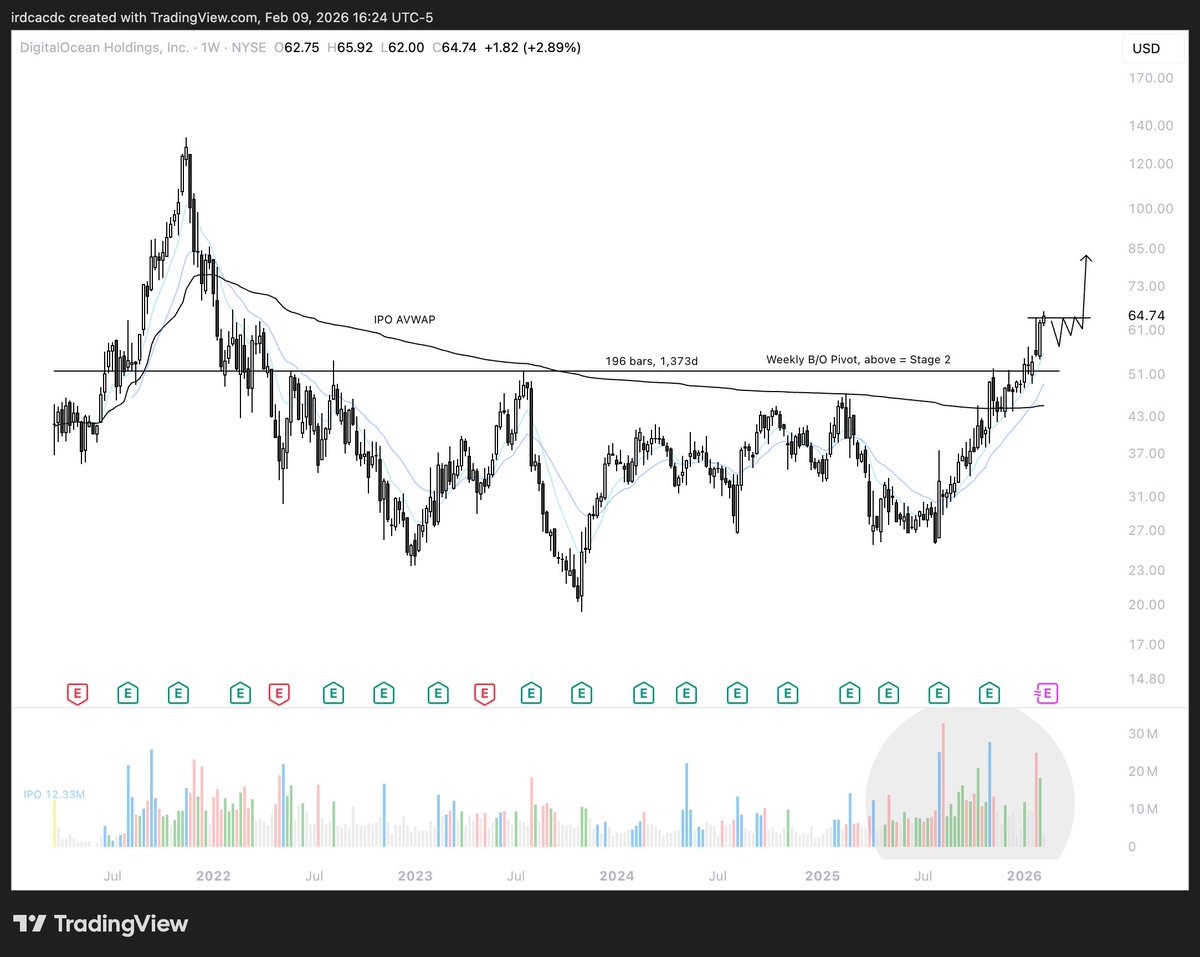
$ZM, $RUN, $MCD, and $DOCN, all of which have multi year/month bases that are just starting to move higher with clear accumulation on the right side of the bases, trading above their anchored VWAPs, and price pressing above all key moving averages.
All of these charts are showing signs of renewed institutional interest, and you can see it in the character.
Volume is expanding on up days, contracting on pullbacks, and higher lows are forming into resistance, which tells me that the behavior is shifting from Stage 1 accumulation into early Stage 2 markup.
Nobody knows what will happen next with these names, and I'm not pretending to have a crystal ball, but these are the signs I look for when I'm identifying potential leaders in early Stage 2, and if these names continue to hold trend and show controlled strength, I'll be buying every pullback that respects structure and where volume confirms the move.
For my system, it's all about recognizing behavior that repeats over and over again across different names, different sectors, and different market cycles.
- strong structure
- price surfing EMAs
- expanding volume on strength
and accumulation on the right side of the base.
...are what fuel the next wave, and that's what I'm hunting for every single day.
"The bigger the base, the higher in space."
and if you can train yourself to recognize these Stage 1 to Stage 2 transitions before everyone else piles in, you give yourself the best risk/reward setups in the entire market because you're getting in early with institutional sponsorship backing you up!!
He famously turned a $50,000 account into over $15 million in about 12 years. But his real insight was understanding that ego is a trader’s most expensive bias.
So many things are bullish all at once that people are having analysis paralysis or fixated on silver, crypto, Mag7. Nobody is talking about the Nikkei. ~4% yesterday and ~3% tonight. Pacific, Nikkei, and Australia are crushing it. History in the making. $EWJ $DXJ $EWA $VPL
If January is any indication, this is going to be quite the year for International. When playing international, I prefer comparing performance to $VEU rather than $SPY.
I understand that many of you want to engage in a conversation by bringing a different aspect of chart analysis that might "challenge" my thinking or "open my eyes to an indicator signal".
Don't take it as ignorance or rudeness if I'm not interested.
I'm actually trying to stick to my discipline in a world of unlimited signals. I know that I'm human and can easily become biased or drop my guard on a clear signal that I have been respecting for many years.
Breakout can take place with volumes declining
Breakout can take place with negative divergences on indicators. (as in the chart below)
What matters is the breakout taking place. We trade price. If it is a pattern you like the best way to increase safety on the breakout is a protective stop-loss.