🚨 حدث تاريخي في عالم التقنية! تشغيل نموذج ذكاء اصطناعي بحجم 2.78 تريليون بارامتر على 8GB RAM فقط! 🤯
أداة مجانية ومفتوحة المصدر تُدعى kimi-k3-in-c أحدثت زلزالاً تقنياً بقدرتها على تشغيل نموذج Kimi K3 بالكامل على وحدة المعالجة المركزية (CPU) العادية وبدون أي كرت شاشة!
⚡ المواصفات والإمكانيات الصادمة:
• النموذج الكامل: تشغيل 2.78T بارامتر بالكامل وليس نسخة مصغرة أو مقتطعة!
• ذاكرة ضئيلة: يستهلك فقط 8.24GB من RAM وبدون الحاجة لـ GPU.
• خفة أسطورية: محرك التشغيل بالكامل مكتوب بلغة C بحجم 176 كيلوبايت فقط، بدون PyTorch أو CUDA!
• دقة مطابقة: يعطيك نفس المخرجات الصادرة من أجهزة خارقة بذاكرة 128GB (ولكن بسرعة أقل).
• توافق شامل: يدعم وضع المحادثة (Chat mode)، ويعمل على Linux و macOS و Windows.
🔥 كيف تقوم بتشغيله على جهازك؟
1️⃣ انسخ المستودع من GitHub: FareedKhan-dev/kimi-k3-in-c
2️⃣ نفّذ أمر make ثم شغل السكريبت لتقييم كفاءة جهازك: ./scripts/k3-doctor.sh
3️⃣ قم بتحميل الـ Checkpoint واختر الإعداد المناسب لحجم الذاكرة لديك.
صحيح أن السرعة بطيئة ويتطلب مساحة تخزين SSD كبيرة.. لكن تشغيل نموذج بتريليونات البارامترات على جهاز مكتبي عادي بـ 8GB RAM هو جنون تقني يعيد تعريف المستحيل! ⏱️🤖
(رابط المستودع المباشر تجدونه في أول تعليق 👇)
📌 احفظ التغريدة بمفضلتك فوراً لتجربتها على جهازك وشاركنا رأيك 🔖👇
I put together some of my trading lessons for you guys.
No likes. No reposts. No comments needed.
Just study it, backtest it, and use it. 🤝
1️⃣ Price Delivery: https://t.co/5j1gswQFuX
2️⃣ Top-Down Analysis:
https://t.co/os7ZTdQ2ET
3️⃣ MMXM:
https://t.co/6EMAQLkKZh
4️⃣ Standard Deviation Projections:
https://t.co/SV4YCG31vE
5️⃣ Optimal Trade Entry (OTE):
https://t.co/BpqYLhsGiz
6️⃣ NY Midnight Open:
https://t.co/i9VXjneik3
7️⃣ PO3 / AMD:
https://t.co/YAOv9ACyyh
8️⃣ Liquidity Sweep:
https://t.co/TzjuKom4C0
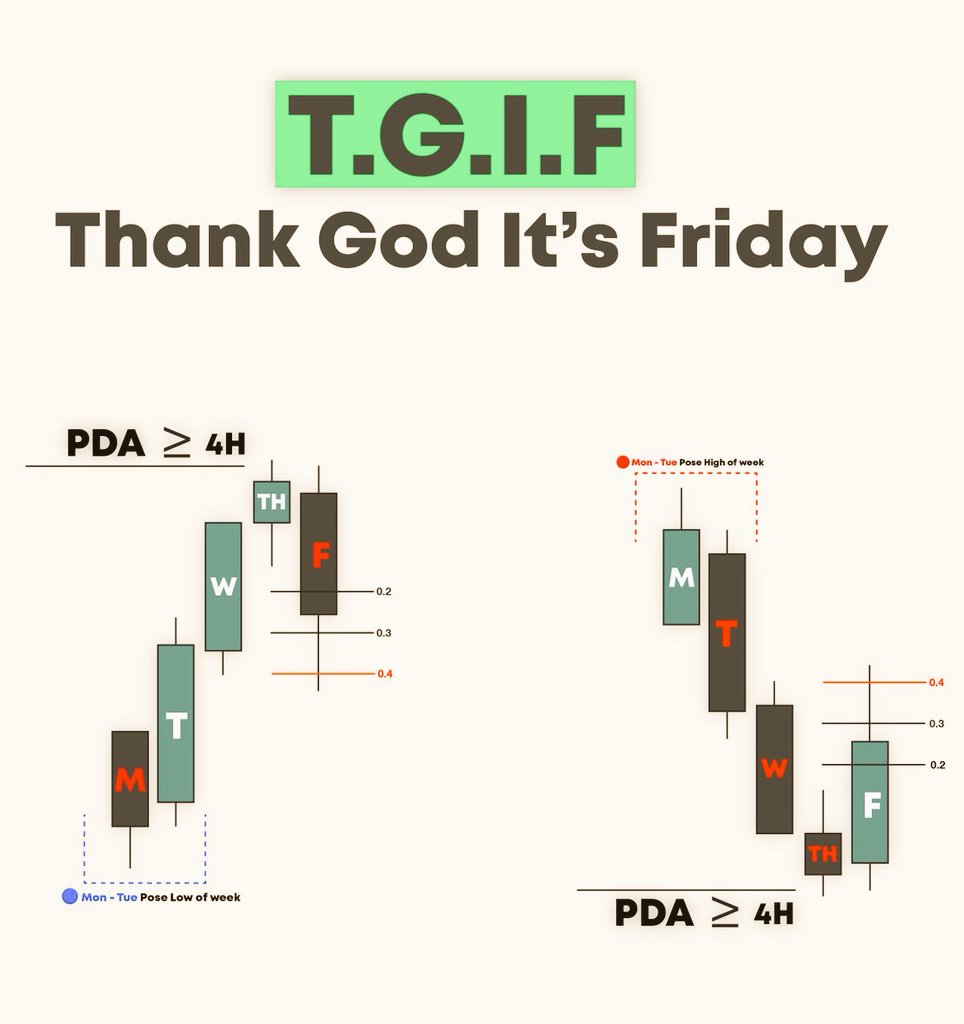
9️⃣ TGIF:
https://t.co/kW7dQ7BOsE
Save this post. One lesson from this post can completely change your trading. 📚
I created this @tradingview SMT divergence indicator and I'm sharing it for free.
I think it does a very good job but I'm listening to ideas to make it better.
Let me know if you want it and I'll send it to you. Make sure to follow me to enable DMs.
Mastering Weekly Profiles.
Your daily bias is hidden inside the weekly profile.
Once you learn to read the weekly candle’s structure, you’ll know exactly when to expect expansion, reversal, or retracement.
This guide breaks down how each weekly profile reveals your daily bias.
Want it? Comment "weekly profile" & I'll DM it.
(must be following so X allow me to DM)
How to confirm large expansions
Use the 25% as a filter. If the wick forms in the 25% and It begins forming the body,
that is indication of potential large expansion.
what if the market doesn't form its wick in the 25% and goes lower into the 50%? Its still an expansion framework but it is less likely to be a large expansion.
what if it breaks the 50% hitting the 75%, at that point we can expect the candle to form as a reversal candle due to the size of the wick.
Study the signatures.
This is the cheatcode to catching large expansions
NQ daily chart case study
Treat the 25% as a gauge for market strength or weakness.
If the 25% is broken, then dont expect a very large expansion.
While you can still get an expansion, it wont be as large.
If the candle wick is formed within the lower 25% wick formation area, we can then anticipate a very large expansion.