BCH | BEYOND THE RUMORS
While BCH faces selling pressure, three developments deserve attention:
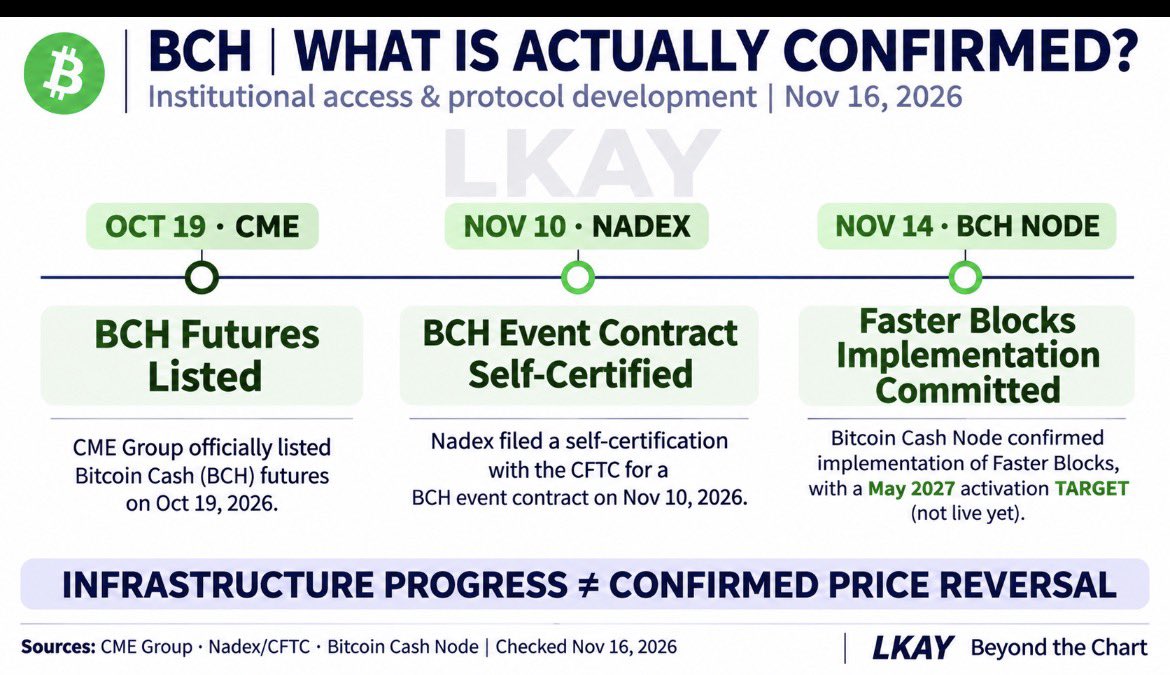
1. CME Group: BCH futures were scheduled for listing on Oct 19, with official exchange documentation confirming the launch arrangements.
2. Nadex: A BCH price-based event contract was self-certified with the CFTC on Nov 10. This is a regulatory filing—not a government adoption agreement.
3. Bitcoin Cash Node: On Nov 14, developers committed to implementing Faster Blocks, targeting May 2027 mainnet activation. The upgrade is not live yet.
These developments point to expanding market infrastructure and continued protocol work.
But there is no verified basis here to claim a new sovereign adoption deal, government payment contract or corporate BCH accumulation agreement.
Institutional access is expanding. A price reversal is not yet confirmed.
#BCH #BitcoinCash
BCH | MACRO DOWNTREND
Crypto’s selloff is deepening as Fed tightening expectations, dollar strength, ETF outflows and liquidations pressure risk assets.
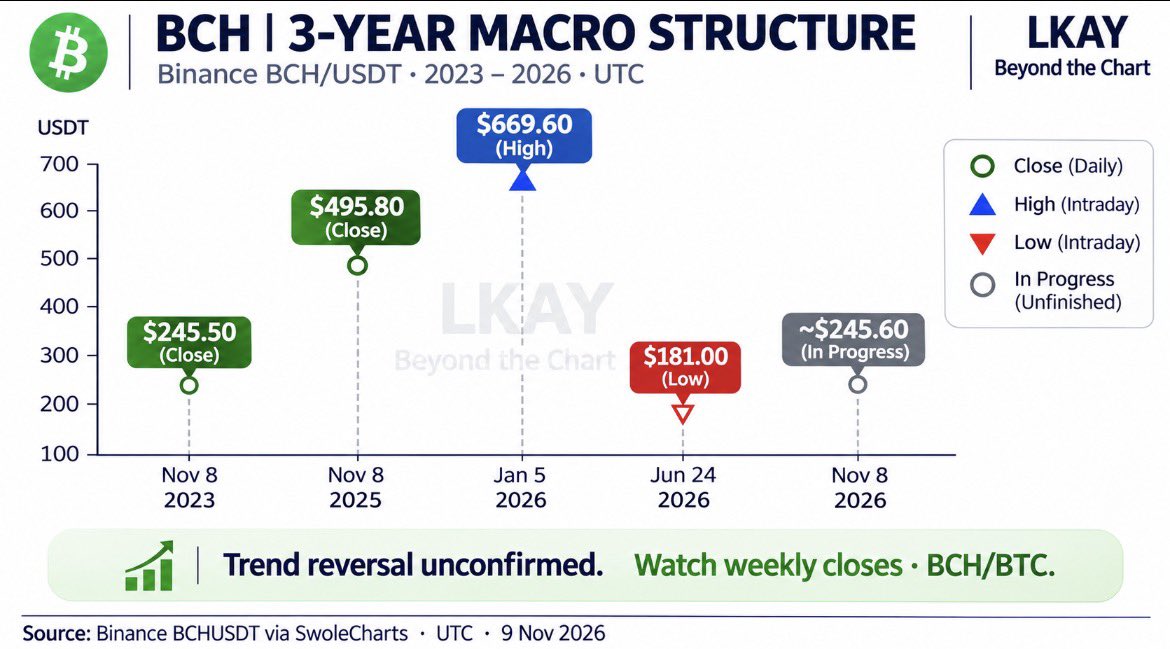
BCH’s 2026 high was $669.60. Its June low was $181. The Nov 14 close was $200.91.
The July–September rebound has faded, leaving BCH near its June lows.
Miner-driven selling remains unverified. A confirmed Elliott-wave bottom or completed harmonic reversal is also unsupported.
The key question isn’t how far BCH has already fallen. It’s whether weekly price structure, spot demand and BCH/BTC relative strength can stabilize.
A short-term bounce would not, by itself, confirm a long-term recovery.
Recovery must be proven—not assumed.
#BCH #BitcoinCash
BCH | THE BIGGER PICTURE: WHY THE SELLOFF MATTERS
Bitcoin Cash has experienced a sharp correction, falling 17.25% from $272.40 on November 5 to $225.40 on November 12 (Binance BCH/USDT, daily closes).
Eight consecutive lower daily closes reveal sustained selling pressure rather than a single-day liquidation event.
1. WHY IS BCH FALLING?
The broader crypto market has been under pressure from weakening BTC prices, macroeconomic uncertainty, spot Bitcoin ETF outflows, and leveraged position liquidations.
These factors provide an important backdrop to BCH’s decline, but they do not establish the precise source of BCH selling.
Claims of large-scale miner dumping remain unverified. Likewise, there is insufficient evidence to confirm that a completed Gartley pattern triggered the correction.
2. WHAT DOES THE CHART TELL US?
BCH’s short-term structure remains bearish.
Recent oversold RSI readings suggest stretched downside momentum, but oversold conditions alone do not confirm a bottom.
The $223.20 area represents a recent observed low. A recovery toward $234–241 would be an initial technical test, not proof of a new bullish trend.
3. THE LONG-TERM PERSPECTIVE
The bigger question is whether BCH can rebuild a sustainable market structure.
A credible recovery requires more than a temporary price bounce:
• Stronger weekly closing prices
• Improving spot trading volume
• Sustained BCH/BTC relative strength
• Evidence of healthier market positioning
Without these confirmations, a short-term rebound may remain part of a broader corrective phase.
MY CURRENT VIEW
The selloff is real. The bearish structure is visible. But the evidence does not yet justify declaring a long-term bottom—or attributing the decline to miners or a specific harmonic pattern.
The next meaningful signal will come from how BCH responds to recent lows and whether buyers can reclaim higher price levels with convincing participation.
A bounce is possible. A reversal must be proven.
#BCH #BitcoinCash #Crypto
BCH | 3-YEAR MACRO VIEW
BCH’s 2026 high reached $669.60 before a steep correction. The June low was $181.
The long-term recovery remains unconfirmed.
Key signals: weekly trend recovery, spot volume and BCH/BTC relative strength.
A bounce is not a reversal.
#BCH
BCH | POST-MIDTERM WATCH 🇺🇸
Crypto markets are diverging after the U.S. midterms.
Is BCH emerging as a relative-strength candidate?
The key test: whether BCH can outperform BTC and ETH as post-election volatility unfolds.
Watch the data, not the narrative.
#BCH#Crypto