@TraderDune@amlkr55@DuneCapital Haters will always hate, just block them without losing time and energy on them, you have other priorities 😀
Now they have one reason to hate but they would go against you even if you become what they preach is good...it is similar to real life unfortunately
⚠️ CONFLUENCE ⚠️
Confluence is the combination of multiple factors, such as types of TA, charts, emotions and news. Confluence will align at a specific price level, increasing the probability of a successful trade.
It means different types of analysis confirm the same trading opportunity, giving traders more confidence in their decision-making. Find strong confluence around the same level at roughly the same time because then the entry/exit becomes much safer. The more confluence, the better.
You should never use one confluence by itself.
The quality of your trades depends on the number of confirmations you find.
Technical Analysis Confluence
Here's a list of the strong confluences from a MM/Algo perspective to use when charting:
- Market structure 👉 https://t.co/X7T8tC4LW8
- Fibonacci retracement 👉 https://t.co/06crLZbR51
- Supply & Demand 👉 https://t.co/WxXVW1rmQP
- Discount & Premium 👉 https://t.co/rvRUNNXRWd
- FVGs 👉 https://t.co/ujrxNxD1BB
- Order Blocks (Key Levels) 👉 https://t.co/sMgqpYVdmd
- Refining 👉 https://t.co/Ix5ZPtK7yS
- Multiple time frames 👉 https://t.co/11KUquu70B
- Ranges (Coming soon)
- Three drive patterns (and inverted)
- Head and shoulder pattern (and inverted)
Other technical analysis confluences (weak) you can use from a retail perspective when charting:
- RSI
- Trendlines (support and resistance)
- Moving averages
- MACD
I wouldn't focus on these too much, as they are lagging indicators, but it's good to think like a retail player. Understand how they might be feeling or what they're seeing. Use their perspective to your advantage as retail players are often wrong.
Other strong confluences non-TA related:
- @Moneytaur_ (Of course)
- Psychological thinking (Coming soon)
- Volatility (Coming soon)
- Major News involving countries and institutions
Major charts to use as strong confluence:
- BTC
- ETH
- ETH/BTC
- TOTALs
- USDT.D
- BTC.D
- BVOL & BVOL24
- VIX
- BTC pairs (SOL/BTC, LINK/BTC, etc)
- COIN (Coinbase on NASDAQ)
Look at BTC's trend, this will be your strongest confluence as it will give you an idea of the direction of the market.
ETH and ETH/BTC trends will give you a general idea of the altcoin market. Overall altcoins will do well if Bitcoin is trending higher but they'll do extremely well when ETH and ETH/BTC are trending higher.
Look for key levels on the TOTAL charts from the HTF to see where the major reversals will be (From the weekly TFs and refined for strong confluence).
Look for key levels on the USDT.D chart from the HTF to see where the major reversals will be (From the weekly TFs and refined for strong confluence).
Look at the trend on the BTC.D chart. When it trends higher that means Bitcoin is generally outperforming altcoins. When it trends lower that means altcoins are generally outperforming Bitcoin (Altcoins can have a decent run while BTC.D trends higher so don't be deceived and wait for the easily visible "altcoin season")
Look for support and resistance on the BVOL chart to give you an idea of when the major turning point will be. On the BVOL24 chart, when PA goes below 1.42 I look for Bitcoin volatility (The answer to which direction will be found in Bitcoin's PA, look at the current MS and where the key levels lie).
On the VIX chart, when PA goes above 44, I expect high volatility in the stock market which can be relative to the crypto market too. This is generally a massive turning point in the markets, whether bullish or bearish (The answer will be on the charts you are looking at).
Look for key levels on Bitcoin-paired charts as it will give you an idea of where the reversal could happen (Use this to see the "altcoin season" for your specified coin).
Look for key levels on the COIN chart on the HTF to see where the major reversals will be. It typically likes to reverse at local tops and bottoms (Mainly look at the weekly TF and higher).
External Confluence
From an outside perspective, your best confluence will be upcoming major real-world events and the current sentiment of the market (Emotions).
For example, real-world events include countries and institutions selling/buying crypto, the president of America creating his meme coin at the top, Bitcoin halvings, presidential elections being a good turning point, Major hacks and collapses, ETFs and exchanges freezing, etc. There are many types of confluence that you can add to your thesis (It will feel weird at first as you'll be doing the opposite of what you see on socials but you'll soon be able to 👁️ and understand how the game is played).
For example for the market sentiment, when your friends are asking you about crypto (typically a good sign to sell as the market is overly bullish and usually happens at/near the tops). People tend to be very quiet and non-existent at/near the bottom as they don't want to talk about their losses.
When it's positive, it's time to take profits.
When it's negative, it's time to take risks.
When you're excited, it's time to take profits.
When you're fearful, it's time to take risks.
It sounds simple and it is but people's emotions sway their decision-making in the moment.
Here are two examples from a long-term holder perspective. Just because you have an investor perspective doesn't mean you have to hold indefinitely. Maintain that trader perspective and time the market to be an effective investor.
Taking Profit Example (December '24):
- Three drive pattern forming on Bitcoin
- Bitcoin hitting 100k (Psychological number)
- USDT.D testing at the bottom of its range (3.79%)
- ETH testing the top of its range ($4k)
- TOTAL1 testing the -0.5 Fibonacci level
- TOTAl3 testing at the top of its range (1.13T)
- Ultra-bullish sentiment on social media (Excitement)
- Michael Saylor talking about Bitcoin on Fox News
- Coinbase allows users to purchase crypto with the easiest payment system on the planet with Apple
- HTF key levels hit on multiple large-cap coins at the same time (Supply or HTF hidden liquidity)
- And much more...
If you go through all the confluence, you'll see it all happened between 01/12/24 and 16/12/24. It's not a coincidence that this all happens at the same time. Someone has to lose for there to be a winner. Use the confluence to your advantage and come up with a decision.
Taking Risk Example (August '24):
- Bitcoin testing a HTF key level (3W HOB)
- Ethereum testing the bottom of its range ($2.1k)
- USDT.D testing at the top of its range and remained respected (6.51%)
- TOTAL1 tested a HTF key level and remained respected (1M HOB or refined 2D BB)
- TOTAL2 tested its demand zone (1M OB)
- TOTAL3 tested its demand zone (1M OB)
- ETH/BTC tested a HTF key level (3D HOBx2)
- COIN tested its demand zone (1M OB)
- BVOL testing its resistance area (26-29)
- VIX tested its region above 44 (High volatility)
- Ultra-bearish sentiment on social media (Fear)
- Countries and institutions involvement
- Large exchanges freezing (Crypto and Stocks)
- Negative news before and after the drop such as large sales, wars, depression and suing (Fuelling volatility)
Same explanation as before, you'll see it all happened relatively at the same time within a month. It's not a coincidence. You can see the bullish and bearish scenarios are quite contradicting too.
For the traders who like to trade in between the local tops/bottoms, you won't have intense emotions or major news going around so you'll have to focus more from a technical analysis perspective. You'll have to focus mainly on the key levels on the charts. Go over the technical analysis confluence mentioned above as that will be enough for you to understand what confluence you need to look for.
It may be a good idea to form a confluence checklist to see if the setup has a high probability of going in your favour. For example:
- Hidden liquidity
- High-volume coin
- Supply/Demand
- Fibonacci levels
- Market structure shift
- Same direction as the HTF trend
- Specific chart patterns
- Multiple timeframe confluence
- Discount/Premium
- Major chart confluence (USDT.D, BTC, ETH and TOTALs)
- Reasonable and clear target above into a key level in a discount or premium zone
Try to aim for at least 5 different types of confluence to have a high probability trade (Some are stronger than others). If you don't find enough confluence at your key level, move on and focus on a different chart. There are multiple charts out there that have great setups that are yet to be tested.
You just have to find them 👁️
I try to make these topics as friendly as possible and it does take some time out of my day so if you want me to provide more educational posts, please like and repost so they can reach more people 🙏
If you have any questions, put them in the comments below 👇
⚠️ ENTERING TRADES ⚠️
Now there are 2 ways to enter the market: A limit order (LO) and a market Order (MO). A LO will enter at the price you set and will create a position once that price is hit. This is more convenient on the HTF plays as these plays take time to hit. A MO will create a position at the current market price instantly. This is more convenient on the MTF and LTF plays as time is against you and you may not have much time to execute.
Understand entering trades depends entirely on you. There’s no rule. Some people spend little time on the market and only look at the HTFs/MTFs so they’ll stick to LOs. Other people may trade constantly on all TFs and use a MO for the MTFs/LTFs to execute their trades quickly.
HTF - Limit Order
MTF - Limit Order/Market Order
LTF - Market Order
Personal Preference
I’ve recently only been using LOs as I’m way more confident with my trades now and can identify a trade with a high probability of winning. I’ve only been trading on the HTFs and MTFs, which matches my lifestyle as I can be quite busy sometimes. Therefore, using a LO is the best solution.
Limit Orders
Preferably used in HTF plays as they have a higher probability of winning as the chosen area will most likely be a swing point. You should set these orders at significant levels whether they are hidden or HTF OBs.
AAVE EXAMPLE:
Here we have a 1D HOB and a refined level with a 17H OB that goes through 2 FVGs. Now you can split your position into 50/50 or however you want to. You set your 1st LO at the beginning of the 1D HOB with 50% of your position then the other 50% at the beginning of the 17H HOB. Or you can set 100% of your position at the refined level, it's entirely up to you. I can't give you specifics as everyone's strategy towards a setup may be slightly different due to their emotions and setup strategy.
Ways To Enter with a LO
Place a LO at the:
- Equilibrium of the OB (If you can’t refine the HTF OB and the size of the OB is big)
- Untested fib level (Mostly used with the equilibrium fib level)
- Refined level (Mostly used)
- At the beginning of the chosen OB (Depending on the size of the OB)
- Split the LO in two (One at HTF OB and another at the refined level)
You can learn about untested fib levels on my Fibonacci retracement educational post here 👉 https://t.co/06crLZcoUz
You can learn about refining levels on my refinement educational post here 👉 https://t.co/Ix5ZPtKFoq
You can learn about risk management on my risk management educational post here (Very important when it comes to creating a position) 👉 https://t.co/OKJmqTkNh3
Market Orders
MOs can be used across all TFs and can be more convenient when it comes to executing trades quickly. Patiently wait for PA to reach your key level then execute or you can wait a little more for a LTF MSS and check for a setup on the LTF before the true reversal (if the HTF play is already being respected).
AERO EXAMPLE
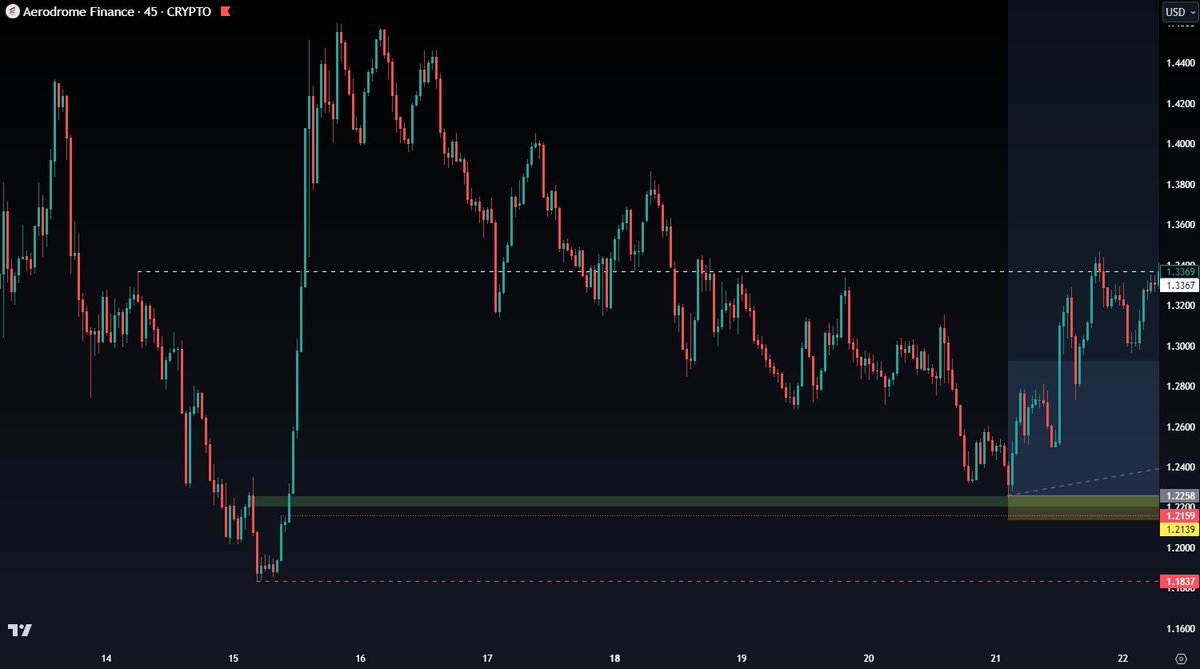
Here we have a 2D HOB through 4 FVGs. Now you could have entered with a MO at the equilibrium of the 2D HOB or, 0.705 Fib level or the top of the OB.
Now, when you go onto the LTF, you can see a 45m HOB was left behind and it broke its LTF MS to the upside afterwards. PA came back seeking that liquidity and you could have entered with a MO. Remember the HTF play, 2D HOB, was respected so you can assume PA won't seek lower than its PSL. In that LTF scenario, you would've had a smaller SL with a greater R/R while seeing the trade as a HTF play.
This type of scenario won't always play out pretty. LTF plays can be ignored leaving you with no position after identifying a good setup from the HTF. The higher the risk, the bigger the reward. The choice is yours.
During ⚡️ moves, it's best to focus on entries with MOs rather than LOs to avoid fast liquidations. If you are to use LOs, make sure to look at the macro charts (USDT.D, TOTALs or BTC) to determine which key level is best to execute with. If you're worried about MOs in fast moves then you can wait for the candle body close to tell you which key level remained valid. Go onto the LTFs to see where the trading volume is (Candle bodies) as this will give you an indication of where to put your SL.
These educational posts will help you decipher the information above:
👉 https://t.co/X7T8tC5jLG (Market Structure)
👉 https://t.co/yrQhL3oJrs (Confirmation)
Here's a clear example of how @Moneytaur_ explains this type of situation 👉 https://t.co/FYNk1ruJ1O
(If you can't understand this post and MT's content then you lack experience & knowledge. Keep going and don't give up, the journey is supposed to be hard)
Now there isn’t an optimal way to enter with a MO as you’re entering as PA enters your identified level. The reaction on the LTFs can be quick and may even wick outside your area. This is more of a feeling of when you think it’s best to enter due to the market conditions you're currently experiencing. This feeling may come before or after confirmation with candle body closures. Evaluate the situation. Has Bitcoin hit a key level yet? Are the USDT.D/TOTAL charts near their key level or hit their key level yet? With experience, you’ll gain a better understanding of when to enter with MOs.
The entry point is very important as it will determine your SL and R/R ratio. I’ve been using @MoneyTaur_’s strategy and I’ve noticed it’s very rare for me to see a SL above 5% and to have a R/R less than 5R due to the accuracy of the strategy.
I try to make these topics as friendly as possible and it does take some time out of my day so if you want me to provide more educational posts, please like and repost so they can reach more people 🙏
If you have any questions, put them in the comments below 👇
I want to share something with you in order to "disrupt" the mentality that has always been lurking (and still lurking) the crypto space.
This is a sheet prepared from one of the students with some of the assets I shared at favorable R/R opportunities and current prices % increase.
All of those assets (and metrics) have their respective targets calculated with an analytical approach based on Fib levels & liquidity + aligned with my overall view of the market and its potential returns.
As you can see, those targets aren't the classic ones you see here on X that are based on "moon-talks" and expectations.
Almost all coins are up at least 2/3x providing solid returns just with a spot approach.
This could have been drastically amplified by hedging spot positions with longs and this means that people
have already obtained their "altseason" without overly stressing while trimming profits all the way up waiting, by setting different TP levels, to potentially profit more based on the reaction of the market and the price actions of these assets.
This approach is important because it cultivates responsibility since having a sheet with TP already marked emphasizes selling discipline.
Everything else is a "bonus", something to treat with "spare money" waiting until the market provides the HTF reversal.
You don't need to wait for your investment to print a 100x to be considered successful.
You take risks where the overall risk is sensibly low and you start decreasing your risk when is sensibly higher.
A bunch of well made trades repeated over a long period and you'll outperform the majority of crypto plebs while lowering your stress levels.
This is valid for both bull and bear markets, you don't need to waste another 3/4 years waiting for the next bull wave while doing nothing in the meantime.
Of course, this approach is suitable for those who want to embrace a different path instead of being tricked left and right by scamfluencers that promise the 🌙.
⚠️ MARKET STRUCTURE ⚠️
The 2 main factors that decide whether you enter a trade are market structure (MS) and liquidity/volume. The 2 simple concepts that get overlooked by many traders.
MS will help you distinguish if the trend is in an uptrend (bullish)/downtrend (bearish) or if PA is consolidating. MS will help you highlight the manipulation in the market that the 🐳's set. For example, a fake breakout.
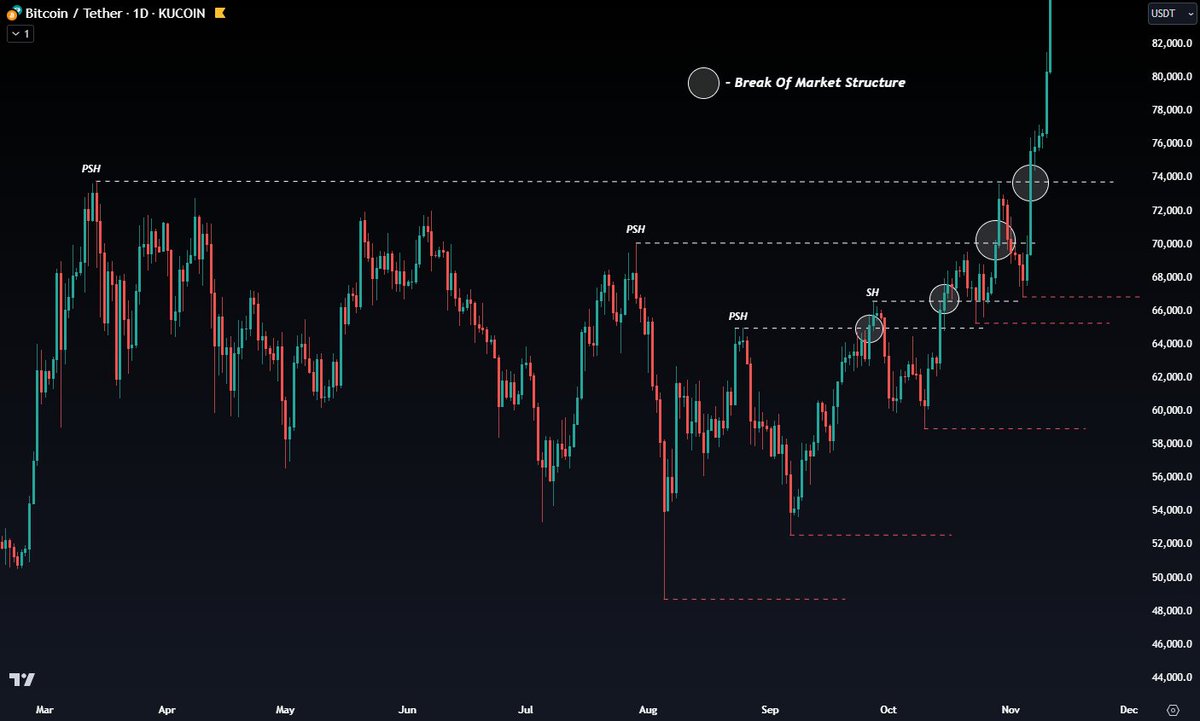
A break of structure (BOS) is important as it represents a shift in the MS/trend. If price action (PA) breaks above a PSH or below a PSL, it indicates that there will be a potential reversal or continuation in the same direction as the breakout. A BOS on a HTF is far more reliable than one on a MTF/LTF. Never trade against the HTF trend, if you do, accept that the probability of success is now lower and you should either risk less or ignore the trade. Understand your risk management.
HTF > MTF > LTF
The HIGHER the timeframe, the more POWERFUL the BOMS is.
Since mastering MS, I've seen a huge rise in my success rate in choosing the RIGHT setups.
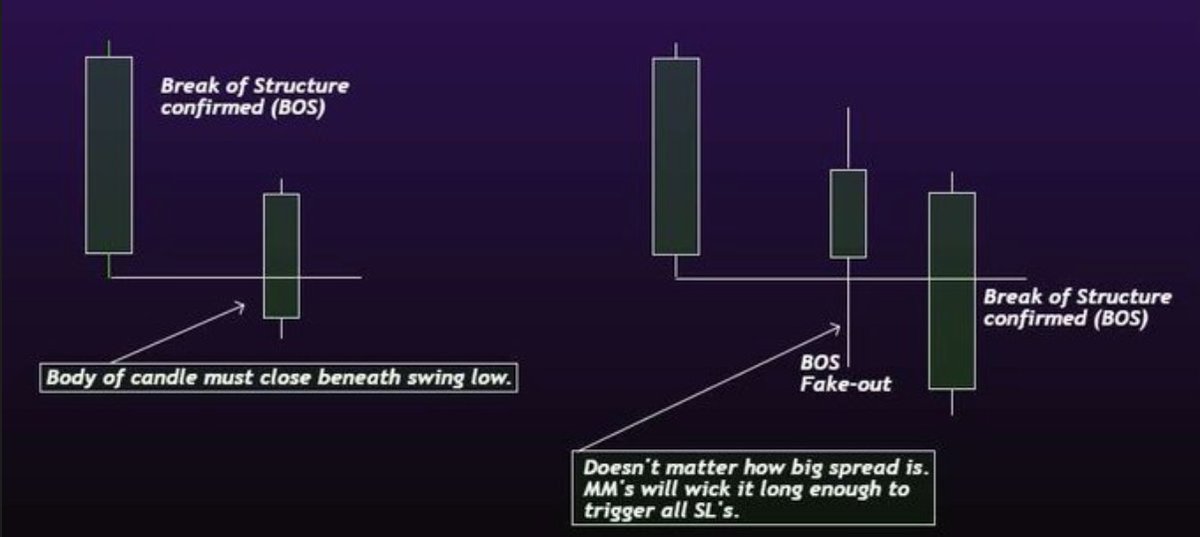
MoneyTaur - "A wick doesn't confirm it broke. It's a false break. A body does. Bodies hold institutional trading volume. Wicks can hold no liquidity on them"
Candle closes will show you if your support/resistance level or key area of liquidity is broken. If your support/resistance level is broken, you wait for a pullback into a key area. If your key area of liquidity is broken then move on a find another opportunity elsewhere 👉 https://t.co/yrQhL3oJrs
Don't chase PA, let it come to you.
You should always look for the MS first when charting a setup to see if the trade will be in your favour (+1 confluence). If your PSH wasn't broken and you still can 👁️ a key liquidity level, it doesn't mean you have to ignore it. You can just risk less as the confluence on the setup is weaker. Find your personal preference. Learn to master your thoughts on a chosen setup.
Once the PSH/PSL has been broken you now have a new range and will look for key levels within the new range. Remember your discount and premium zones when placing your fib levels. Understanding MS will help you identify optimal trades.
(Zones) 👉 https://t.co/oLzM0aoqJS
(Fibonacci retracement) 👉 https://t.co/06crLZcoUz
$LINK Example:
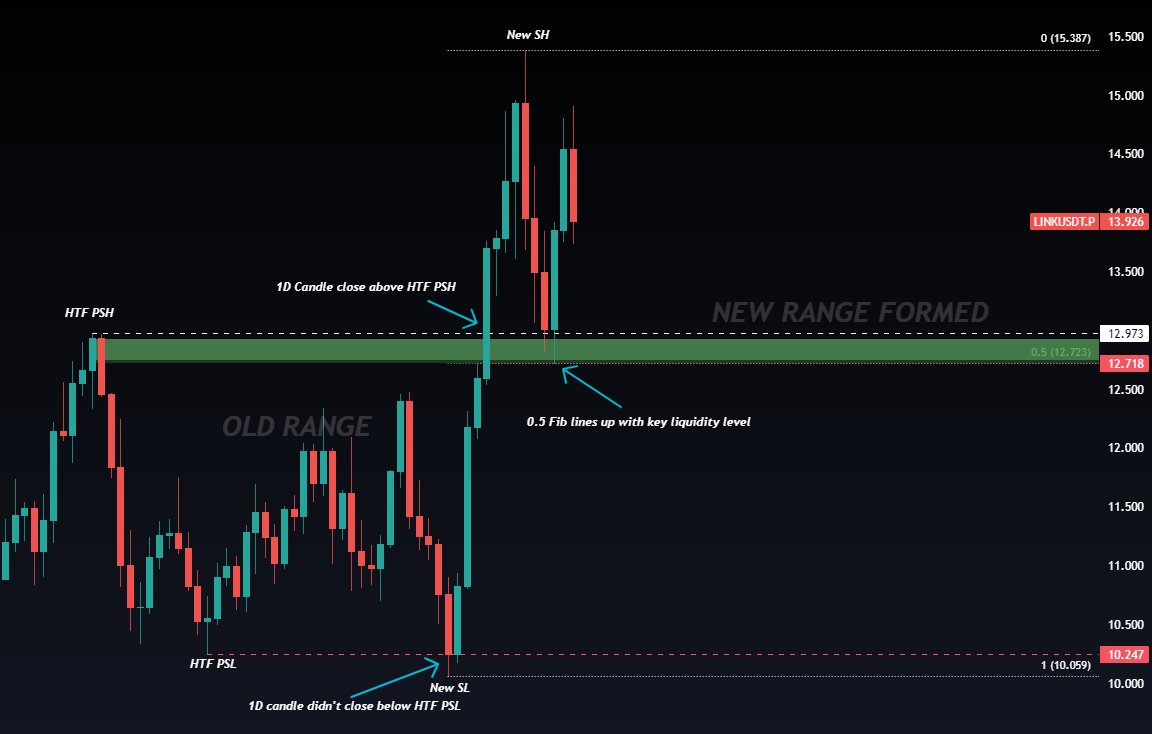
In our old range, the 1D candlestick didn't close below our HTF PSL so we can assume PA will continue to range inside the old range. Now, the 1D candlestick closed above the HTF PSH indicating a market structure shift (MSS) while leaving behind a FVG which created the HOB.
Now we have a new SL and SH (new range formed). Place your fibs from the SL to the SH and then you can see that the equilibrium lines up with our key liquidity level (17H HOB inside 1D pHOB).
Market structure shift (Confluence)
HOB as our key level (Confluence)
Equilibrium lining up with key level (Confluence)
Remember, this all started with us identifying the MS and seeing that it broke past the PSH to the upside therefore we can assume the price will pull back into a key level and then continue upwards 📈. PA will seek the key area of liquidity giving us a long opportunity at hand.
Check for the HTF BOS as this will be your main confirmation of whether the long/short setup is strong or weak. The key to successful trading is understanding the MS and identifying the shift patterns (Timing the market). Once MS has shifted, look for the best entries on the pullback. This will help you avoid entering terrible setups. Waiting for the pullback into a key level of liquidity after a MSS will increase your chances of success.
I try to make these topics as friendly as possible and it does take some time of my day so if you want me to carry on, please like and repost so it can reach more people 🙏 (If you don't mind that is 😁)
If you have any questions then put them in the comments below 👇
@tombheads tnx, very well said...really needed this as reminder. in the long run, everything is clear, i expect ups and downs and keep on pushing...but in short term, some errors can be overwheliming at times.
Many people ask me: "Mate, how do you chart? How is the process if I want to start from a naked chart?"
Time to drop the whole framework with the hope that you may find interesting ideas to apply to your journey.
Disclaimer: Before starting, it's important to remind that everyone has his own style and the crucial aspect is being able to find a methodology that offers the highest statistical probability over time, aka backtest, contextualized to goals/time horizons and time that an individual can commit.
(Quite long post, so if you're lazy "TLDR" skip it, this isn't for you -> but if you're drinking a Mojito 🍹on the beach, you have time to read)
- First step -
The first thing way before everything else is understanding the macro structure in order to have a clear view where the price is trending and thus being able to work on a strategy.
To do so I'm gonna directly switch the chart to HTFs, mainly weekly and daily which are my favorite TFs (monthly also, but after having made a "first touch-analysis") as they have more relevance than LTFs, of course.
From those TFs, the process is identifying:
- HHs/HLs for the bullish trend
- LHs/LLs for the bearish trend
Nothing difficult, this is the first and necessary step that leads to build up the main strategy.
- Second step -
Now that I know if the price is in a bearish or a bullish trend, I start to identify strong supply & demand areas where the price can be rejected or bounce.
S&D zones are more powerful than support and resistance levels as they provide wider areas, but this doesn't mean that S/R should be ignored but instead utilized as "2nd layer" once you grasped the bigger picture.
There are S&D zones that are stronger than other ones and they usually match historical and significant points in which the price has violently wicked or strongly rejected/bounced.
Take note as additional info that the more a S or D zone is touched, the weaker it becomes as orders on one side or another get absorbed -> this can change your overall perception and operational activities.
S&D zones together with S/R levels contribute to create the "main dish" which is completed by the "dessert" called Order Blocks.
OBs are zones where significant buying or selling from smart money, offering extra but valuable areas in which the price can reverse.
Bearish and bullish OBs can fail, there are no certainties, but being to properly contextualize them in an overall analysis can make a huge difference leading to profitability.
Not every OB plotted on the chart has the same relevance, most of them are weaker as they have already been tested multiple times, therefore increasing the likelihood of being melted like butter.
The process of finding good OBs doesn't only depend on looking at HTF ones, but also switching to multiple timeframes in order to find the best ones.
Weekly? Yes. Daily? Yes. But very often you can find good levels by switching to uncommon TFs like 2D/3D as there's liquidity contained in candles that are invisible to classic TFs.
Identifying and drawing these areas on a chart adds more clarity which is strengthened by the application of trendlines.
Trendlines are drew by taking into consideration at least 2 SHs/SLs but for my attitude 3 is the perfect number that validates a correct TL.
The 🔑aspect here is to not force a TL (don't chain yourself in finding one if conditions aren't met) + understanding that horizontal S/R are more powerful than diagonal ones.
- Third step -
Finding the liquidity.💧
This is one of the most important steps as everything turns around the concept of liquidity (more here if you're interested -> https://t.co/AIibrw2QM0)
Fair value gaps play an important role in my strategy, especially the ones who have never been tested, thus boosting the probabilities of seeing the price catching the liquidity 💧toward those areas.
Untested ones that find confluence with historical PA (especially areas in which the price has strongly reacted) are more powerful than "naked FVGs" that have less relevance.
As per the OBs, even FVGs might be evaluated on multiple TFs to find the best ones, meaning that if you find multiple confluences, those gaps become stronger.
In a strong trend, FVGs could act as supports if the body of the candle closes inside of them or the price wicks toward those areas, leading to continuation.
As a general rule, I tend to look for HTF FVGs in opposition of the trend meaning that, if we consider a reversal, the higher ones in a bearish trend and the lower ones in a bullish trend, will likely be more powerful contributing to attract the price over time.
FVGs alone don't tell you about the liquidity, they need to be contextualized to candle bodies in order to be effective.
- Fourth step -
The study of price action.
Once the chart starts to appear clearer as it incorporates the concepts we mentioned above, I start to monitor all the factors involved in the PA.
This includes:
- The candles (big or small bodies and when they appear)
- The wicks (where they spike and how long they are)
- Momentum & Dominance
- Closures above/below significant areas or SHs/SLs
The dominance is extremely tied to the concept of S&D, with SHs/SLs as points to overcome in order to see continuation/reversal.
Momentum, instead, refers to the "speed" of sellers and buyers.
The less it takes for a price to reach a specific level, the stronger the momentum from buyers or sellers.
The more it takes, the weaker the momentum for one side or another.
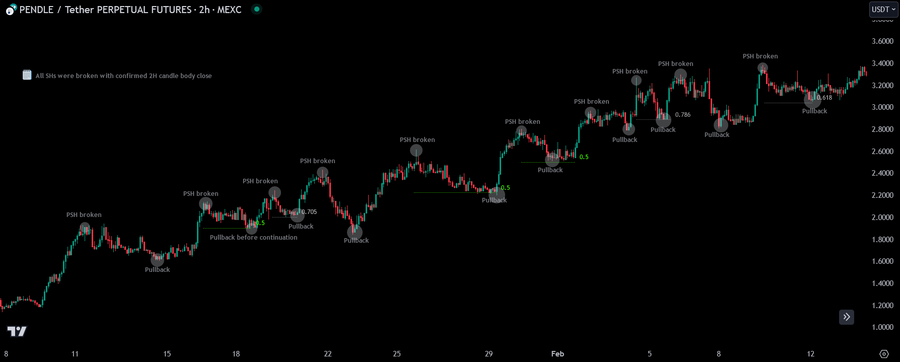
When the price closes HTF above SHs/SLs I know that could be a trigger for future continuation, usually preceded by a pullback, it's not "an instant shot".
I know, there are dozens of candle types (marubozu, hammer, hanging man, etc) and they surely help, but I prefer to move my focus on the bodies and on the wicks, as they can be enough to understand what is happening/about to happen.
Patterns?
Yes, the ones that have the highest probabilities like H&S/IH&S + 3 drives + ABCD correction.
Triangles? Sometimes, but more specifically to see if the price is compressing and can lead to a breakout.
- Fifth step -
Adding Fibonacci retracements.
I apply them on a macro scale and on HTFs, both to calculate retracements and potential targets for the future.
I use them also on lower timeframes as they help me to calculate small retracements on uptrends and assess where I could potentially take profits and reload lower.
Areas of interest are usually 0.786 + 0.618 + 0.5 (equilibrium), both for uptrends and downtrends especially if they match with S&D zones or FVGs as they become more powerful.
Extensions to calculate targets are another crucial part of my strategy, with the area of 1.618 + 1.454 + 1.272 that often helps me to find amazing 🎯
- Sixth step -
Finding confluences with external "noise" like news or announcements as they often happen when the price reaches a significant 🔑level.
Bullish news +🔑 HTF upside level -> sell
Bearish news + 🔑 HTF downside level -> buy
Price action always moves first, then the news comes out to "justify" the impulse and to 🪤 retails.
- Seventh step -
The add of potential indicators.
I don't use common indicators if not the Volume Profile that helps me to spot volume voids that matched with gaps contribute to attract the price or see areas in which there was substantial trading activity.
I often utilize Velodata for OI, Funding rate, CVD spot volume, Premium & Perp which help me to sustain the main thesis led from the price action alone.
The other indicators, for my strategy/idea aren't helpful.
That's basically the whole framework of my strategy and how I setup my charts.
If you found this helpful, the like 👍and repost buttons are just few centimeters below.
I clearly get why many accounts are frustrated over content creation.
Truth is there is no meritocracy.
The feed is full of accounts farming hundreds of likes with bull/doom posting tricking thousands of people and they even don't realize it.
Time spent for “creating” content: 3/5 minutes.
Unfortunately, the algorithm favors this situation and scammy accounts that constantly repeat the same sh*t continue to gain traction, creating the perfect environment to scam even more.
More visibility ~> more offers for paid shills (which rekt newbies)
Since day 1 of my “career” here on X, the goal has been to create valuable content with the aim of informing and helping people.
I do it with extreme passion and when you put passion into something, time flies.
My classic posts/analyses require 1/2+ hours to be deployed (+5/6 hours per day scanning through charts and thinking about the next content) and I'm sure that this period applies to many valuable accounts as well.
But independently from the passion, the time committed is huge and we don't have any reward in exchange.
I never accepted one single paid shill (despite hundreds of offers) and never will, since moral values and respect are the most important aspects to me.
It would be 10x easier to do scammy practices: post useless content ~> accept deals ~> profit..but at what cost?
Bloody money?
Are you comfortable watching yourself in the mirror knowing you're scamming people who genuinely believe in you?
Most are weak individuals who reflect modern society: greedy with no respect for others.
I honestly don't care about them because I focus on my content, but at the same time I hate this attitude..it’s horrible.
And I get why respectable accounts who put hours into making valuable content are upset..there’s no reward for being honest.
That's why the majority give up.
That being said, I won’t fight much that “dark side” of crypto (since we will likely never win) but there’s one thing I want to ask you.
One favor.
When you see an honest account you respect posting helpful content, smash the like and repost button.
Don't skip it, spend that micro-second.
It’s maybe nothing for you, but for us it makes a huge difference.
Your engagement matters as it contributes to making us grow and be seen by a wider public, thus helping the scene to have better actors.
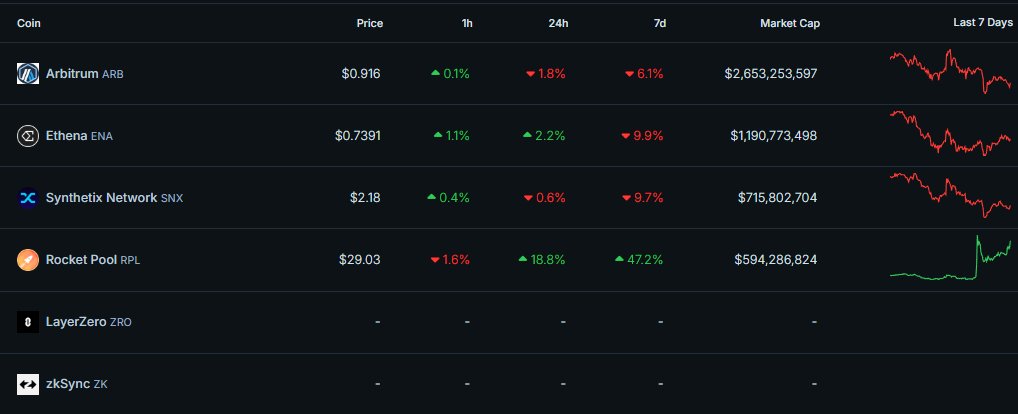
Crypto Watchlist for the week ahead:
$ZRO - LayerZero will make a big announcement regarding its upcoming token on June 20
$ZK - zkSync token will go live on June 17, with 17.5% of its supply being reserved for an airdrop
$SNX - Synthetix V3 goes live on Arbitrum next week
$RPL - Rocket Pool's Houston upgrade will go live on June 17. The upgrade will introduce on-chain voting among other things
$ENA - Ethena will announce a tokenomics and staking update on June 17
$ARB - $85M worth of ARB (3.2% of its circ. supply) will be unlocked later today. All of it will go to the team and early investors
If you enjoyed reading this, a like + retweet would be appreciated🫡
The latest DeFi developments👇
The SEC approved 8 Spot Ethereum ETFs. Trading for those will go live after the SEC approves the issuers' S-1 registration statements
Fantom announced the closing of a new $10M funding round. The round was led by Hashed, a top crypto VC
LayerZero has added support for Solana
Catalyst, a first-of-its-kind cross-chain AMM, went live on mainnet
Bluefin Trading Leagues went live ahead of Bluefin’s upcoming token launch. Bluefin is the largest derivatives DEX on Sui
CARV, a Modular Data Layer for Gaming & AI, announced its upcoming public node sale on June 5
Sei V2, a parallelized EVM blockchain, officially went live
EtherFi introduced ether fi Cash, a mobile wallet and Visa credit card. The card can borrow USDC against your ether fi assets to spend on everyday transactions
ENS Labs introduced ENS v2, proposing that the Ethereum Name Service (ENS) expands to Ethereum L2s
Stargate V2 went live on mainnet. By introducing batched transactions, Stargate V2 is able to offer a much cheaper bridging experience
PayPal's stablecoin $PYUSD launched on Solana
Hyperliquid launched a new L1 season points program. The program will last for 4 months
Taiko, an Ethereum ZK-EVM L2, has been deployed on mainnet
Zeta Markets introduced Zeta X, the first-ever DeFi L2 on Solana. ZX aims to offer the convenience of CEXs with the benefits of decentralization
NEAR Protocol announced the launch of NEAR AI, a new development lab focused on decentralized AI
Ethereum’s next big upgrade has been scheduled for Q1 2025. The upcoming Pectra upgrade will introduce account abstraction on Ethereum
And that's all for today.
If you enjoyed reading this, a like and a retweet would be much appreciated🫡