@elpidaldo It is terrific that you are studying the material so closely. This is a mistake. I'm working to correct the material over the next few days.
The anchor for the horizontal count should be the lowest O in the pattern (58.76).
Thank you again for pointing this out.
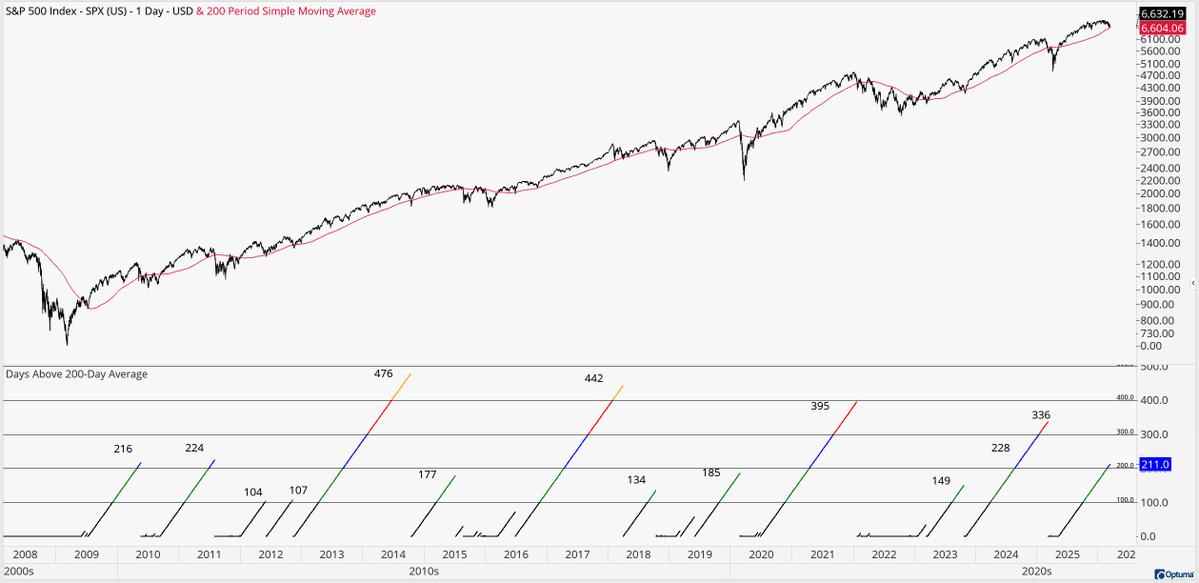
The S&P 500 is <0.5% above its 200-day moving average after 211 days above it.
What happens when runs this long finally break?
Find out here: https://t.co/DaPt8Pqrk8
https://t.co/eS6uLAckbh
The VIX futures curve flipped into backwardation. Short-term stress priced above long-term calm.
What matters next:
1) Spot VIX retreats, the storm has passed
2) Longer dated futures drop and front stays high, stress is more persistent
3) Inversion lingers, uncertainty remains
Our relative sector positioning versus the S&P 500 was unchanged this month. No shifts in overweight, underweight, or zero-weight stances. The model remains overweight XLU, XLK, XLI, XLF, XLC; underweight XLY, XLP, XLB; and out of XLV, XLRE, and XLE.
In the large-cap space, technology closed last month at a 12-month high in price and relative strength. Also, 12-month price highs from XLI and XLU.
My CedarCore sector model is running overweight: XLC, XLI, XLK, XLF, and XLU.
Underweight or out: XLB, XLE, XLP, XLRE, XLV, XLY.
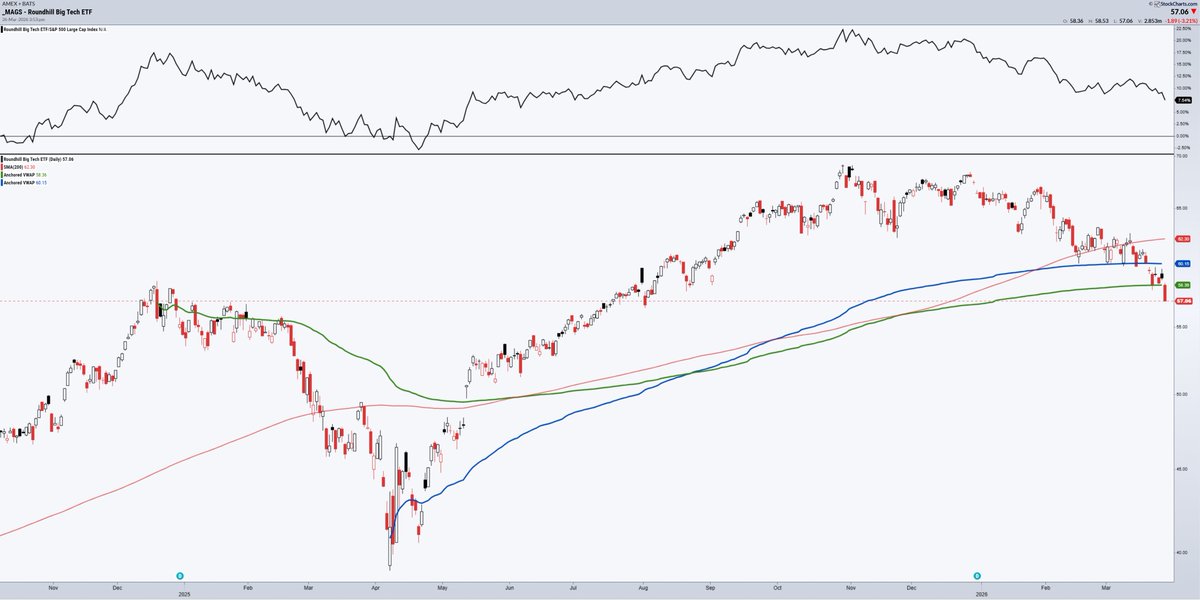
@jonathanharrier Thank you! And it seems to be a very good sign for them, too. Interestingly, to start this month, one of my ETF momentum models just shifted into a mid-cap growth ETF.
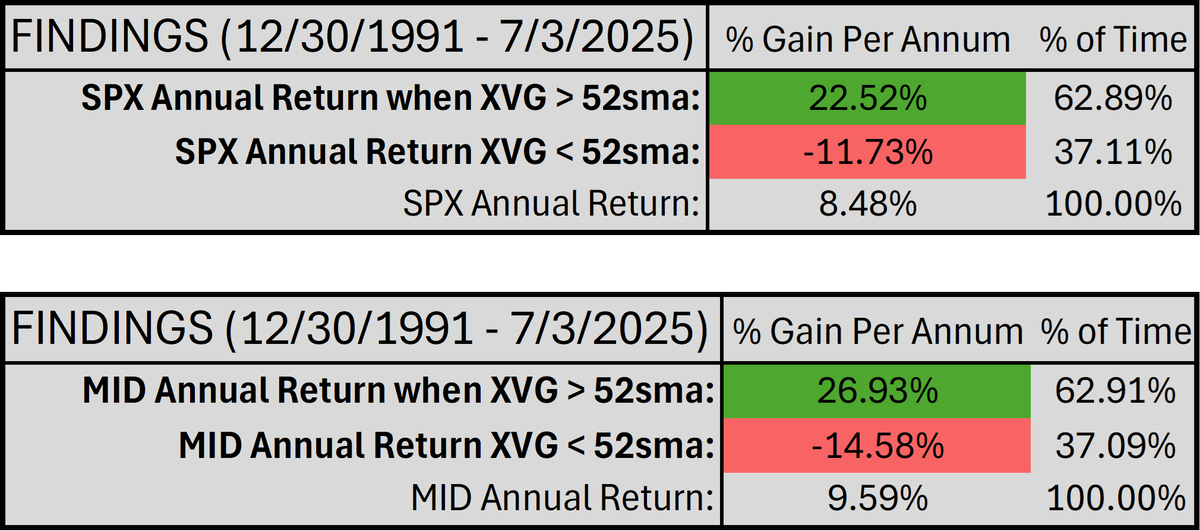
The Value Line Geometric Avg. tracks ~1,700 N. American stocks and uses a geometric mean to better reflect broad participation vs. cap-weighted indexes.
Just closed above its 52-wk avg, historically bullish for the S&P 500 since 1975, and is breaking out of a multi-year base.
With small caps now above their 200-day moving averages alongside mid and large caps, this marks a constructive development across capitalization tiers. The percentage of S&P 1500 stocks trading above their own 200-day averages is also back above 50%.
High yield spreads just slipped below the 200-day. A narrowing spread = rising confidence. Historically, that's a better-than-average bullish backdrop for S&P 500. Worth watching.