Have completed 8 modules so far for my MSc:
Intro Data Analytics
Data Prog R
Inference
Statistical M/L
Data Prog C
Data Prog SAS
Data Prog Python
Predictive Analytics
This semester is:
Multivariate Analysis
Bayesian Analysis
8 down, 10 to go 😅
@Facebook Im trying to log into an account I havent logged into for a long time, I reset the password but it asks me to confirm identity by contacting 5 friends and getting a code from them. I am only able to contact 1 person on that list. How do i get around this?
So far I have done 7 days of coding on the subject of Data Science in Python, definitely could have given myself a refresher in statistics before tackling this part! At least I have a plan for after 100 Days of coding😁
#100DaysOfCode#Statistics
Day 77- Today I used nested loops to clean dataframes, filtered and queried, used seaborn to create bubble charts and superimpose a linear regressions over data, ran regressions with scikit-learn and calculate the coefficients
#100DaysOfCode#PythonLearning
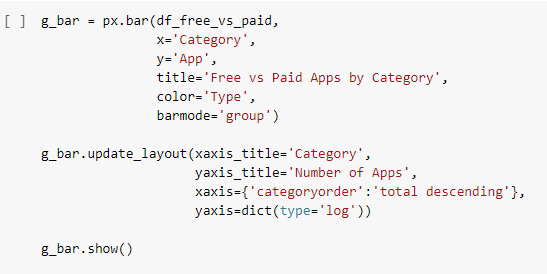
@codewithsergio Using pandas and plotly! Import them at the start,
import pandas as pd
import https://t.co/Fn0SMlfE6W as px
I previously cleaned data and created a dataframe from it using pandas.
I then created another dataframe from the cleaned one to group the data in the format I need
Day 75- Today I used Pandas .sample(), .duplicated(), .drop_duplicates(), .to_numeric(). Used plotly to generate pie, donut, and bar charts as well as box and scatter plots.
#100DaysOfCode#PythonLearning
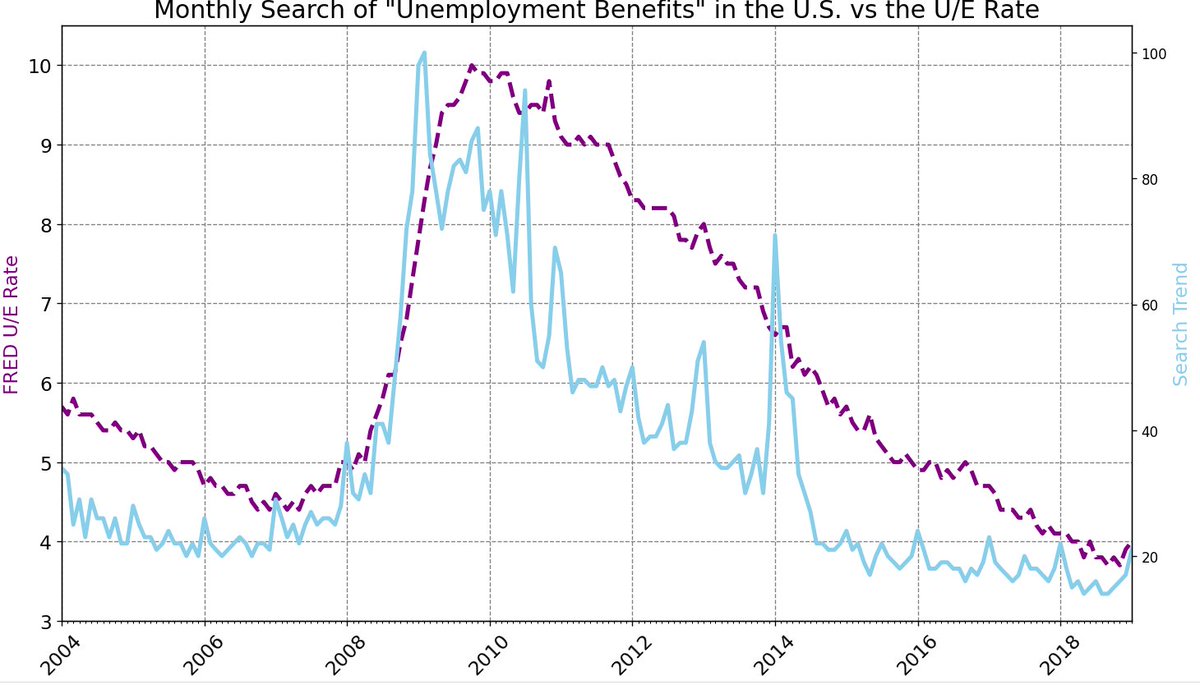
Day 74 - Today I used Pandas more I used describe, resample, isna().values.sum() . Used matplotlib to draw more graphs and style them.
#100DaysOfCode#PythonLearning
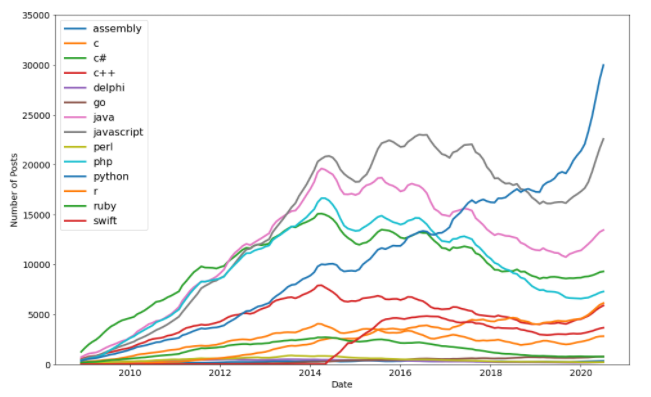
Day 73 - Today I used Pandas more I used groupby, count, value_counts, list slicing, agg, rename and more. Also used matplotlib again to create scatter and bar charts.
#100DaysOfCode#PythonLearning
Day 72 - Today I used Pandas more I used groupby, worked with timestaps, used pivoting, worked with date-time and used matplotlib to create graphs!
#100DaysOfCode#PythonLearning
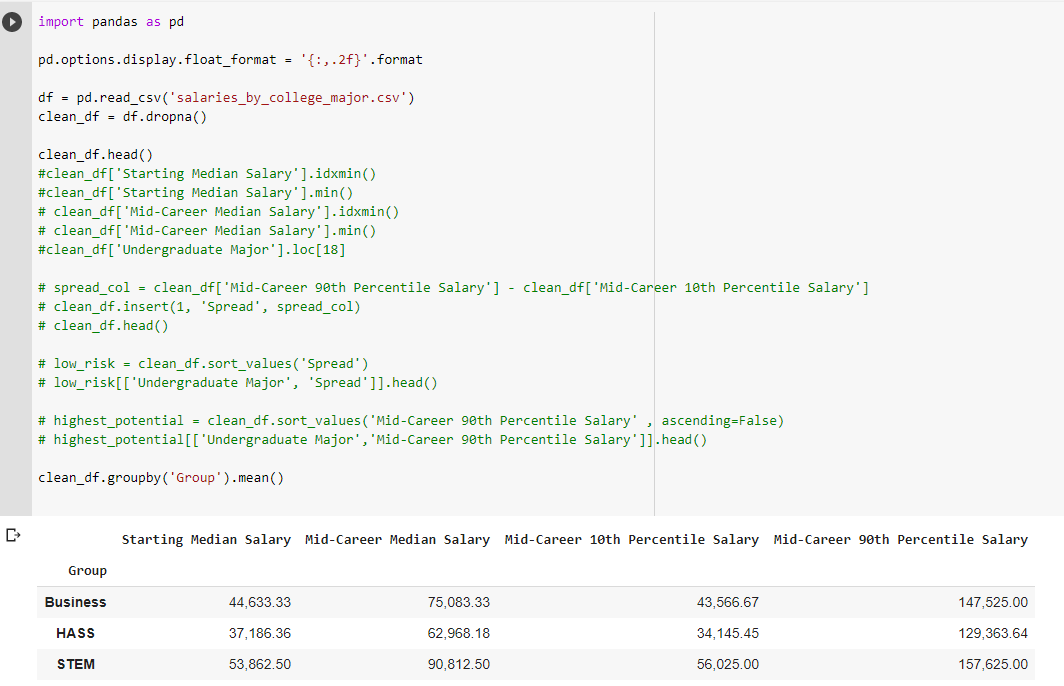
Day 71 - Onto the data analytics / data science section for the next 10 days. Today I used Pandas to explore data in a data frame. I accessed columns and individual cells. Sorted values and added columns. Grouped and pivoted data.
#100DaysOfCode#PythonLearning
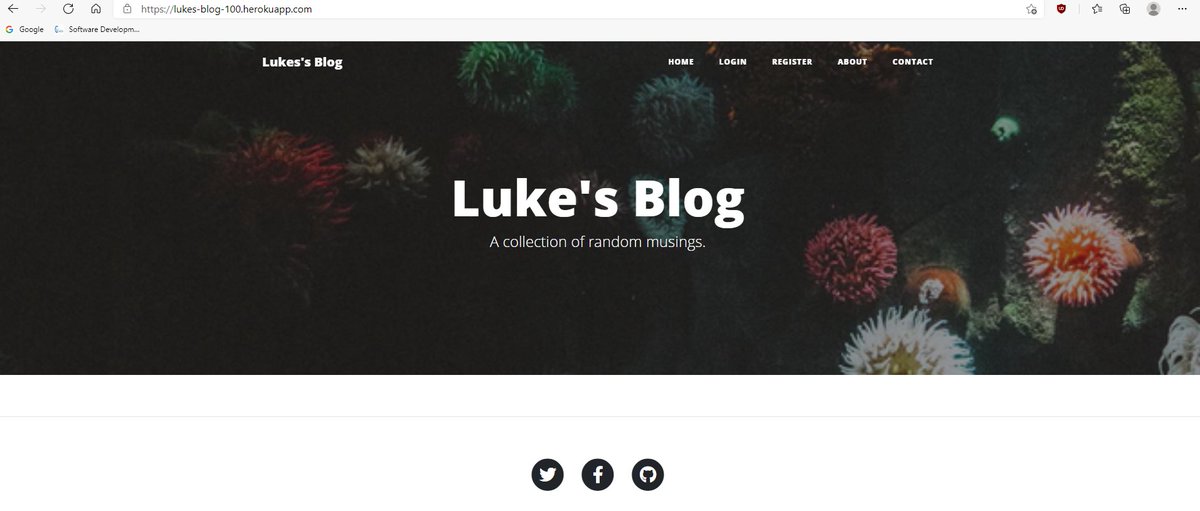
Day 70 - Launched the blog website using Heroku. Have now built a web app from scratch and launched it live. Really good grasp of the Flask framework now. Will be revisiting again to create my own website soon!
#100DaysOfCode#PythonLearning
Day 69! Upgraded the blog website. Now users can register and log in to the blog site. There are admin users and normal users. What you see and can do depends on what account you have which is cool! I'm getting very good with #Flask framework🧐
#100DaysOfCode#PythonLearning
@billions_diary@100xcode I bought a course on udemy here https://t.co/cdLEwkaVmT
The lecturer gives you loads of projects to complete to learn python but starts from the basics. The end goal is you're given ~20 projects to complete by yourself using everything you learned and can be used for a portfolio
Day 68! Learned about encryption, hashing, salting. Created a small web app using Flask that handles user logins/registrations and what you have access to once logged in.
#100DaysOfCode#PythonLearning