IT professional. 0 direct carbon & air pollution home 2011 to 2015 & 2024 - onwards. Electric car driver since March 2011. Heat pump installed Dec-2024.
When will GB electricity prices fall?
I asked ChatGPT at what percentage of gas generation GB power prices start to drop and when that happens. The answer is from 2028.
Gas still sets UK power prices most of the time even though it was only about 26.8 percent of generation in 2025. That keeps bills tied to volatile fossil markets. The shift comes when gas falls into the 10 to 15 percent backup range and when renewables and storage begin to set the marginal price instead.
Wind rises from 28 percent in 2023 to about 52 percent by 2030. Storage grows from 7 GWh in 2023 to about 100 GWh by 2030 which is about 12 percent of daily demand. Gas falls from 33 percent to about 8 percent by 2030 and then drops to about 5 percent by 2032. At that point gas no longer drives wholesale prices.
Projects like Thurrock which combines a 300 MW 600 MWh battery with 450 MW of flexible engines show the direction of travel. Clean. Reliable. Flexible.
Wind is now the UK’s cheapest new power. With storage it will undercut gas entirely. Ninety five percent clean power by 2030 is credible. It is practical. It is affordable. It is already underway.
The blue band in the chart marks the point where gas falls below the level that sets prices which is when GB electricity prices will start to decline.
#NetZero #Climate #Energy #EV #HeatPump #BESS #CleanPower #OffshoreWind #UKEnergy
@MalcolmGrimston@NeverRemem33961@7Kiwi If we had done nothing atmospheric CO2 concentrations would be higher today than if we had done nothing. We are starting to bend the curve ⬇️
That’s one of the things the fossil fuel industry is hoping to leverage to delay climate action.
The disinformation that the UK is working towards net zero in isolation to the rest of the world.
You might like this excellent documentary on how Exxon’s own scientists accurately predicted the climate warming we’re seeing today back in the late 1970s & early 1980s but the company buried the data and publicly denied human / fossil fuel combustion driven climate change to keep the profits rolling in. https://t.co/COopS5ThNu
Very impressed with the @VodafoneUK 5G speeds I’m getting around the Heath Charnock / Anglezarke area at the Yew Tree Inn.
635 Mbps down and 49.5 Mbps up. That’s the fastest download speed I’ve ever seen on Vodafone 5G using my iPhone 15 Pro Max. I’m line of sight of the mast but still. Red circle on the photo.
That’s genuinely into fibre broadband territory!
2 of 2
There’s another major British problem too: gas.
Gas-fired generation frequently sets Britain’s marginal wholesale electricity price. That means expensive internationally traded gas can determine the wholesale price even when much of our electricity is being generated by cheaper low-carbon sources.
That’s precisely why expanding renewables, storage, interconnection and transmission matters. The objective is to progressively reduce both gas utilisation and how often expensive gas sets the electricity price.
Your “plaster decent farmland in Chinese solar panels” claim is similarly exaggerated.
Even if all the additional solar capacity in the Government’s high-end 2030 scenario were ground-mounted, it would occupy no more than about 0.6% of UK utilised agricultural land.
So yes, building a modern electricity system costs money.
So did building the original electricity grid, gas network, roads, railways, telephone system, water network and every other piece of national infrastructure we now take for granted.
If we’re going to judge national infrastructure by putting decades of cumulative expenditure onto scary red clocks, let’s put all the clocks next to each other.
1 of 2
That £228 billion figure looks dramatic on a giant red clock, but cumulative infrastructure figures are a pretty poor way of judging whether something represents good value.
Your own graphic explicitly says it includes estimated indirect costs, whereas the Subsidy Clock’s normal headline keeps those separate. Its current direct renewable-subsidy run-rate is about £12.3 billion a year, only around 0.4% of UK GDP.
Now put that into perspective. UK general government infrastructure investment was £30.8 billion in 2025 alone, around 2.5 times the current annual direct renewable-subsidy bill.
Yet instead of showing the annual cost alongside the size of the economy or other infrastructure spending, your graphic accumulates more than two decades of expenditure into one enormous £228 billion counter.
You could make almost any national infrastructure programme look terrifying that way.
So perhaps we should build some more scary clocks.
How much did it cost, in today’s money, to build Britain’s original electricity grid and connect virtually every home and business? Or the gas network, landline telephone network, water and sewerage systems, roads and railways?
Put more than a century of those costs onto giant counters ticking upwards every second and the numbers would be astronomical too.
Infrastructure costs money. The meaningful questions are what it costs relative to the economy, what we get in return and what the alternatives cost.
And what did this investment achieve?
British grid carbon intensity fell from around 529 gCO₂/kWh in 2013 to about 125 gCO₂/kWh by 2024, roughly a 76% reduction in eleven years.
Coal still supplied around 39% of British electricity in 2012. By 2024 it supplied zero, with Britain becoming the first G7 country to phase out coal-fired electricity. More broadly, UK emissions have fallen faster than any other G7 country’s since 1990 while the economy grew substantially.
So the money on your scary clock didn’t disappear. It helped finance one of the fastest electricity-system decarbonisations in the developed world.
That’s quite an important bit of context to leave off the clock.
Renewables have received subsidies. Nobody needs to pretend otherwise. Governments supported them while technologies scaled and costs fell. Modern Contracts for Difference also work both ways: below the strike price the generator receives a top-up, but above it the generator pays money back.
And maintaining fossil backup does not mean operating “two complete electricity systems”. You’re confusing capacity with utilisation. We can retain dispatchable capacity while running it progressively fewer hours as wind, solar, nuclear, storage, interconnectors and demand flexibility provide more electricity.
Gas also requires fuel every time it generates. Wind and sunlight have a fuel cost of £0/MWh.
Finally, Britain does not have “the highest energy bills of any developed nation on Earth”. UK domestic electricity prices are high, around fourth-highest in Europe in recent comparisons, but they are not uniquely the world’s highest.
Britain’s exceptionally high industrial electricity prices are a different issue. Industrial bills include wholesale electricity, network charges, taxes, levies and policy costs, and countries make political choices over who pays them.
France, Germany and others have historically shielded energy-intensive industries from more of these costs. Britain loaded more onto industrial consumers and is now partly reversing that through the British Industry Supercharger, including 90% compensation for eligible network charges.
@pmavrodiev@DrEliDavid@brett7three The RTC project in Abu Dhabi is specifically designed to provide 24/7 clean electricity by combining 5.2 GW of solar with 19 GWh of battery storage. A project of this scale would have seemed almost unimaginable a decade ago. https://t.co/TF1SAC4I5q
Nice change of subject. 😂
Your claim was that Net Zero is “dead globally” and that grid-scale storage is impractical and unaffordable.
I then showed you a 5.2 GW solar + 19 GWh battery project being built in Abu Dhabi specifically to deliver up to 1 GW of renewable electricity 24/7.
Now you’ve switched to asking whether lithium batteries alone could run the whole of Britain through a two-week winter dunkelflaute.
Nobody claimed they could.
A future British grid isn’t designed around “14 days of batteries”. It uses a mixture of geographically dispersed wind and solar, nuclear, interconnectors, short-duration batteries, long-duration storage, demand flexibility and dispatchable backup.
Batteries handle hours and daily balancing extremely well. Longer-duration technologies and backup deal with the rarer multi-day shortages.
And the delicious irony is that the project you’re dismissing is being built in the UAE, an oil-producing Gulf state with an official Net Zero 2050 Strategy.
So perhaps go back to your original claim: how exactly is Net Zero “dead globally” when countries outside Europe are investing billions in precisely these technologies?
Ah, I see. Your profile literally says “Vaccines are poison. All of them.”
That rather puts your dismissal of established scientific evidence and sources such as Our World in Data into perspective.
For the record, the air pollution figures aren’t theirs anyway. They’re based on published scientific research, and the WHO independently estimates that air pollution causes around 7 million premature deaths each year.
You’re also describing fossil hydrocarbons as “renewable”. They take millions of years to form and we consume them vastly faster than geological processes replace them. That is literally why they are classified as non-renewable.
I think I’ll stick with the scientific evidence. 👍 🤪
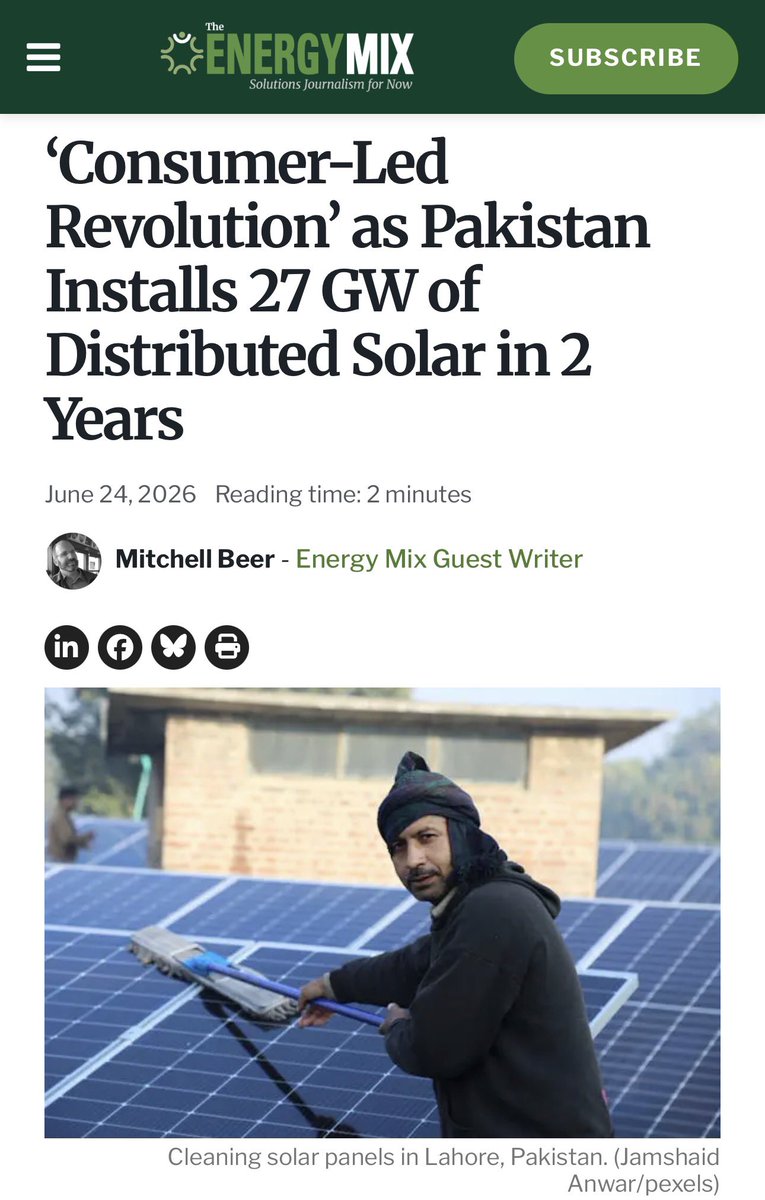
Indian rooftops shining bright: 'India’s rooftop solar scheme surpasses 5 million households'.
"India’s Ministry of New and Renewable Energy says the country’s rooftop solar program has commissioned 14.8 GW of rooftop solar capacity across over 5 million households."
Note that: "1.9 million households are now reporting zero electricity bills".
#India #RenewableEnergy #SolarPower #NetZero
https://t.co/6TlTBANRbf
@NeverRemem33961@7Kiwi The RTC project in Abu Dhabi is specifically designed to provide 24/7 clean electricity by combining 5.2 GW of solar with 19 GWh of battery storage. A project of this scale would have seemed almost unimaginable a decade ago. https://t.co/TF1SAC4I5q
Imaginary? China’s CO₂ emissions were flat or falling for 21 months from March 2024, and fell slightly overall in 2025.
They did rise again by about 2% in Q1 2026, largely because a lot of new wind and solar was being curtailed rather than used, so nobody sensible is claiming the transition is complete.
But the structural change is very real. In the first half of 2026 coal fell below 50% of Chinese electricity generation for the first time, down from 65.5% in 2016, while renewables reached 41.2% and wind plus solar 24.6%.
China is still the world’s largest CO₂ emitter and still burns far too much coal. But pretending the slowdown in emissions growth and the enormous shift towards clean electricity simply aren’t happening isn’t “showing reality”. It’s ignoring it.
Can you see the rather large Statista logo in the bottom right? 😂
It also gives the source underneath: Energy & Climate Intelligence Unit. So no, I didn’t “shit this out with AI”.
And yes, countries such as Gabon can genuinely be net zero or net negative. Net zero does not mean producing no CO₂. It means greenhouse-gas emissions are balanced by removals.
Gabon emits relatively little but has vast tropical forests that absorb enormous quantities of CO₂. Its official UN climate submission reports that it is a net absorber of around 100 million tonnes of CO₂e a year, with its forests removing substantially more carbon than the country emits.
Madagascar has also historically been a net carbon sink for the same basic reason: relatively low emissions combined with very large land and forest carbon sinks, although deforestation has weakened that sink.
In fact, most African countries contribute very little CO₂, particularly per person, compared with wealthy industrialised countries.
So the map isn’t claiming they produce zero emissions. That’s literally what the “net” in net zero means. 😂
@TerryHaffnerMD@donald_duc89520@robinmonotti You really do live in an alternate reality.
Air pollution from fossil fuel combustion is responsible for around 8 to 9m premature deaths per year. 🤦♂️
I’ve now completed 12 months on the Octopus Outgoing solar export tariff.
Over the full year:
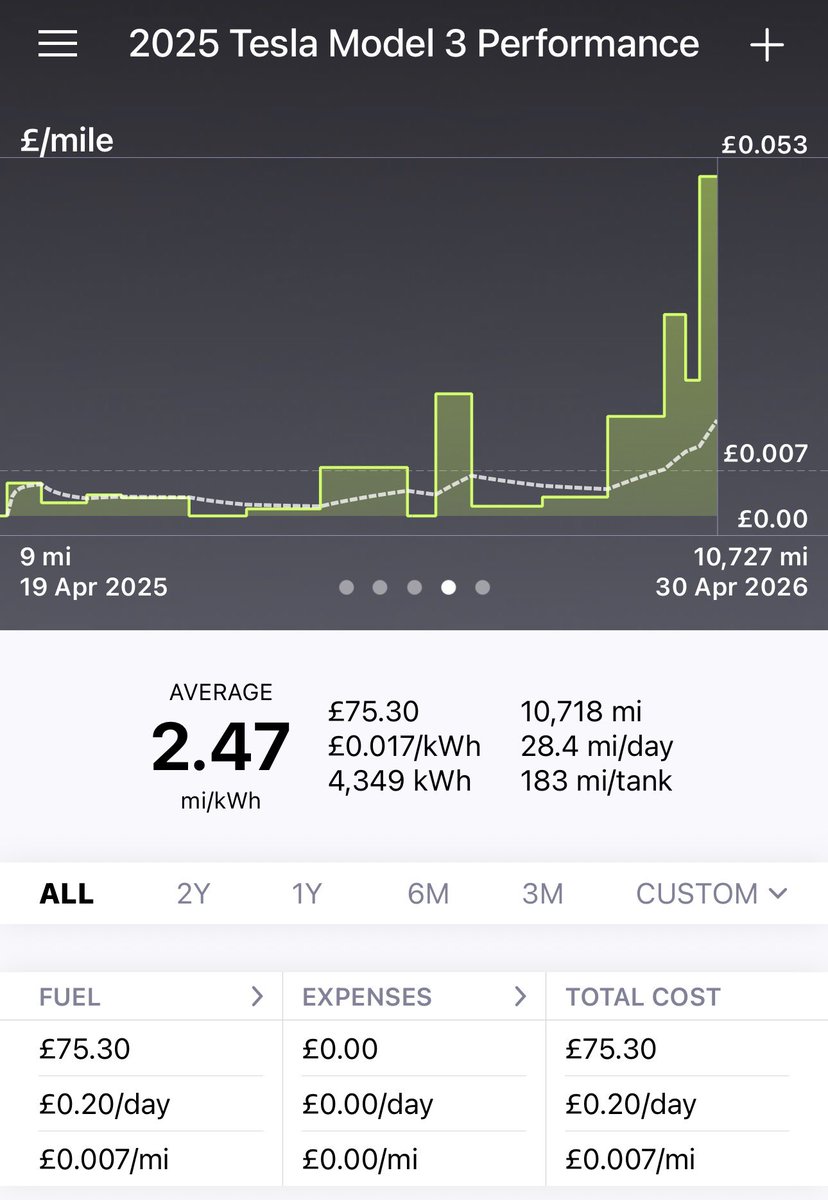
• £536.89 total grid electricity cost
• £803.27 solar export revenue
• +£266.38 net from import vs export
• +£331.28 actual account credit (after direct debit and credits)
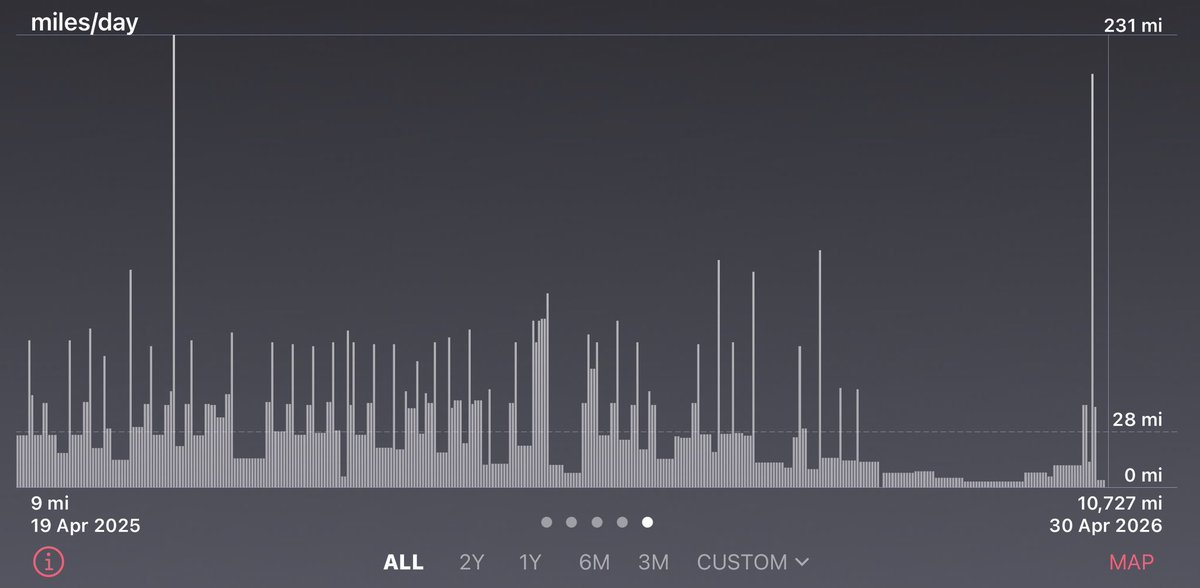
This covers all home energy use, including heating, hot water, cooking and ~10,700 miles of EV driving.
This is not just solar generation. It is a combined system:
• Solar PV
• Home battery
• Heat pump
• EV
• Smart meter
• Time of use tariffs
Working together as a single system.
From February 2026 I switched to working from home full time, reducing mileage and removing access to free workplace charging.
Despite this, and a ~20% export tariff reduction (15p to 12p on 1 March 2026), the system still delivered a net positive energy balance.
EV charging sessions over the year:
• 65.7% workplace (free)
• 29.3% home (overnight off peak)
• 3.6% free Tesla Supercharging
• 1.4% other public / destination
Even with the shift towards more home charging later in the year, overall energy costs remained negative.
Working from home also removed a 72 mile daily commute, reducing time in traffic, stress and exposure to air pollution, while maintaining a net positive energy position.
This is what happens when you electrify everything and optimise the system around tariffs and storage.
#NetZero #Energy #Solar #HeatPump #EV
Yes. Of course they do. 🤷♂️
South Africa 2050
Nigeria 2060
Ghana 2070
Malawi 2050
Liberia 2050
Cabo Verde 2050
Seychelles 2050
And several African countries already absorb as much or more CO₂ than they emit.
It’s also worth remembering that most African countries emit very little CO₂, particularly per person, and have contributed very little to historical global emissions compared with wealthy industrialised nations.
Net zero is a global objective, but that doesn’t mean every country starts from the same place or carries the same historical responsibility.