Coded every political party across all elections in advanced countries since 1868. Here are a few charts: 1) Vote shares across nine party families, average distribution.
For anyone looking to get lost in an adventure over the summer, I highly recommend Candice Millard's The River of Doubt—Roosevelt’s story of exploring an unknown Amazonian river. I'm about halfway finished and I can't put it down.
@david_perell Was obsessed with this topic several years ago and I think you’re right: Globalization (mass standardization) is the likely culprit. For those interested, I thought this article did a great job of fleshing out its causes and illuminating its effects: https://t.co/seLM1UYD4b
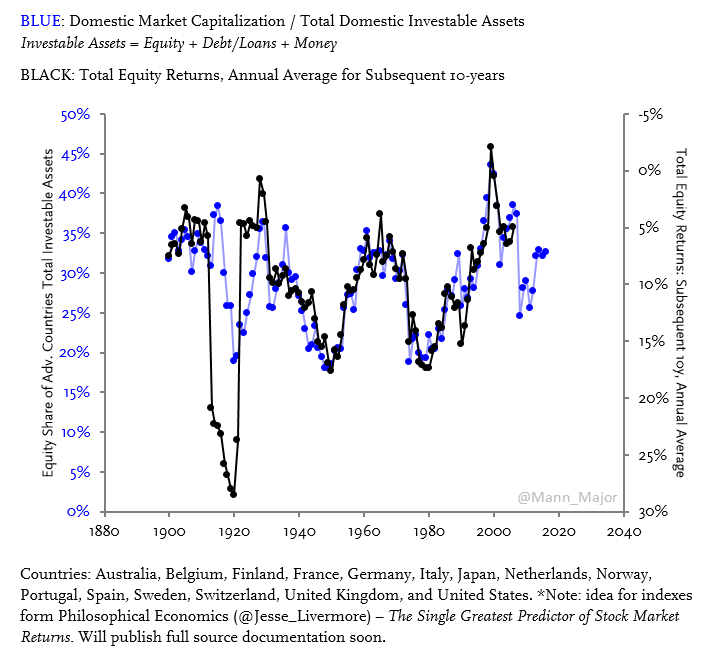
Applied Jesse Livermore's (@Jesse_Livermore) Average Equity Allocation concept to 15 other advanced countries (1870-2016). Results are preliminary, but thus far the correlation between equity share of investable assets and future returns are tight across time/countries.
Coded every political party across all elections in advanced countries since 1868. Here are a few charts: 1) Vote shares across nine party families, average distribution.
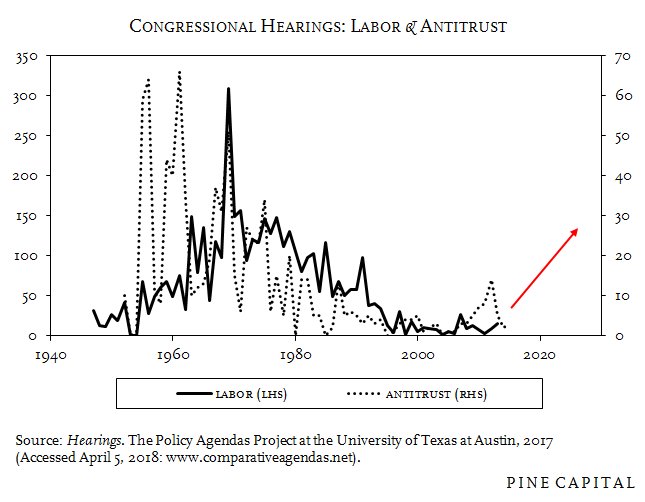
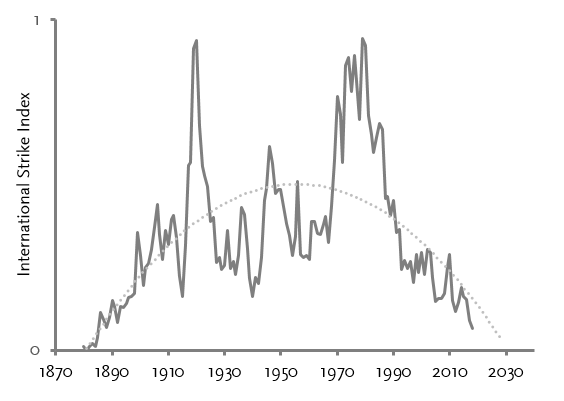
11) Average position of majority parties/coalitions for all developed countries. Per this chart, we're exactly where we were a century-ago. Would expect to see tide to shift towards pro-labor from here.
Never in American history has technology displaced so few and scared so many. See chart: rate of occupational change (job churn) by decade, 1850 to 2015.
@gcallonico Would if I could, Guillaume. Regrettably never did a full write-up on this, just summarized my findings for a few folks. Happy to send sources/data, feel free to DM.
The Global Populism Index is complete - covers ~1,000 elections across ~30 countries (ideological break-down below). Three good bets: (1) populist vote share will remain high; (2) left-wing version likely to take share from right; and (3) we'll stop calling everyone 'populist'.
Prof. Mark Blyth and I teamed up w/ an AI firm to build a model that predicts when/why economic regimes break down and see what effects this has on politics. Would love to present findings at SXSW next year, but need your vote to make it happen. Thank you! https://t.co/iomPVKBhDd
@OrigenOfSpices It's not, used a variety of different sources (e.g., CHES) as the spatial mapping w/ platforms (CMP) requires a lot of work in terms of proper scaling; below is the same chart w/ (most) post-1945 parties mapped via platforms.