🌐 Inversor apasionado | 📈 Analista de acciones
Aviso: mis publicaciones no constituyen recomendaciones de compra o venta. Haz siempre tu propio análisis.
Learnings and conclusions from this week’s charts:
1. Tech stocks (particularly software) remain under pressure.
2. Investor exposure to tech is at historically elevated levels.
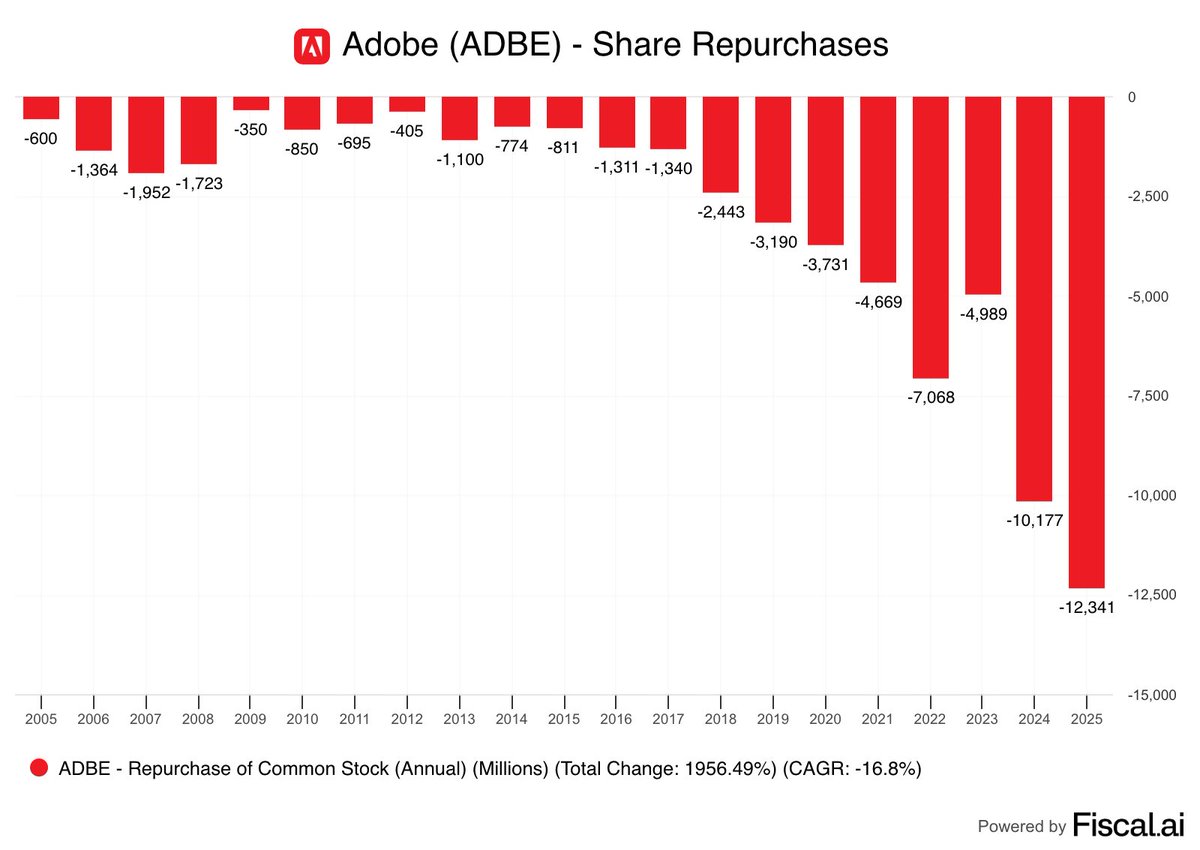
3. Surging tech capex is coming at the cost of buybacks.
4. Private equity stocks are also coming under pressure.
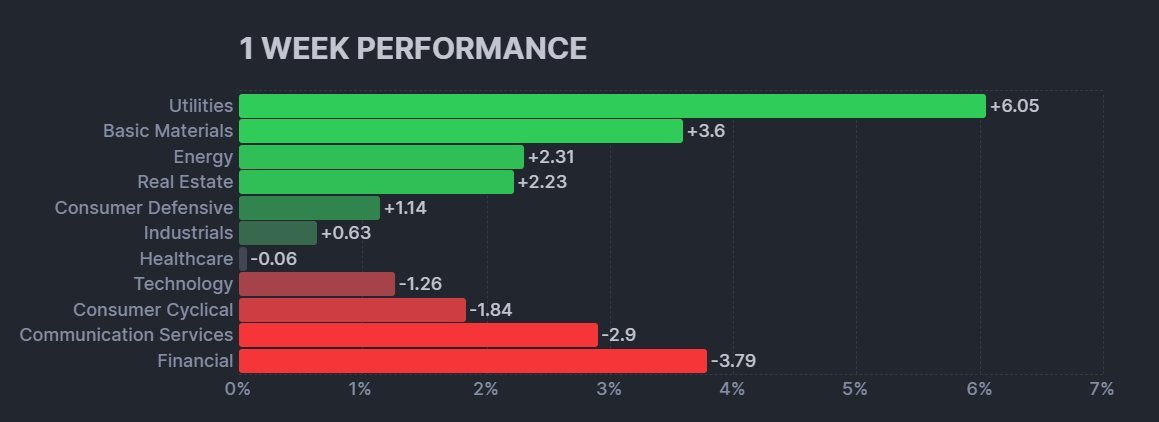
5. Defensive stocks meanwhile are looking up.
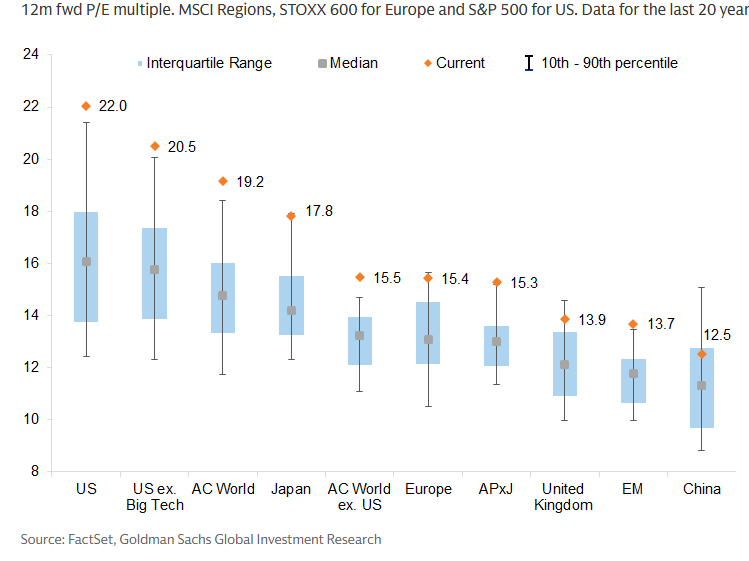
Overall, it’s fair to say that we are at a challenging juncture in markets. Tech stocks are coming under pressure, and from a starting point of major overvaluation and historically high allocations.
So it’s worth keeping a closer eye on risk management and potential upside in defensives, while staying pragmatic with the otherwise still bullish outlook for cyclicals/global/commodities…
(click through to charts 👇)
$SPX $SPXEW $SPY $ES_F $VIX $QQQ
El mercado busca los que se benefician de las construcciones de los centros de datos que además son defensivas. Queda muy clara la idea al ver este gráfico semanal.
Cierre en video
En la última encuesta de BOFA sobre grandes gestores de fondos se ve el nivel de cash más bajo desde 1999, por lo que están muy expuestos y tienen poca liquidez para meter más dinero.
https://t.co/oeLjPvMS56
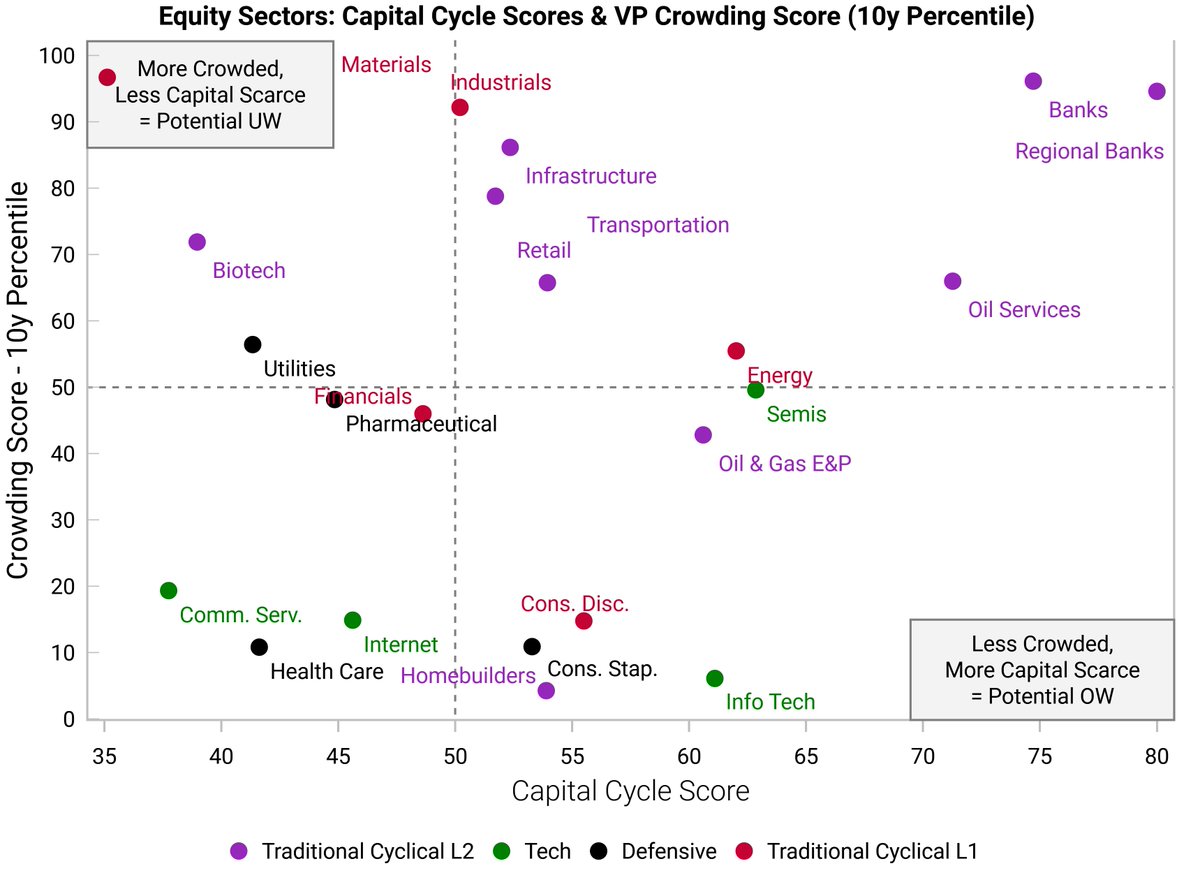
The best time to invest is when a sector is uncrowded while being aligned to the capital cycle. We have seen some notable shifts over the past 3 months in our crowding and capital cycle scores:
1. Crowded Cyclicals:
There has been a big jump in crowding for cyclical sectors like Banks, Industrials, and Materials. The "reflation" trade has quickly become the consensus view. This is not itself a reason to sell, but it does suggest the next leg higher is increasingly reliant on the continued improvement in the economic data.
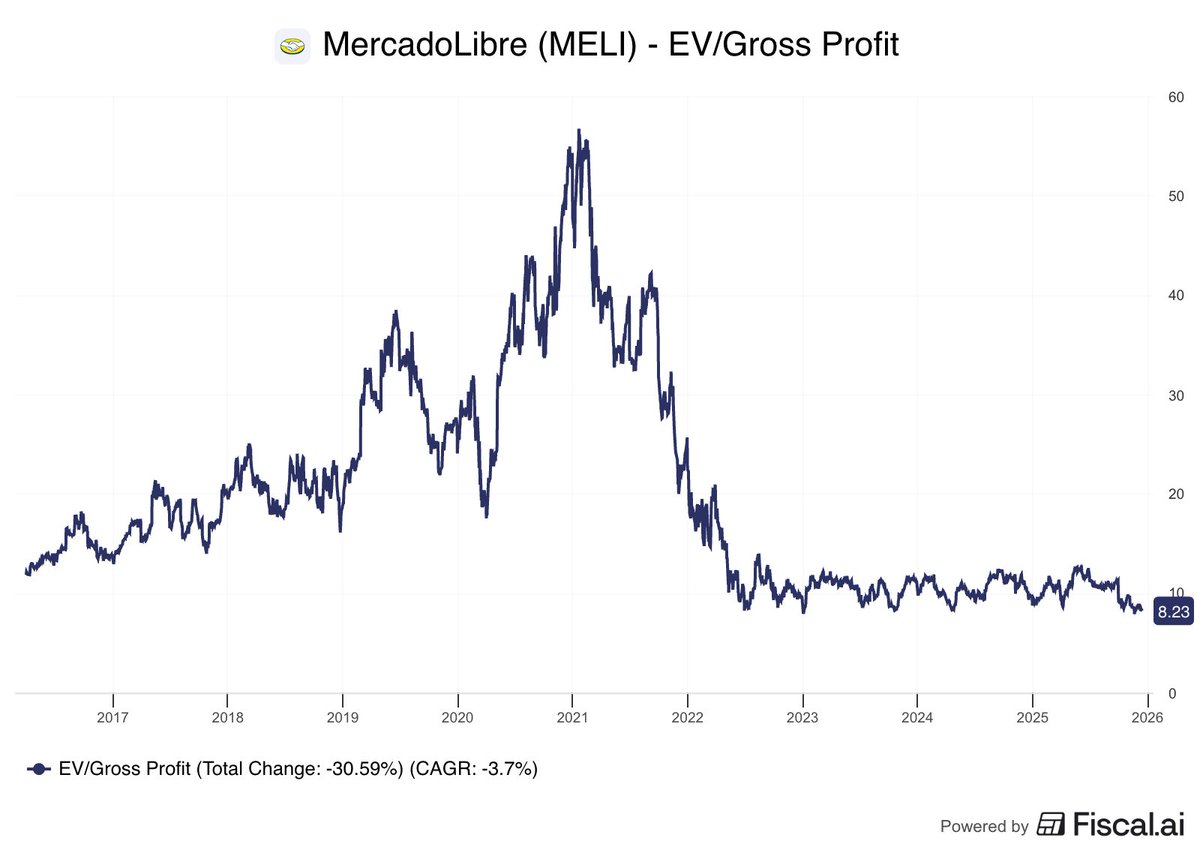
2. The Tech Anomaly:
Surprisingly, tech remains relatively unloved. Tech's capital cycle score also remains favorable, because the marginal returns on investment are holding up and are still exceeding the cost of capital. This suggests tech remains a good place to look for growth at reasonable valuations.
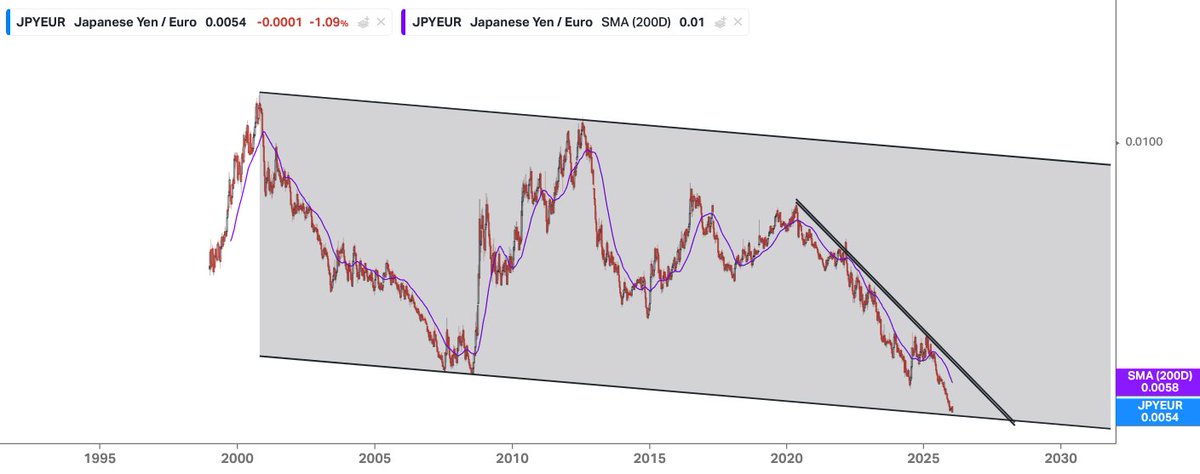
El EUR/JPY está en una de sus mejores relaciones históricas para invertir en empresas japonesas baratas 🇯🇵📉
Recordemos: en crisis, el yen actúa como activo refugio 🛡️ (acreedor global + unwind del carry trade).
📊 Valoración + divisa = combo explosivo 🚀
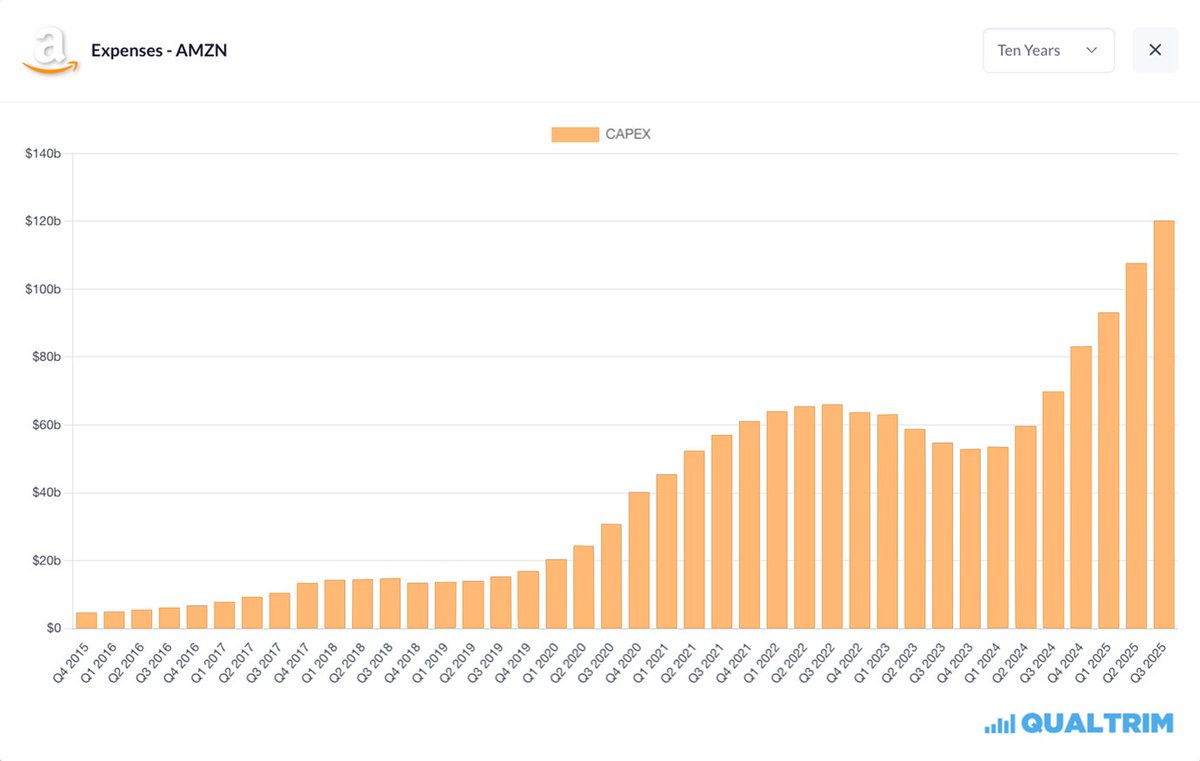
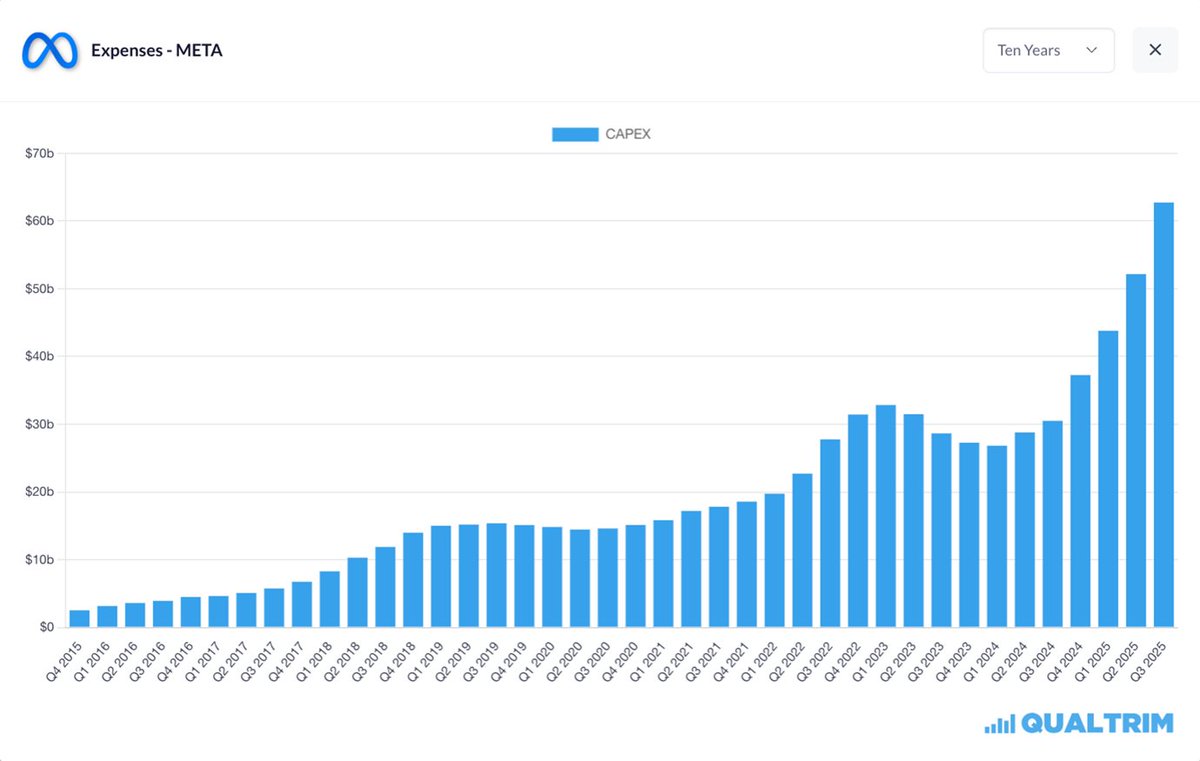
There is a price for the AI revolution – and it’s being paid in CAPEX.
Since Q1 2024...
Microsoft: +74.52%
Google: +105.09%
Amazon: +124.76%
Meta: +133.86%
Big Tech is no longer CAPEX-light.
$MSFT $GOOGL $AMZN $META
Most people remember the late-1990s equity bull market as ending in March 2000. But, in fact, non-tech stocks continued to climb for another year before finally succumbing to the throes of the 2001 recession. Are we heading for another "great rotation" in the months ahead?
🚨 Las big tech se están endeudando como nunca por la carrera de la IA
• El 95% de los proyectos de IA generativa no generan retorno.
• Aun así, Apple, Meta, Alphabet, Amazon y Oracle han consumido 280.000 M$ de su caja en 10 años.
• La deuda asociada a IA ya supera 1,2 billones de dólares.
• Los diferenciales de crédito suben: el mercado empieza a cobrarles el riesgo.
• Solo unos pocos ganan de verdad: Nvidia dispara su caja un 1.935%.
👉 La IA está cambiando el modelo de negocio de las big tech:
más deuda, menos caja… y mucha presión por demostrar resultados.
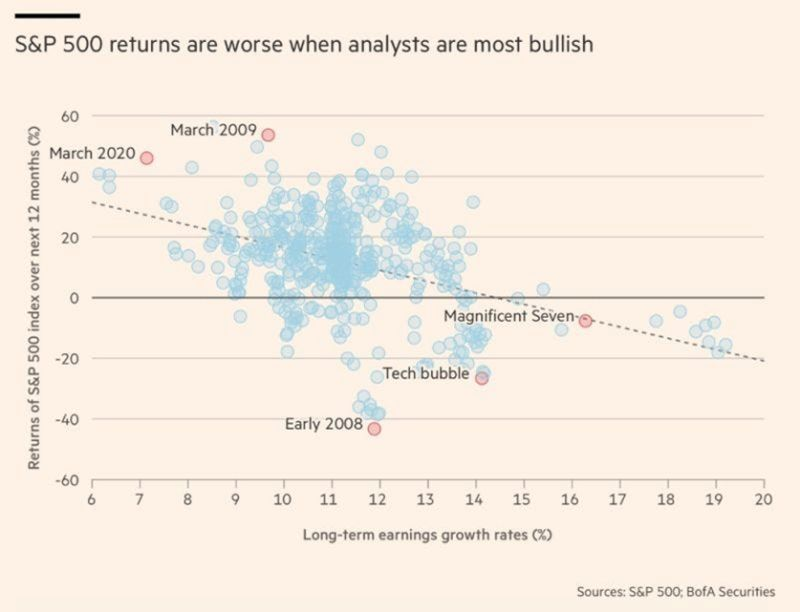
Fundamentals vs Technicals...
What if I told you one of the most fundamental of fundamentals: earnings growth, was actually working more like a technical indicator?
Turns out Analyst consensus earnings expectations function more like a sentiment indicator -- basically giving a contrarian signal rather than a fundamental justification to be bullish or bearish.
from the Weekly ChartStorm: https://t.co/tWARmZFtS6
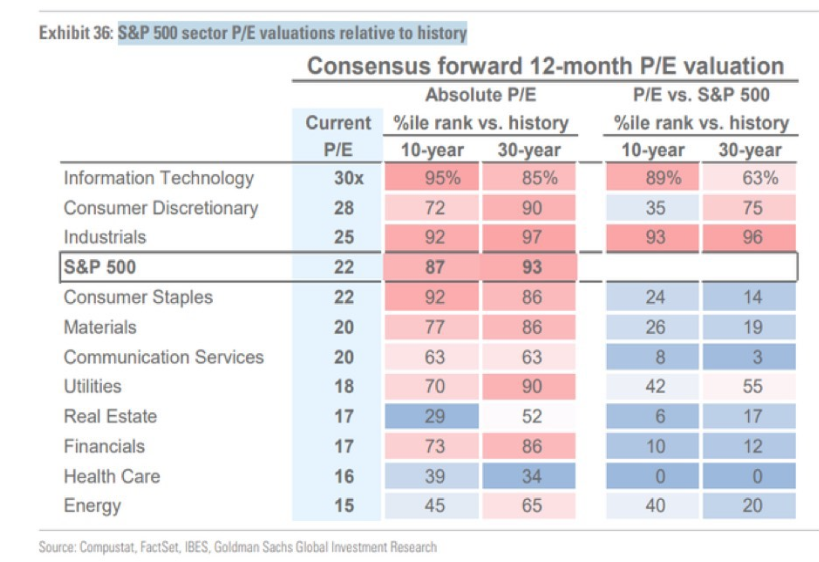
En un entorno de altas valoraciones como las actuales, soy partidario de rotar cartera a posiciones más defensivas como REIT, cuidados de salud y consumo básico por su estabilidad de flujos. Y son los cuidados de salud los que presentan mayor descuento en valoraciones.
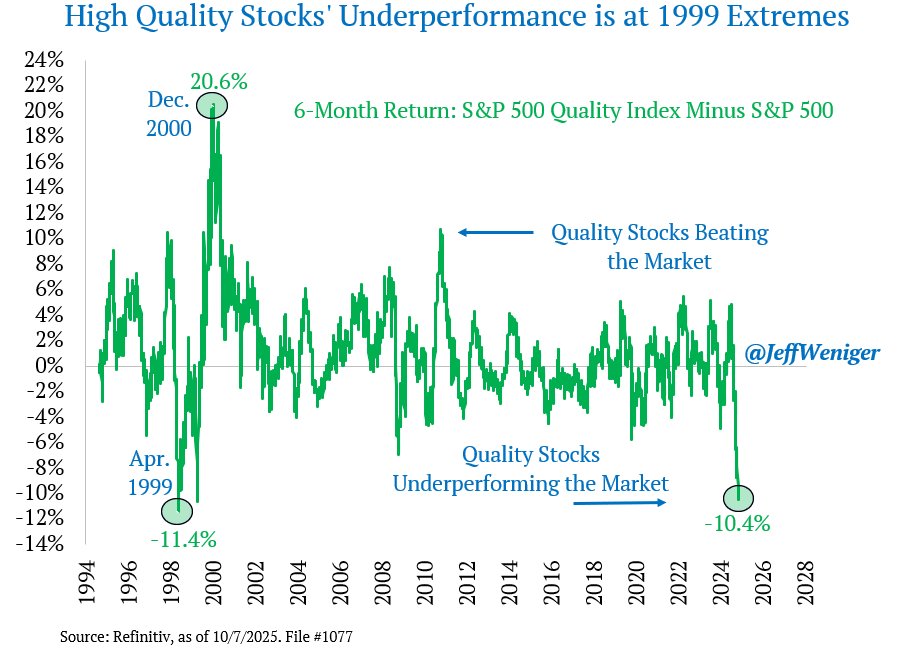
The rally off the April lows has left Quality stocks behind. The S&P 500 Quality Index has lagged the market by 10.4 percentage points over the last 6 months, akin to observations from 1999.
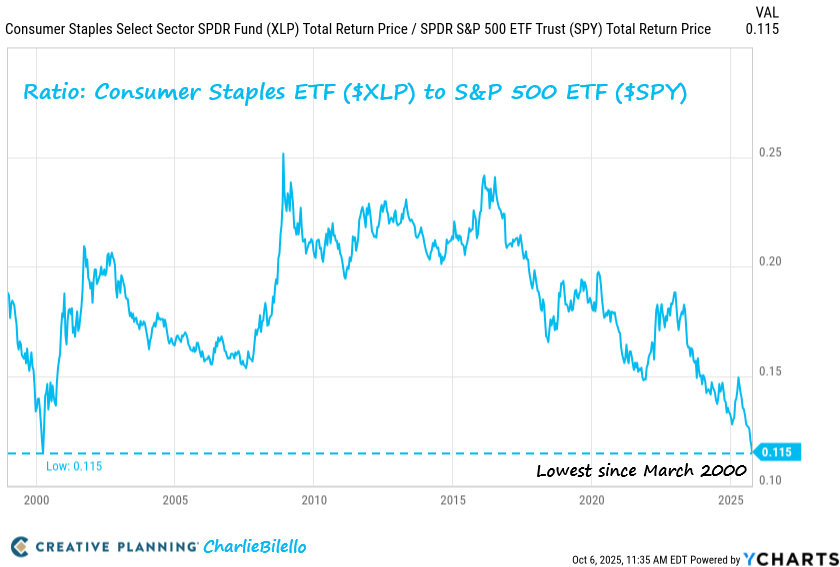
The Ratio of the Defensive Consumer Staples ETF to the S&P 500 has moved down to the lowest level since the dot-com bubble peak in March 2000. $XLP $SPY
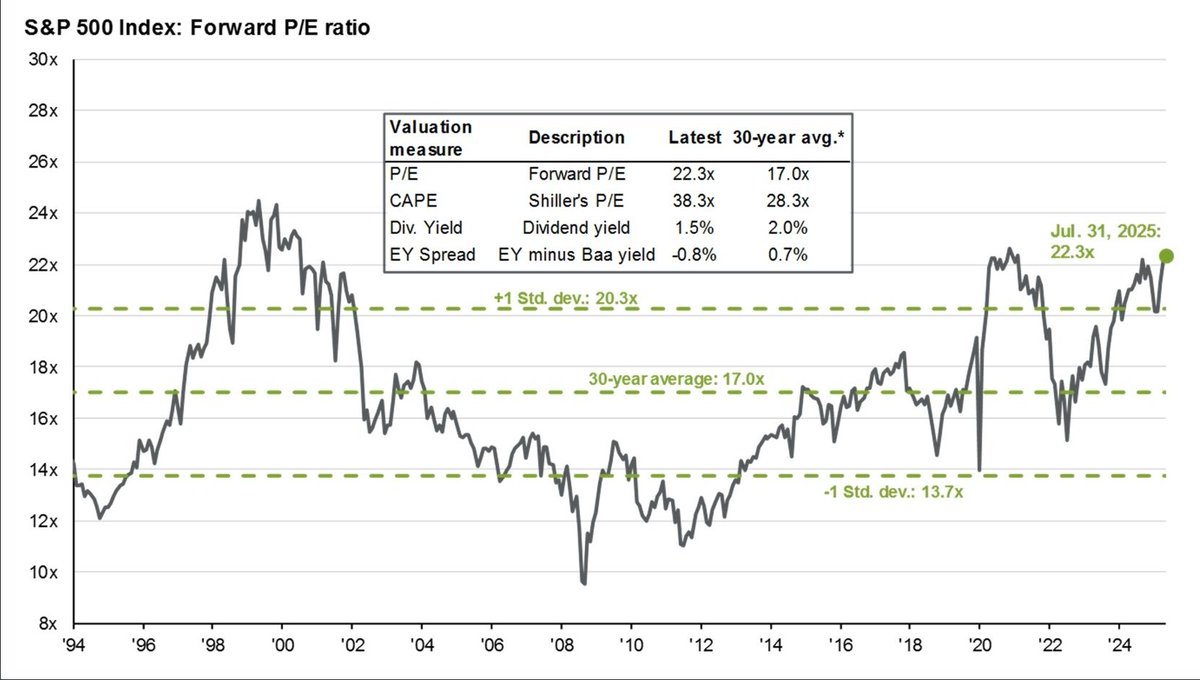
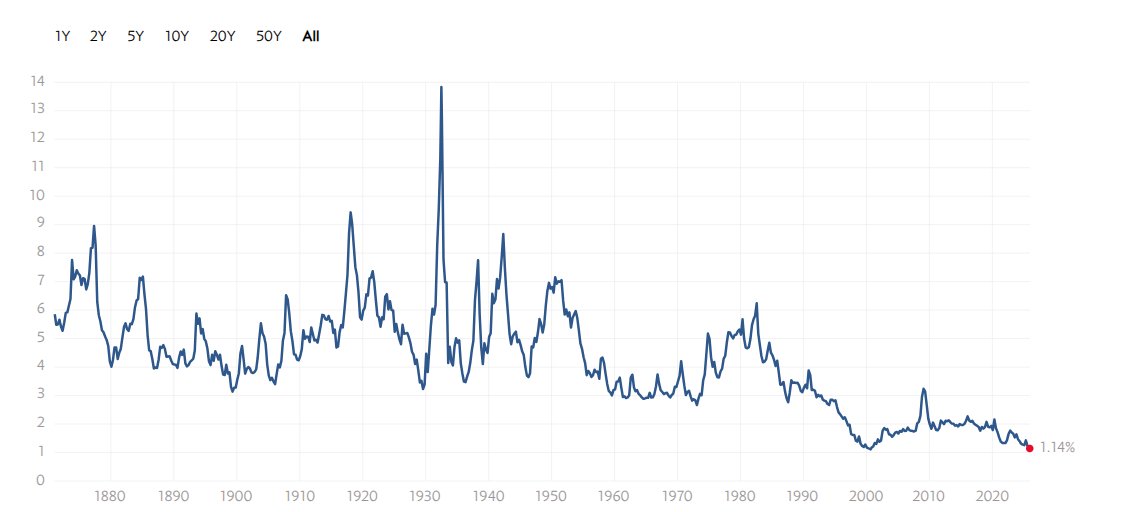
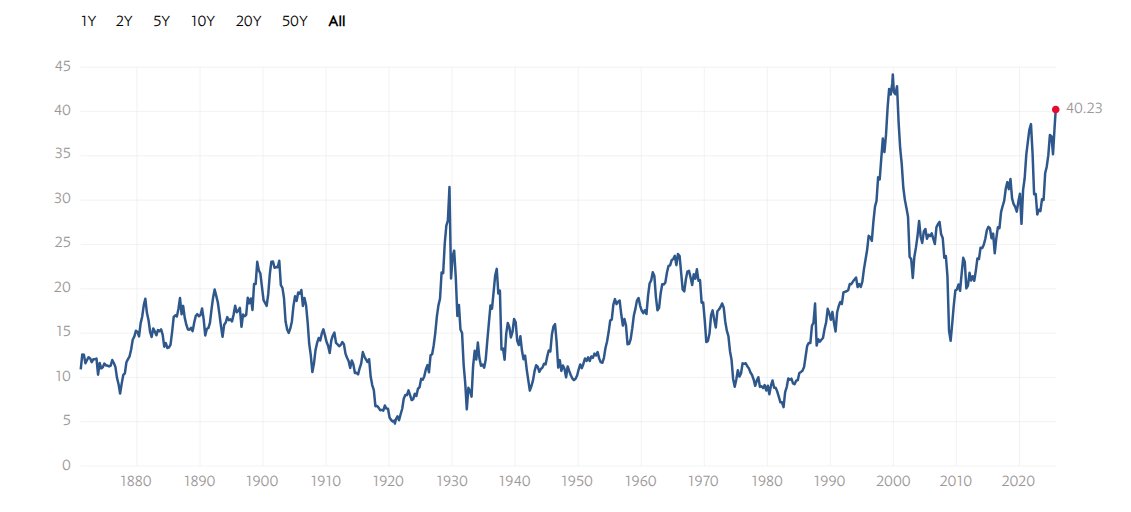
PER de Shiller a 40 veces y 4 puntos de sus máximos históricos de 2000. Tras ello, el Nasdaq se comió un caída por encima del 80% y recuperó los niveles pasados 15 años.
Voy rotando a defensivos...
El único modo de mantener estás valoraciones de burbuja es bajando tipos de interés.
Si no lo hacen, el petardazo que se escuchará en las grandes Tech y valores que cotizan a múltiplos desorbitados llegará hasta Neptuno.
#Powell#nasdaq