@Jamery17@WeatherProf Jakey, I'm so sorry you don't have the capacity to discuss a topic without the need to insult others. I hope you get over that affliction, and good luck!
@Stormyalert Why, when I hear a climate alarmist say, "I'm not exaggerating", do I get the same assurance as when the IRS pays a visit and says, "I'm here to help"?
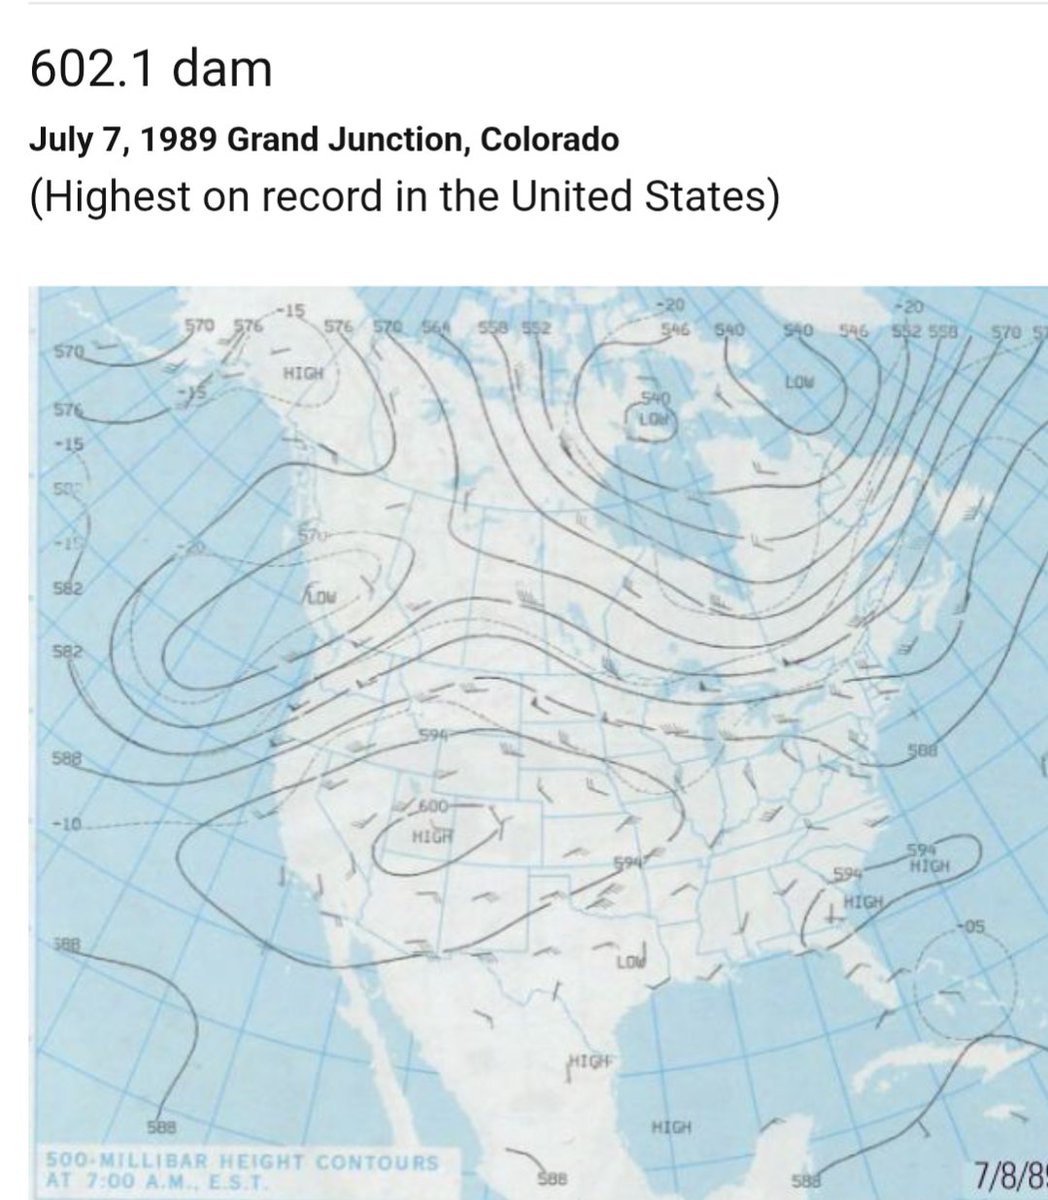
@WeatherProf The latest GFS 500 millibar geopotential height forecast doesn't even have the heights tieing a record, let alone even "shattering" it. The previous record is 6020 meters from 1989, shown on the left. The forecast for this weekend will be between 5940 and 6000 meters.
@WeatherProf For it to break the record, the 500 millibar geopotential height would have to exceed 6020 meters, the highest ever recorded in the US, which occurred in 1989. At this time, it is only forecast to possibly come close to, but not "shatter* it
@WeatherProf Nice hyperbole. But there's no such thing as a super El Nino threshold. El Ninos are categorized as weak, moderate, strong, and very strong. I guess some like to use the term "super" to exaggerate and grab attention.
Depending on the event, everything is being blamed on climate change. First, it's spiked rainfall amounts. Another day, it's drought and wildfires. Another day, it's extreme heat. This meteorologist even once blamed a tornado outbreak, during the height of the severe weather season, on climate change. It has the same effect as inflation. When there is virtually a daily post blaming something on climate change, it diminishes the value of the science phenomena.
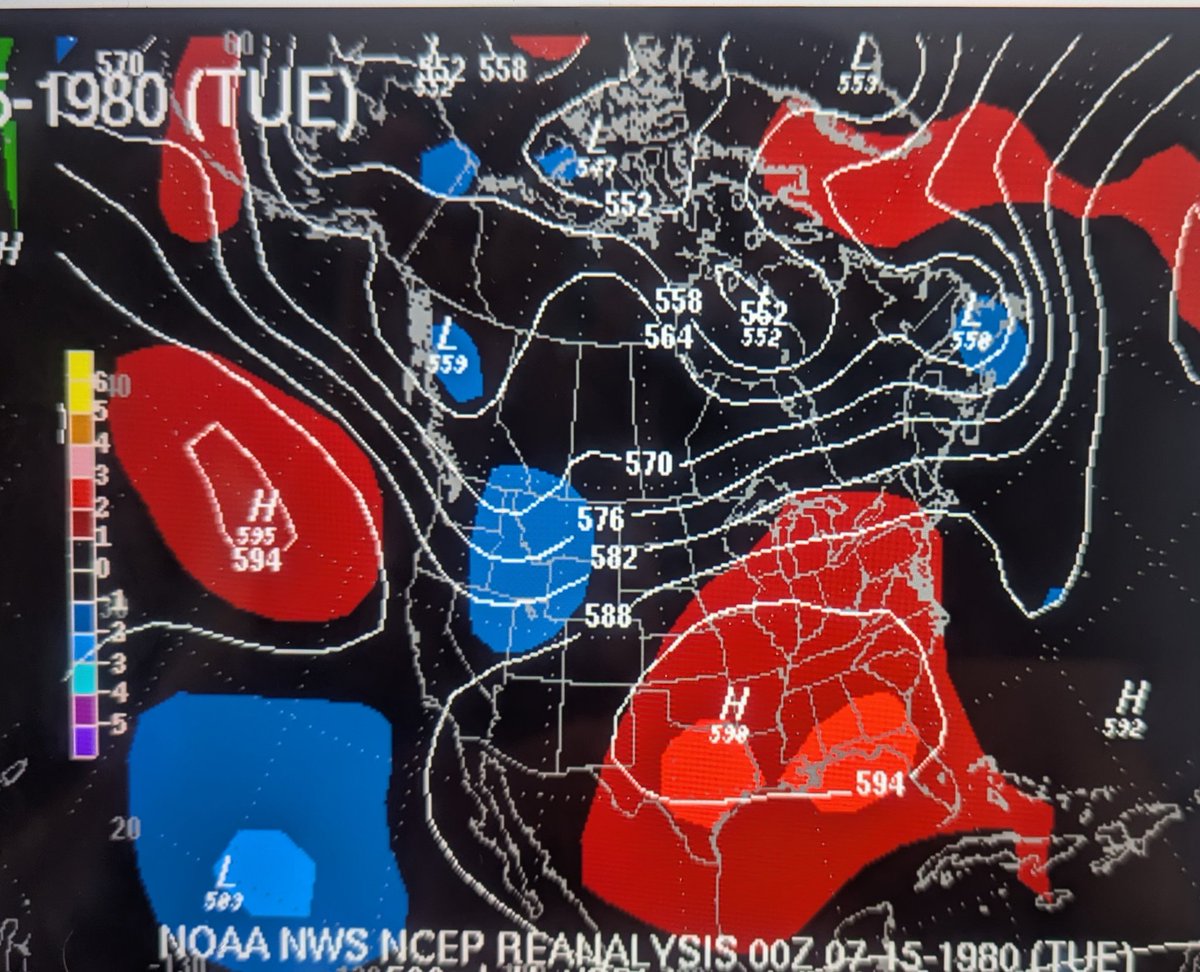
The "Summer of the Heat Dome". This isn't this year. This was July 1980 which featured massive heat domes over the eastern 2/3 of the US, the Pacific, Greenland, and not seen here, Europe. So Heat Domes, meteorologically referred to as upper level high pressure systems, are nothing new, having been around forever, and varying in duration and size.. The term heat dome might be new, primarily exclusively used in journalism, but the phenomena is not new.
@sergemoulinsart@WeatherProf I'm sorry you don't have the capacity to discuss an issue without the need to act like a juvenile and insult others with names. Get well soon and good luck!
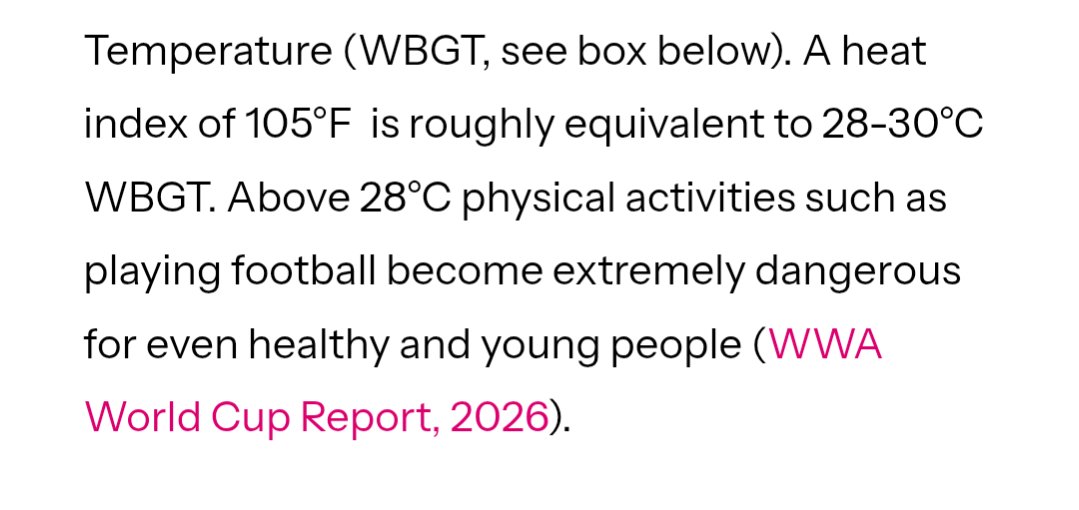
This is a flawed study. According to the author of the study, they're trying to make an equivalence between the Heat Index and the WBGT by saying "a heat index of 105 is equivalent to a WBGT of 28-30C". They can't be compared. The Heat Index only takes into account temperature and humidity, while the WBGT takes into account temperature, humidity, wind, sun angle, and cloud cover. So mathematically, the two numbers are calculated and move independently of one another.
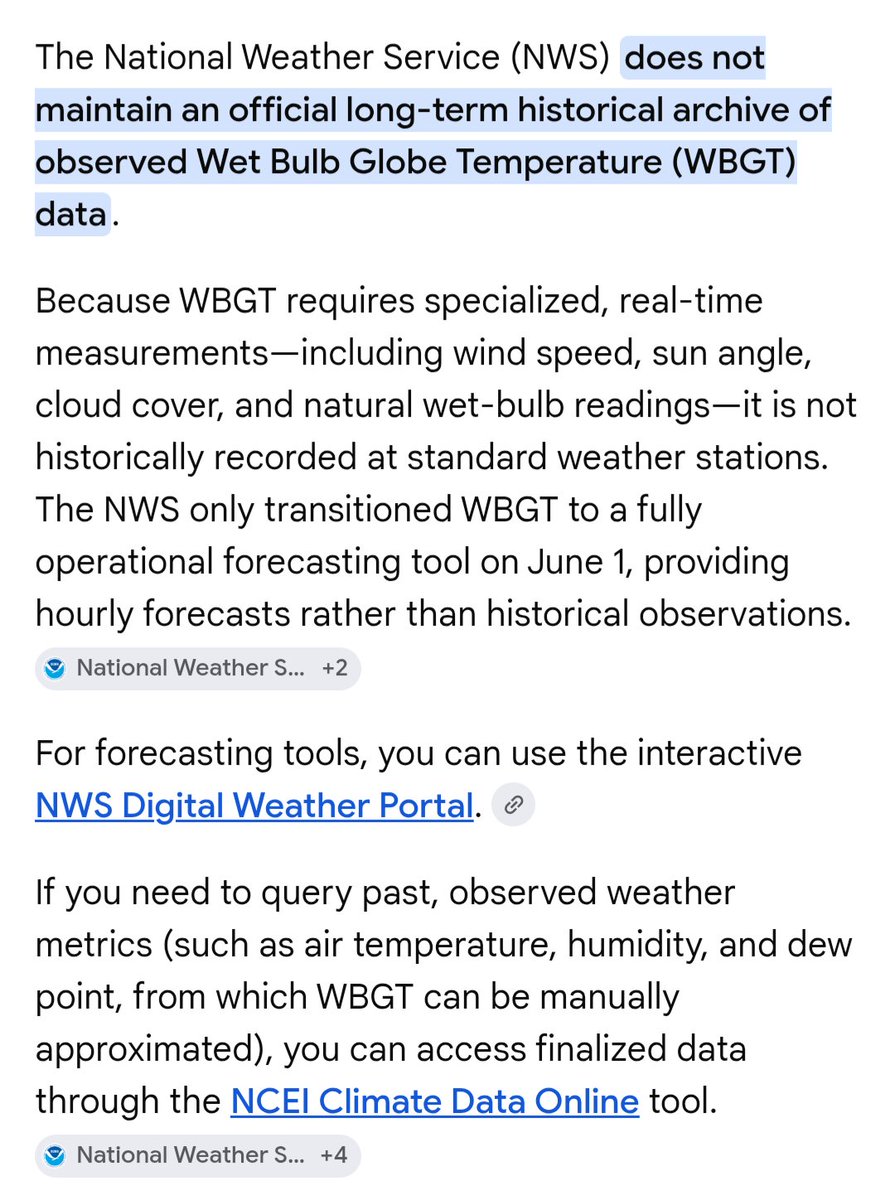
Can you cite the source of this study? Because according to the National Weather Service, they don't maintain an archive of historical WBGT. It's strictly a forecasting tool for safety. Historical WBGTs can only be manually approximated--not calculated. So how can there be a record for an archive of data that never existed? We'll wait.
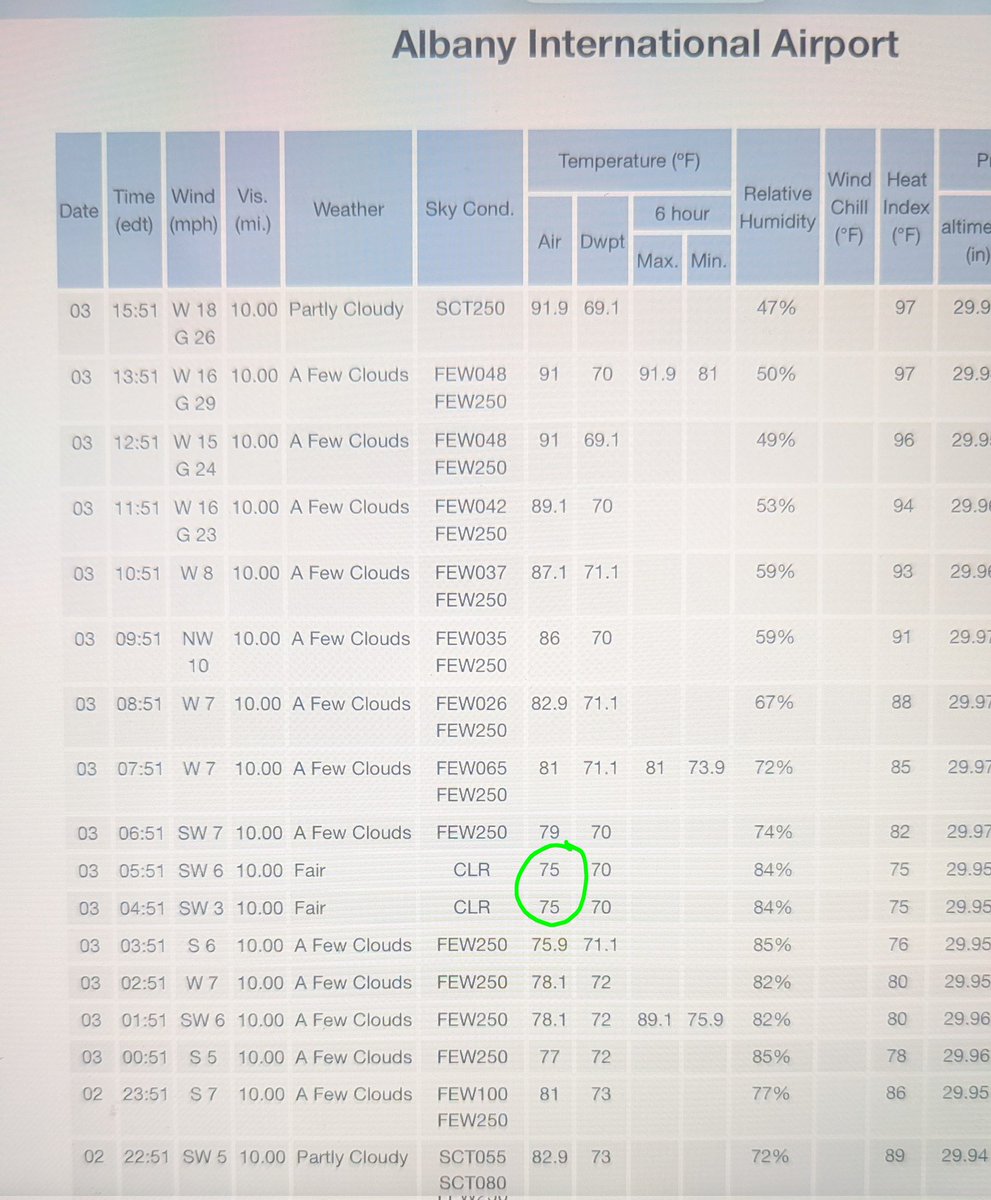
@WeatherProf Please explain why you're asserting that Albany'a low temperature only dropped to 82 when the National Weather Service has it OFFICIALLY recorded as 75. That's a 7-degree error! What other errors are there?
A low of 84 at LaGuardia, though rare, is not unchartered territory as it happened several times dating back to the 1950s. The low temperature has even been as high as 86. Thank you Urban Heat Island effect. That's the result when temperatures are recorded at a major airport.
https://t.co/Aeqjc6WKlX
Your exaggerated "animated" version of the Mediterranean Sea Surface Temperatures anomalies don't match the actual anomalies as shown by the European model, the ECMWF. In the areas of 3.5-5.0 above average depicted in shades of orange and rust, you blanketed it in white incorrectly showing temps 6.0 above average. And nowhere on the ECMWF, are temps 8.0 or higher above average.