@alphatrends called it before the open. ES and NQ were sitting under a falling 5 SMA, ES was pressing on its week and month AVWAP, and NQ was well below it. Being defensive was the right read. $SPY lost 770 early and closed at 763.30, down 1.1%, and $QQQ dropped 2.5% to 709.86. The side furthest under its AVWAP took the bigger hit.
ES and NQ are quiet this morning. Both markets remain below the declining 5 SMA and that means we still have a high level of defensiveness in our approach.
The ES is right up against the WTD and MTD AVWAP, while NQ remains well below it.
Keep a close eye on yesterday's vwap, the two day, today. That is likely to be a place for buyers to defend it, could signal trouble if it fails to hold as support and gets trapped under it.
As always, that is a scenario, not a prediction, there is a comfortable cushion down to the 2 day.
We are waiting patiently for EVIDENCE buyers to gain control before we can trust rallies for more than a daytrade or small size.
@Quantradin Today was exactly that. A long over 772.87 off the 773.25 first-minute print got run over, while the short under 764.43 ran to 760.64 and gave a good chunk back into the 763.30 close. Two-sided days are why I don't treat the first break as the signal.
Ranges get broken a lot more often than they hold. Backtest, labeled.
Thursday's $SPY (an S&P 500 fund) range was 764.43 to 772.87. Today it took out both sides: 773.25 in the first minute, then under 764.43 at 10:05 AM PT, a low of 760.64, and a close of 763.30.
That's the normal case. On SPY 1-minute bars from Jan 2024 to Oct 2026, across 574 days without CPI, PPI, jobs or Fed news, price broke the prior day's high or low 90% of the time and ran more than 0.25% past it 66% of the time. The close finished back inside that range only 42% of the time.
The range that held up better was the VIX expected move: prior close plus or minus VIX/√252, about 1.1% each way on SPY. It held all day on 71% of those quiet days, and the close finished inside it 85% of the time.
Caveat: underlying moves only, no option prices or costs.
So I treat the prior day's high and low as places to decide, not walls. The break is the base case. What matters is whether price closes back inside.
Gaps fill a lot. Fading them still didn't pay. Backtest, labeled.
Friday $SPY (an S&P 500 fund) opened at 772.92, about 0.15% above Thursday's 771.79 close, and was back under 771.79 by 8:08 AM PT. A small gap that filled, which is the common case.
On SPY 1-minute bars from Jan 2024 to Oct 2026 (691 sessions), gaps under 0.25% filled 81% of the time. Gaps over 1% filled only 22% of the time.
But the fill rate isn't the trade. Fading every gap at 6:31 AM PT toward the prior close, with a stop 1x the gap away, won 48% of the time on shares and averaged about +0.01% a trade before costs. On gaps under 0.25% it won 47%, even with that 81% fill rate, because a stop the size of a small gap often gets hit before the fill.
With same-day at-the-money options after costs, it lost in both test periods: about -$5 a contract in the fit period and -$16 in the check period.
Caveat: replay on 1-minute bars, some option rows missing, not live results.
A high hit rate on the level isn't a high hit rate on the trade. The stop and the costs decide that.
@Incite_corp Agreed, the 772 pin failed and the move came from Plan B. $SPY closed at 763.30, under its 50-day near 768.50. The next level we're watching is 762. If it holds there, today was just a monthly expiration flush. If it gives way, the 760.64 low comes back into play.
Grading my Fri Oct 16 call: D. 2 hits, 1 partial, 3 misses.
The main call missed. I called a pin around 772 for monthly expiration. $SPY opened at 772.92, tagged 773.25 in the first minute, and last closed above 772 at 7:50 AM PT. It broke 770 at 8:08, slid all day, made its low at 760.64 at 12:08, and closed at 763.30, down 1.10%.
What I posted at 6:37 AM PT, and what happened (times PT):
The 767 to 780 range missed on the downside. SPY closed under 767 at 9:02 and never got back.
QQQ's 730 magnet missed. High was 725.94 in the opening minute, and QQQ closed at 709.86, down 2.49%.
Plan B was the right plan. Under 769.69 (8:10) I said fade toward 765, and SPY got there at 10:04. Under 764.43 (Thursday's low) I said down day, and that broke at 10:05. Two hits.
IWM's 270 floor gets partial credit. It dipped to 269.88 at 12:08 and closed at 270.48.
The upside targets at 774 and 775 never traded.
Paper trades on SPY 10/16 calls:
772C in at 1.22 (7:02), stopped at 0.90 (7:04), -$33.30.
771C in at 1.14 (7:12), target at 1.71 (7:38), +$55.70.
772C in again at 1.06 (7:39), stopped at 0.74 (7:54), -$33.30.
That's 1 win, 2 losses, -$10.90.
Lesson: the pin read was good for about an hour and I kept buying calls into it. The 7:39 re-entry came after price had stopped holding 772. Next time, once the magnet stops holding on closes, Plan B becomes the plan and the calls stop.
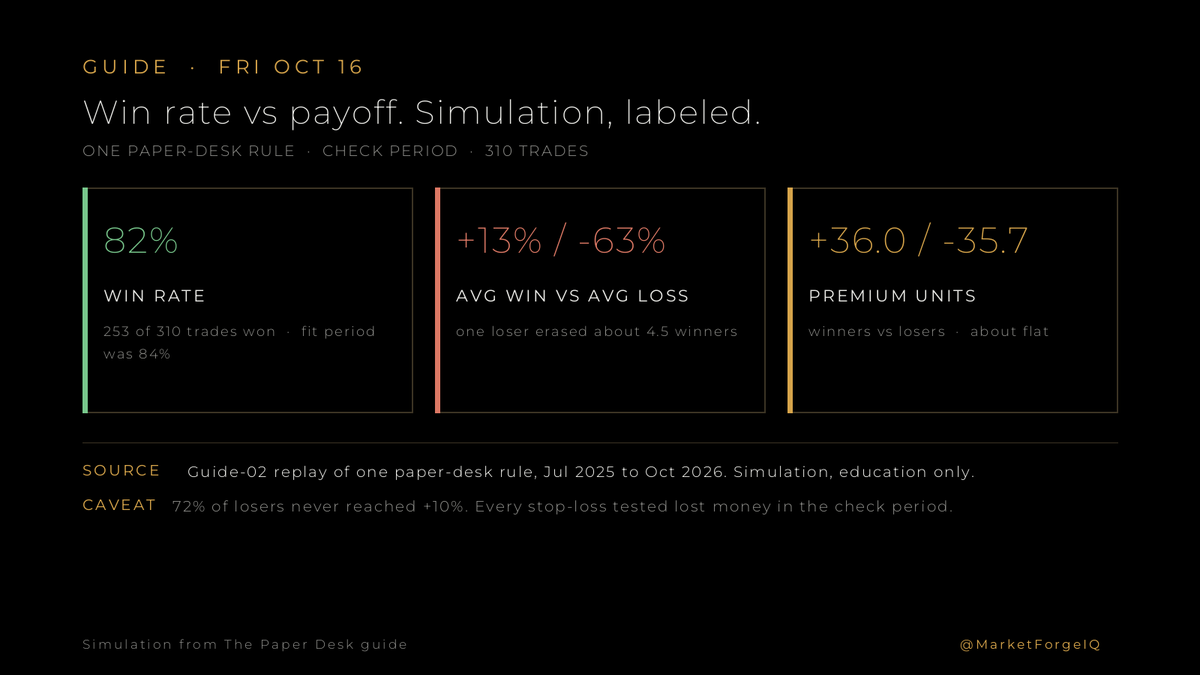
Win rate is the most flattering number in trading. Simulation, labeled.
One paper-desk rule, replayed on past prices. It won 84% of its trades in the fit period and 82% in the check period.
Check period, 310 trades:
253 winners: +36.0 premium units
57 losers: -35.7 premium units
(1 unit = what was paid for the option)
About flat. The average win was about +13%, the average loss about -63%. One loser erased about 4.5 winners.
About 72% of the losers never got to +10%. Every stop-loss version tested made the fit period look better and lost money in the check period. It was an entry problem, not a stop problem.
That breakdown is one chapter of a short guide on the paper desk, if you want the rest.
#SPY #QQQ #SPX #DJIA
Do you track your average win against your average loss, or mostly your win rate?
The options map on $SPY slid lower under price this morning, and on an expiration Friday that's the part I keep chewing on.
At 6:33 AM PT the map had the put wall and king node both at 772, with the call wall at 775. By 9:30 AM PT it reads call wall 769, king node 770, put wall 765. SPY was 768.21 at that read, so this morning's floor at 772 is now overhead and the new ceiling sits right on top of price.
Dealers are still in negative gamma, which means their hedging tends to chase moves instead of calming them. The heaviest negative-gamma strikes on the map are 765 and 760. It only flips positive from 775 up.
The tape leans the same way. In the 15 minutes into 9:31 AM PT, prints I could put a side on show about $48.2M sold vs $38.0M bought, and that covers only about half of them.
I'm not in a SPY trade right now. What I'm watching into the close is whether 770 pulls price back like a magnet or 765 gets tested.
#SPY #QQQ #SPX #DJIA
When the walls move under price on expiration day like this, do you trade the new levels right away or wait for them to settle first?
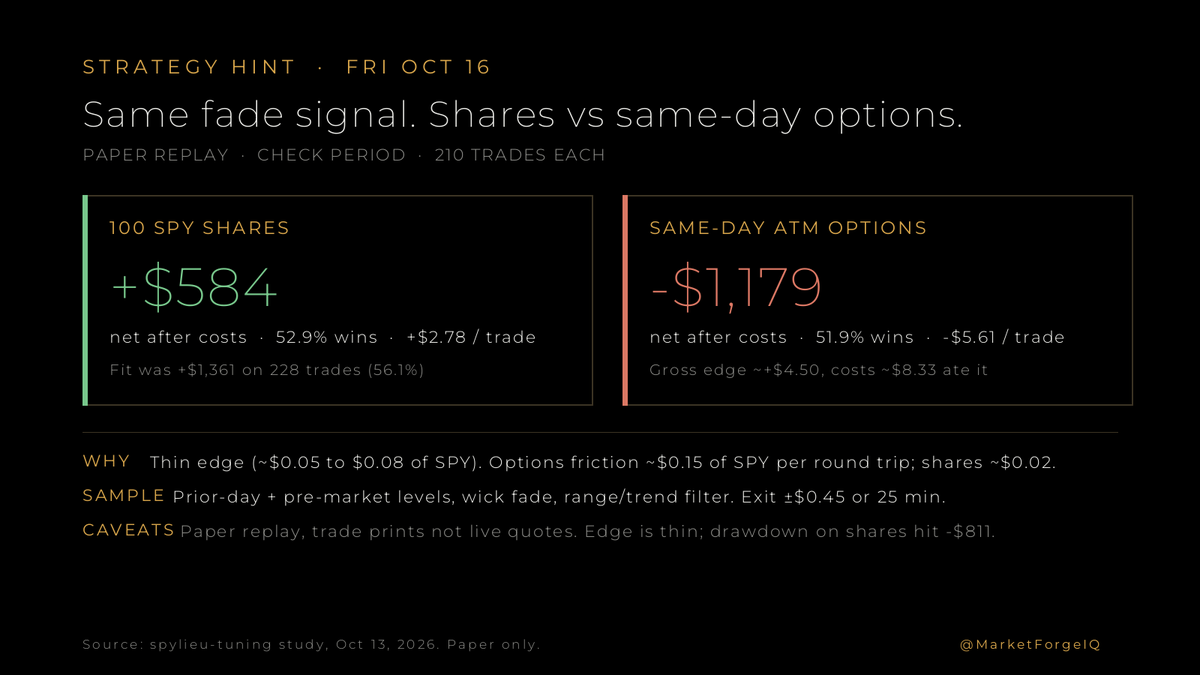
Same fade setup. Paper study on $SPY (an S&P 500 fund).
I ran the exact same signals two ways: 100 shares, and same-day ATM options. Check period, 210 trades each.
Shares: +$584 net after costs, 52.9% wins, about +$2.78 a trade.
Options: -$1,179 net after costs, 51.9% wins, about -$5.61 a trade.
The edge itself is thin, about $0.05 to $0.08 of SPY. Shares need about $0.02 of SPY to cover friction. Same-day options needed about $0.15. Gross option edge was real (~+$4.50 a trade). Costs (~$8.33) ate it.
Caveat: paper replay on trade prints, not live quotes. Shares drawdown hit -$811 on that +$584. Thin edge.
SPY #OptionsTrading #0DTE
Do you fade levels with shares, or do you still prefer same-day options for the leverage?
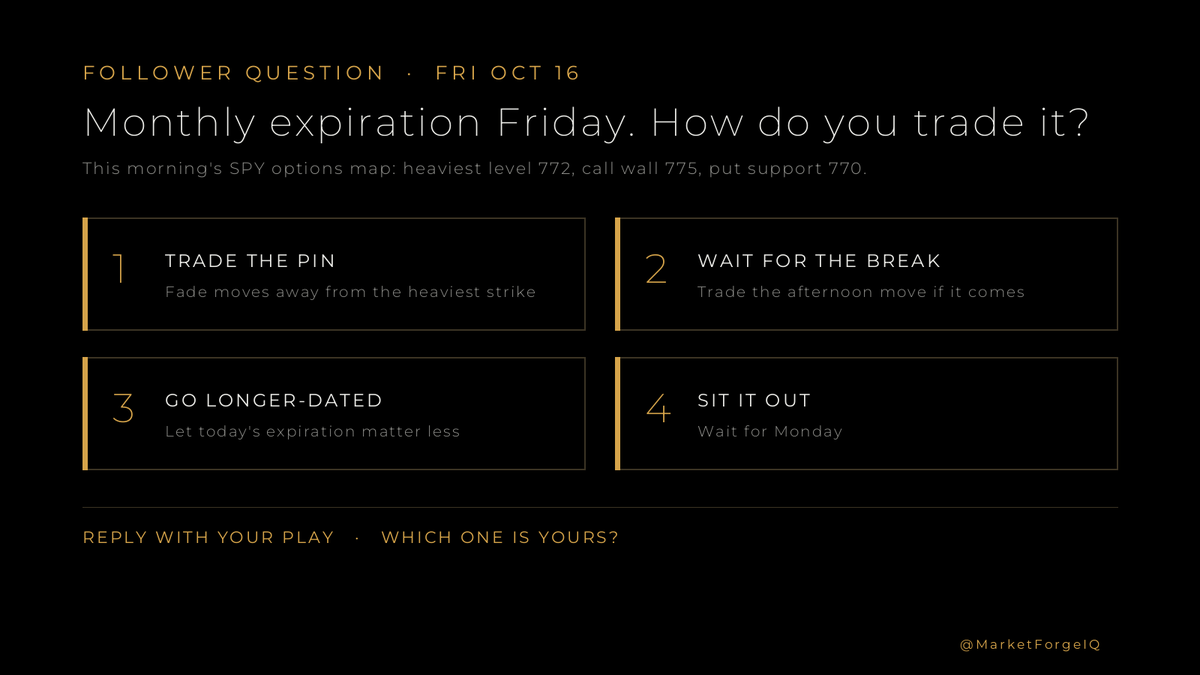
Quick one for monthly expiration Friday.
A big batch of options expires today, and prices can pin near the heaviest strikes or break loose late in the day. This morning's options map had $SPY's heaviest level at 772, with the call wall at 775 and put support at 770.
How do you trade a day like this?
1. Trade the pin: fade moves away from the heaviest strike
2. Wait for the afternoon and trade the break if it comes
3. Use longer-dated options so today's expiration matters less
4. Sit it out and wait for Monday
Each one gives something up. Fading the pin works until the level gives way, and waiting for a late break can mean watching most of the day go by.
#OptionsTrading #0DTE
Which one is yours, and has an expiration Friday ever surprised you?
That split between the Dow holding up and Nasdaq soft fits a tape where dealer hedging can make moves bigger, not calmer. On my SPY map, price is near 771.40 with a ceiling at 772 and the biggest options level around 770. Day type still isn't confirmed, so I'm reading the bifurcation as the story until the open settles.
@RedDogT3 Tech lagging into the open matches the QQQ map I'm watching. Spot is near 720.80 with the biggest options level at 720 and a ceiling at 723. Put support sits closer to 715. Day type isn't confirmed yet, so I'm letting that lag show itself before leaning hard either way.
Fri Oct 16 game plan, paper
Import prices and factory output (industrial production) both printed hotter than expected this morning. Friday is monthly options expiration, when a big batch of options expires and prices can pin near the heaviest levels or jump late.
$SPY (an S&P 500 fund) is 772.07 at 6:37 AM PT, a few minutes after the open. It poked above Thursday's 772.87 high overnight (high 773.92), then settled onto 772, the heaviest level on today's fresh options map. Thursday closed at 771.79. The map's call wall is 775, with heavy call volume at 774. Below, put support is 770, then the overnight low at 769.69, then 765 where Thursday's drops stalled. The map prices today's range around 767 to 780, and dealer hedging can make moves bigger, not calmer, at these prices.
The call is a pin lean around 772, because that is where the map is heaviest on monthly expiration after two hot prints, and price is sitting right on it.
If it works: SPY keeps holding 772, and I'm looking at 774, then the 775 call wall, then 776.35 (Wednesday's high), then 778.01 (Tuesday's close).
Invalidation: a clean break under 770 takes the pin thesis off. Plan B: under 769.69 I treat it as a fade toward 765. A break under 764.43 (Thursday's low) makes it a down day. Upside flip: reclaim and hold 772.87, Thursday's high, and the up lean from the prelim is back on.
QQQ (a Nasdaq-100 fund) is 722.92, below its 725 floor and leaning on the next shelf near 721.7. The magnet overhead is still 730. IWM (a small-cap fund) is 275.41, right on its heaviest level at 275, with a 277 ceiling and a 270 floor.
Paper desk is flat. No contract calls yet; entries, exits, and grades post below as they happen.
SPY QQQ IWM
@TopShelfCharts Same page, Chris. Holding 772.87 into the open is the first filter, and the close is where I'm grading it, paper. If it slips back under 772 I drop the up lean.
Fri Oct 16 game plan, paper (preliminary, 5:30 AM PT)
$SPY (an S&P 500 fund) is 773.13 premarket, above Thursday's 772.87 high and its 771.79 close. Overnight it ranged from 769.69 to 773.92.
The call so far is a cautious up lean, because SPY is holding above Thursday's high going into monthly options expiration. Import prices just printed at 5:30 AM PT, and factory output (industrial production) lands at 6:15 AM PT.
If it works: SPY holds 772.87 after the open, and I'm looking at 773.92 (overnight high), then 776.35 (Wednesday's high), then 778.01 (Tuesday's close).
Invalidation: a slip back under 772 puts SPY back inside Thursday's range, and I drop the up lean. Plan B: under 769.69, the overnight low, I treat the open as a fade toward 765, where Thursday's drops stalled. A clean break under 764.43 makes it a down day.
QQQ (a Nasdaq-100 fund) is 727.50, still under 730, the ceiling it couldn't clear Thursday (high 729.43). Its floor is 725.
No contract calls yet. The options-map levels are still from Thursday afternoon, so the final plan with contracts comes after the fresh map lands near the open.
Same-day options (0DTE, they expire that afternoon). Timing clusters, backtest labeled.
Opening-range breakouts on $SPY and QQQ. Check period Jul 2025 to early Oct 2026.
78% of losing dollars ($49,674 of $63,486) came from entries between 7:00 and 7:30 AM PT. That same window also held 77% of the trades, so most of the dollars sit where most of the trades are.
Net by clock: early entries -$10,293. All later entries combined +$2,374. In the fit period the early bucket was +$348, so the split is not stable across periods.
SPY #OptionsTrading #Backtesting
When you trade same-day options, do you skip the first half hour after the opening range, or take every breakout that prints?
[Fri Oct 16] plan, paper.
Friday is monthly options expiration, the day a big batch of options expires, and that can make prices stick near big option levels or jump around. The news starts with import prices at 5:30 AM PT and factory output (industrial production) at 6:15 AM PT. I have no lean yet. I start Friday neutral and won't pick a side until the market shows me what kind of day it is.
There are no contract calls for Friday yet, so this is a levels-only plan. The levels were set from the prior session's open interest.
$SPY (an S&P 500 fund) finished Thursday just under 772, its biggest options level, and Thursday's high was 772.87. That's my ceiling. If SPY gets above 772.87 and holds, I'm looking at 776.35 (Wednesday's high), then 778.01 (Tuesday's close).
My floor is 765, where drops slowed on Thursday. SPY dipped to 764.43 at 6:57 AM PT and held. A clean break under 764.43 means the floor failed, and option dealers' hedging can make moves bigger, not calmer, at these prices.
QQQ (a Nasdaq-100 fund) has a ceiling at 730 and a floor at 725. Thursday's high was 729.43.
Plan B: if import prices or factory output come in hot and SPY loses 764.43, I drop the neutral stance and treat it as a down day. If SPY gets back above 772.87 instead, sellers lose the edge and I look higher.
Any contract I call Friday gets its entry, exit and grade posted below as it happens.
SPY QQQ
@TopShelfCharts That's the takeaway I'm carrying into tomorrow. 765 held and 770 gave way, and only the 771.74 close made either one real. Thanks for sharpening the idea, Chris.
Grading my Thu Oct 15 call: C. 2 hits, 2 partials, 4 misses.
I'll start with the misses. Soft bias after the hot PPI print was wrong once $SPY reclaimed 768.25 at 7:40 AM PT and never closed back under. My 770 call wall overhead did not cap the bounce. SPY broke it at 8:03, tagged 772.87 at 12:22, and closed 771.74. QQQ's 725 first ceiling broke at 8:12 and the Nasdaq fund ran to 729.43 by 12:47. QQQ's 730 magnet never got tagged (high 729.43), so that counts as a miss.
What I posted at 6:27 AM PT, and what happened (times PT):
The options-priced range I gave, about 760 to 775, held. High 772.87, low 764.43. That counts as a hit.
The 764.10 post-data low held as the backup floor. RTH low was 764.43 at 6:57. That counts as a hit.
The 765 put wall lost briefly to 764.43 at 6:57, then held the rest of the day. Partial credit.
My 7:26 AM close call was SPY 765.2 to 774 with a best guess of 767.4. Closed 771.74, inside the range but about 4.3 above the best guess. Partial credit.
Closes: SPY 771.74, up 0.28%. QQQ 728.04, down 0.12%. Dow fund DIA 521.14, up 1.07%.
Lesson: I left soft bias standing after 768.25 reclaimed and held. Next time I flip the bias in a follow-up once that reclaim sticks, instead of carrying a soft morning into a green close.