Volume weirdly light on Thursday. NYSE volume lowest in a month. Scanning for a 1% down day for $SPX and a one-month low w/ NYSE volume also a one-month low, we find zero occurrences since 2000.
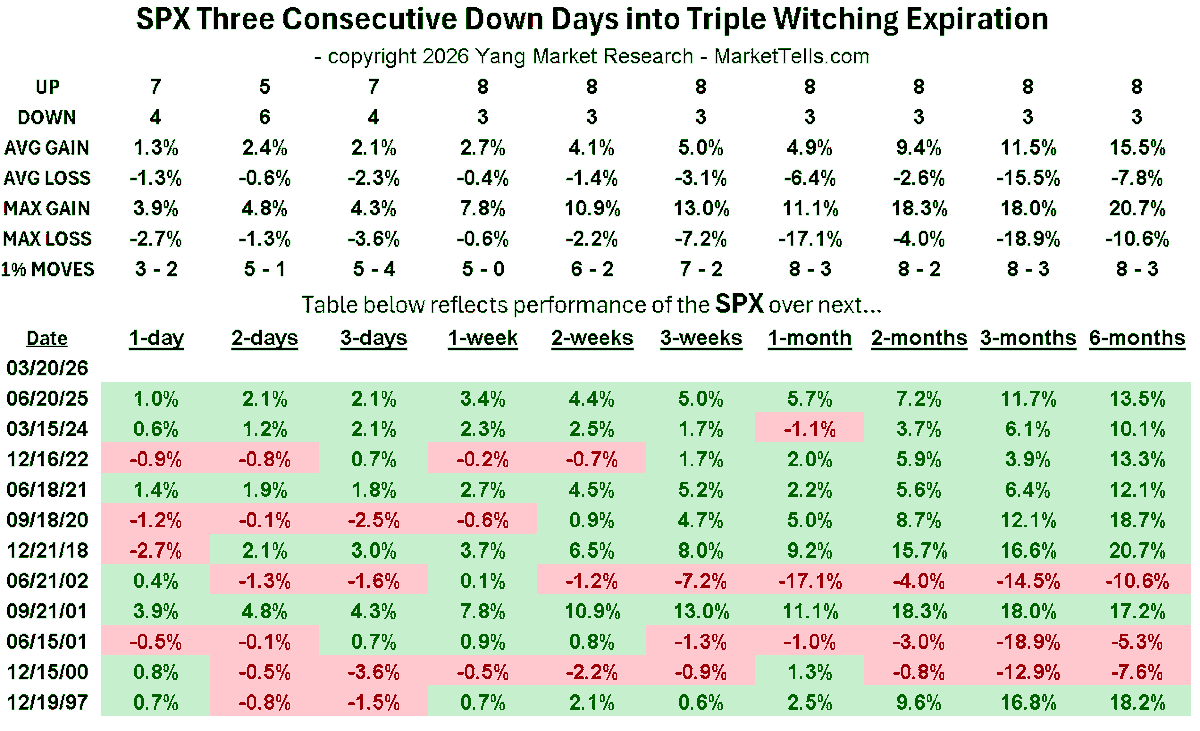
Setting up for only the 12th occurrence since 1995 of three straight $SPX down days into triple witching expiration. One week later S&P avg gain 2.7% vs 0.4% avg loss...
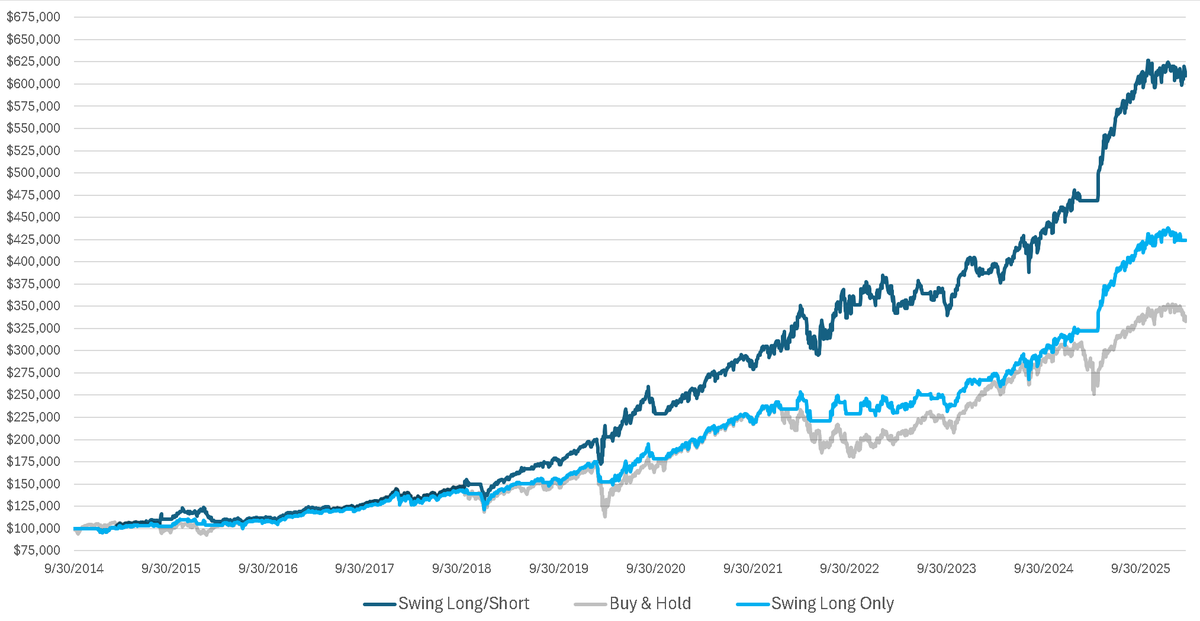
Swing model went short March 2nd and remains in cash as of March 19th. The long-only version has outperformed $SPX buy & hold by 27% since 2015. The long/short version has outperformed by 82%. Based on a single input (NYSE $TICK). Our rates have increased, but through Sunday lock in our old rate via this link... https://t.co/Y1pJbNiyGS
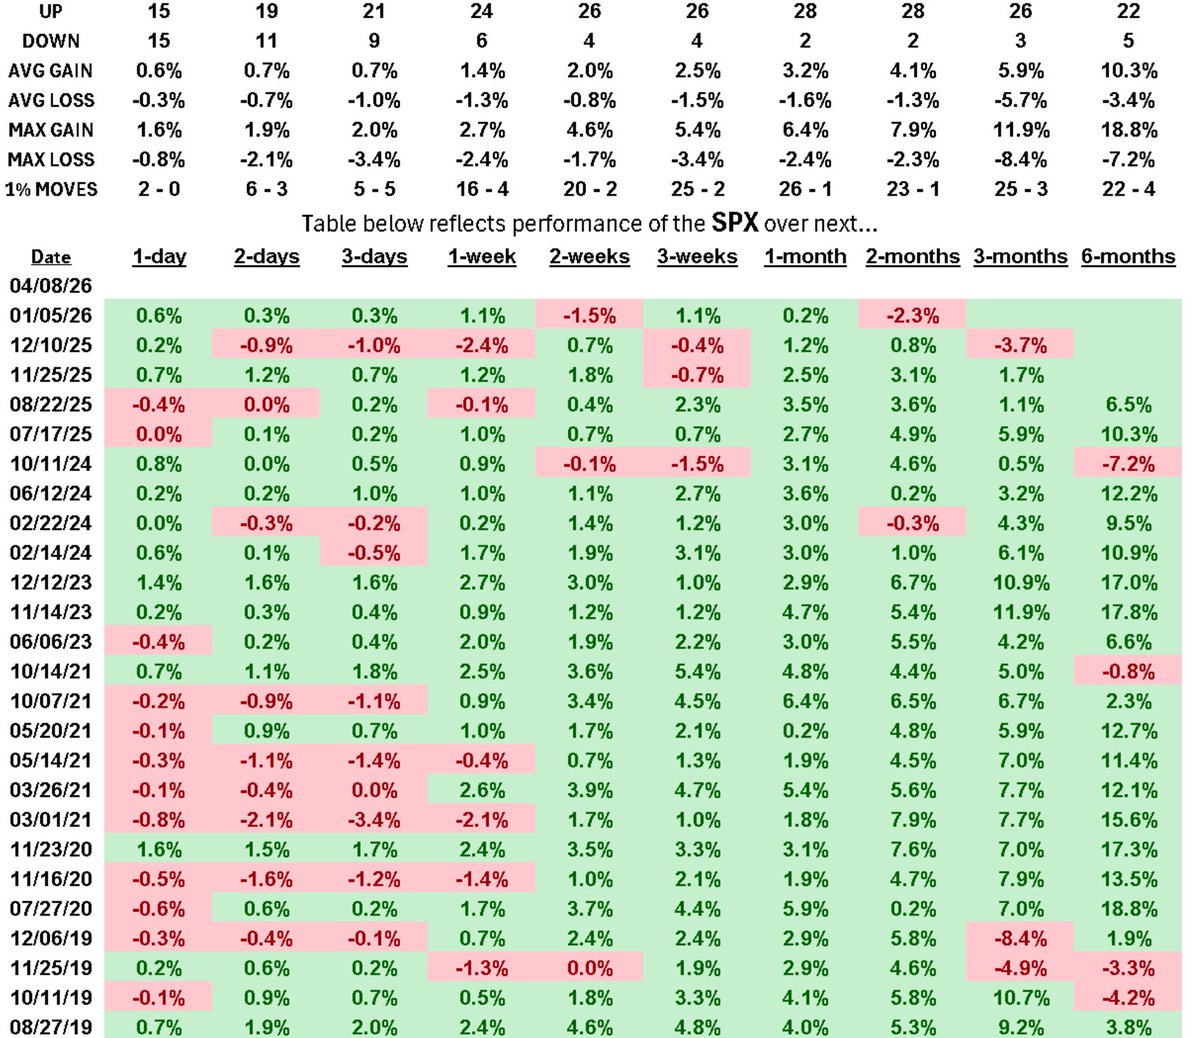
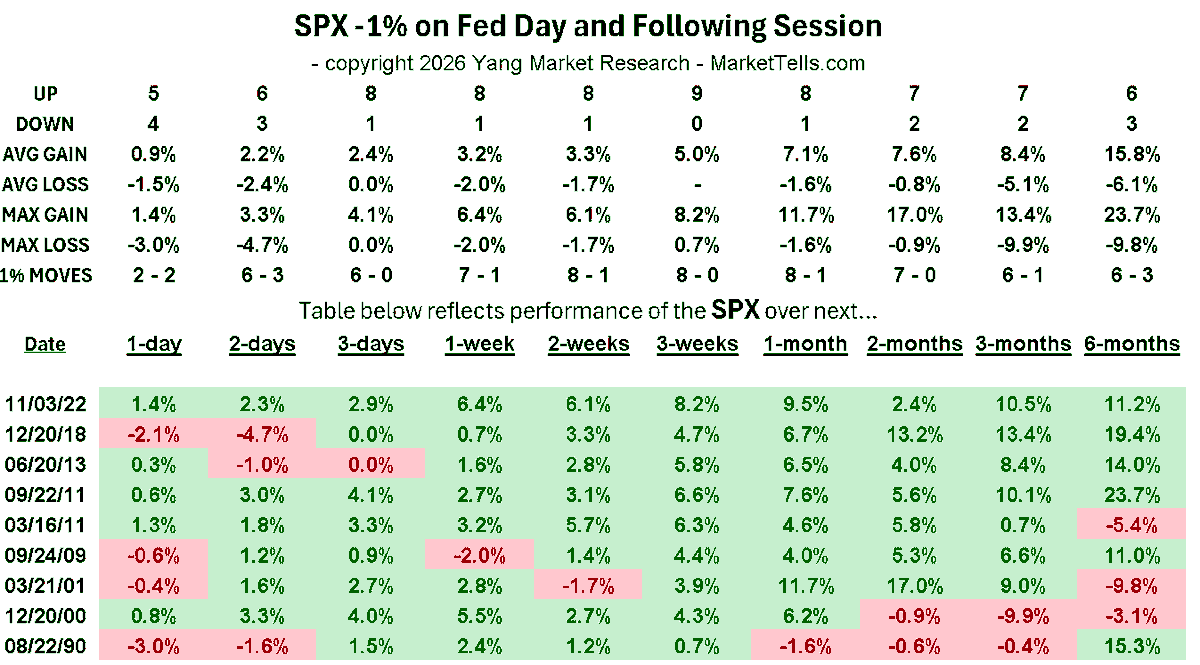
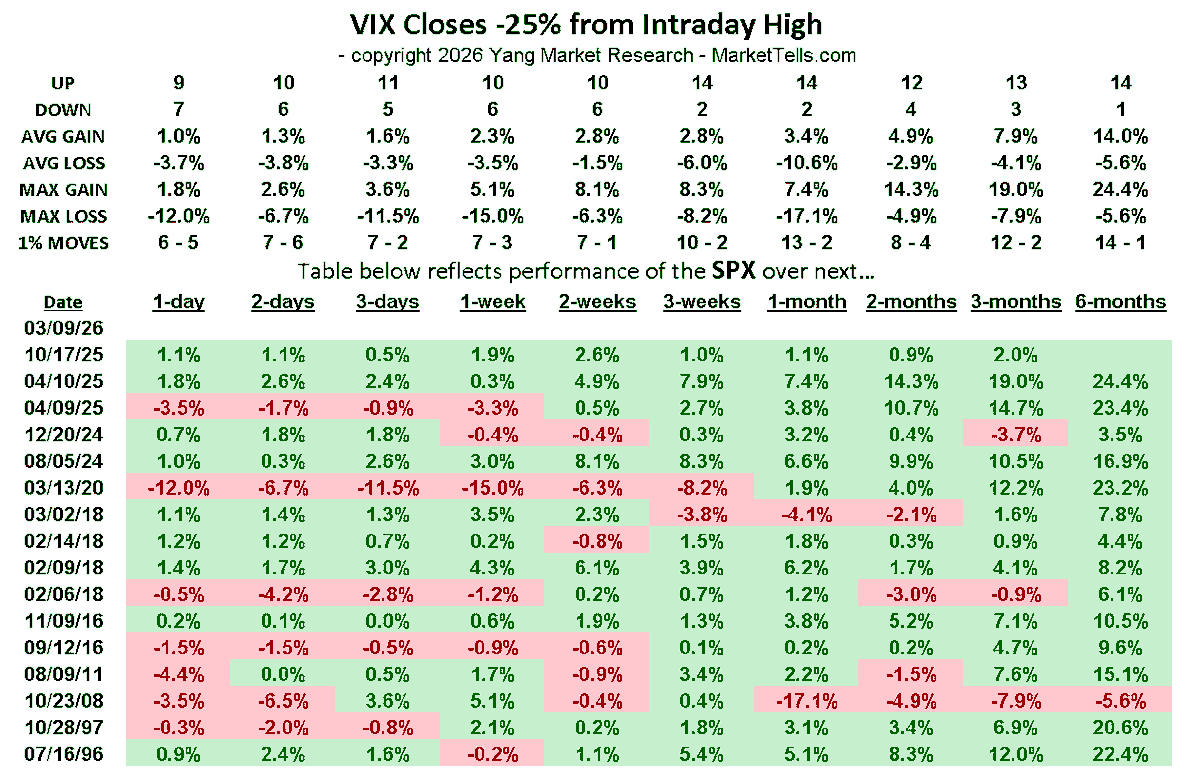
If today's losses stick into the close & $SPX -1%, would be only the 10th time since 1990 that the S&P lost 1% on a Fed Day and another 1% the following session. S&P higher three sessions later 8/9 and three weeks later 9/9...
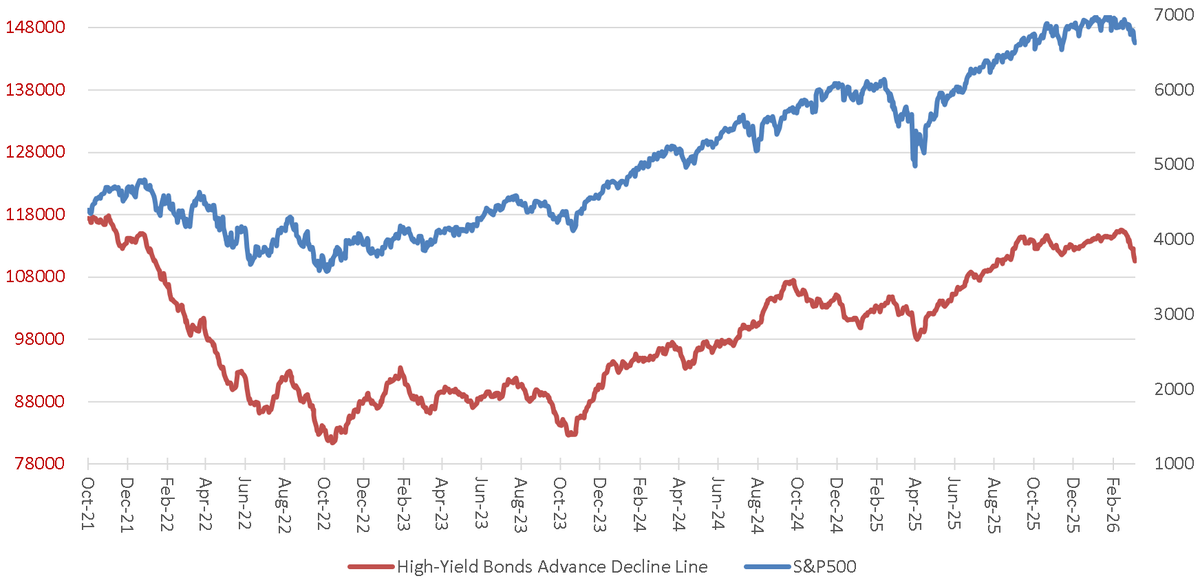
Advance decline line for high-yield bonds continues to weaken, taking out its November low. A model I track, based on this line & the work of @mcclellanosc went to cash March 6th.
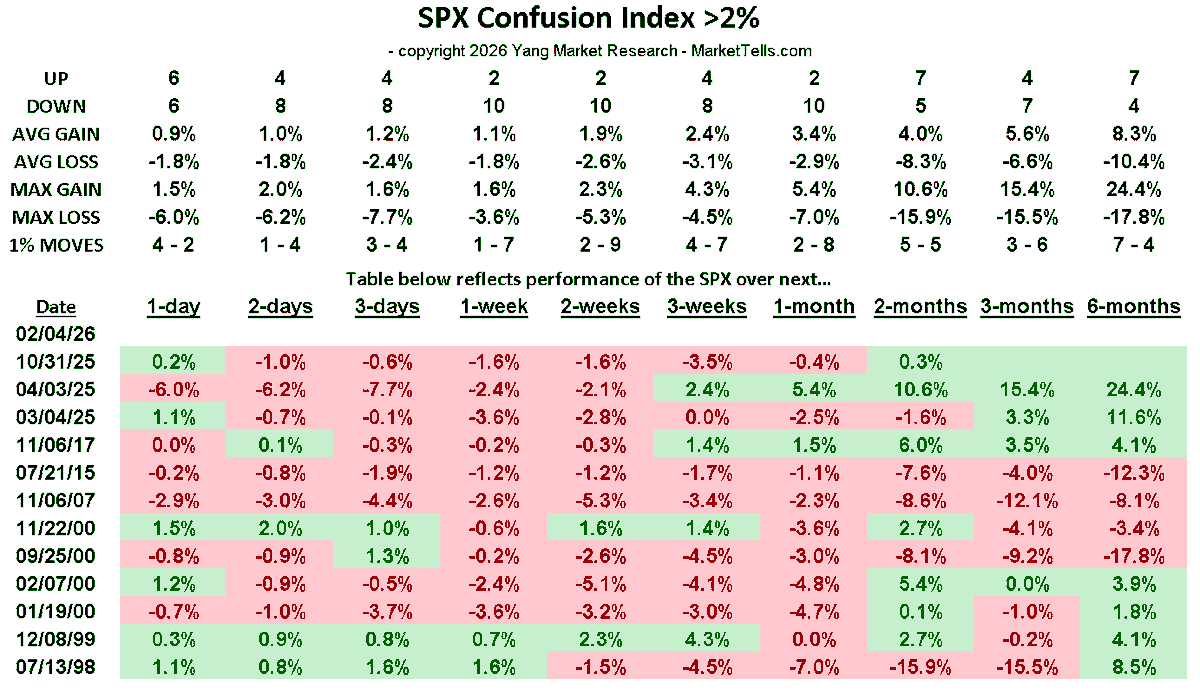
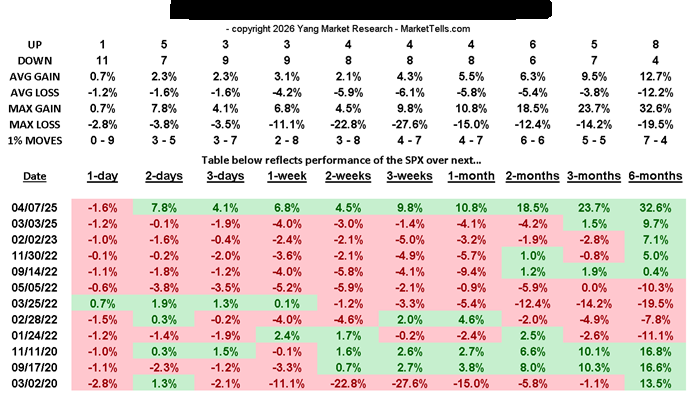
Subs got word after Tuesday's close that this rare bearish signal was triggered. $SPX higher one session later only once out of 12 occurrences. Average loss 1.2%...