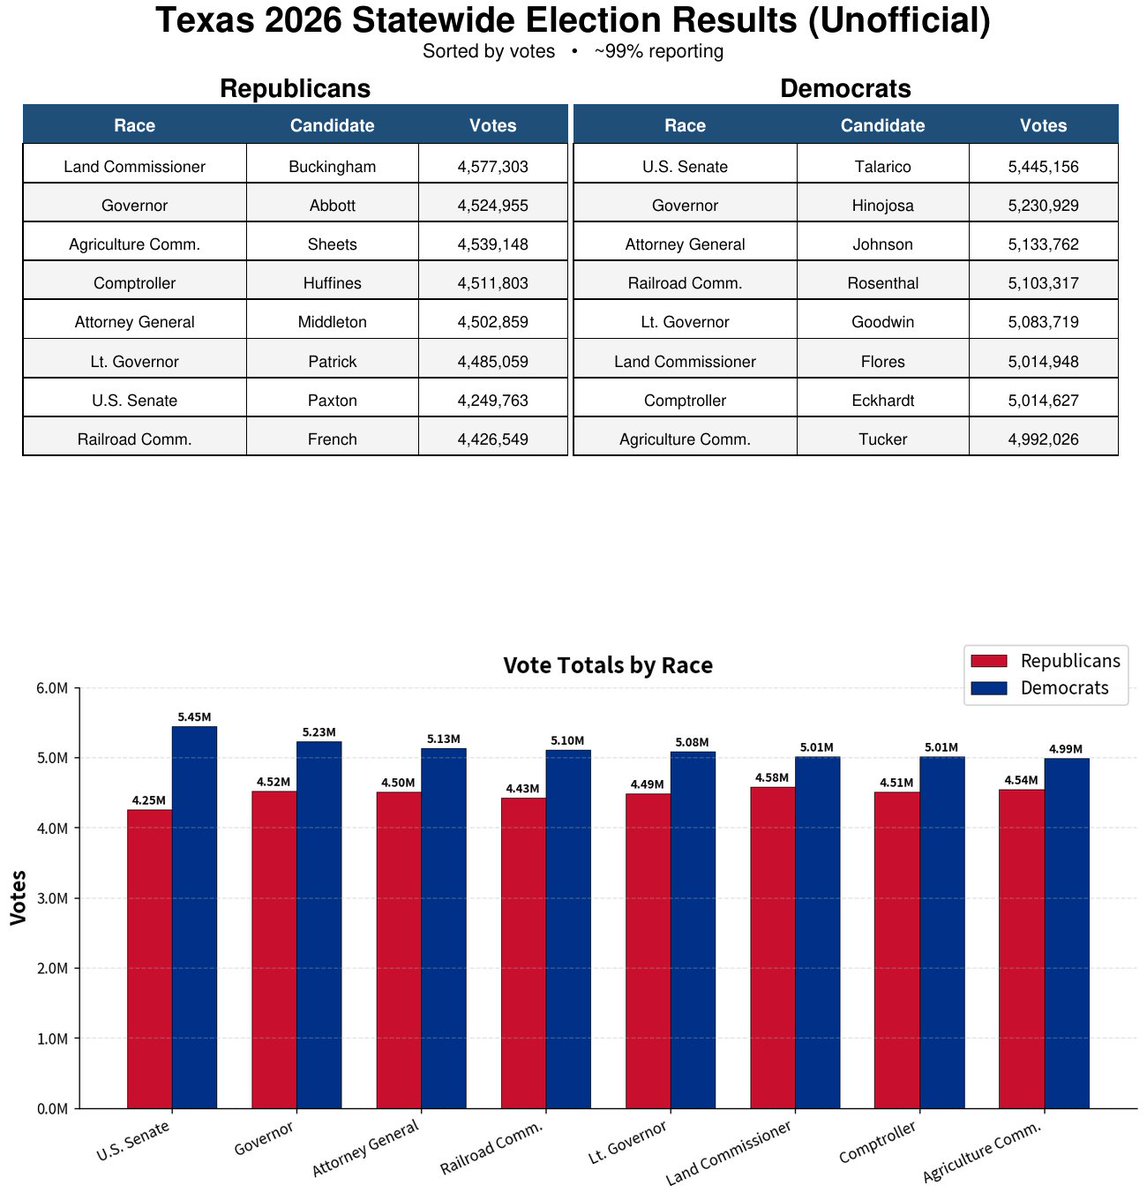
If someone were to want to challenge this election, an audit of smaller counties should be much easier than one for the larger counties. Here is a chart showing the smallest 10 counties in Texas by population. Non of these counties were outliers. Instead of percentages, this shows total votes cast.
Of the 6 outlier counties in Kansas, 3 of them (Jewell, Sheridan and Wallace) had vote totals that missed the 85% projected votes to the Republican side.
Sheridan is the ONLY county in Kansas that hand-counts paper ballots.
Wallace is one of the few Kansas counties that may still use Premier(formally Diebold) election equipment.
Jewell county uses ES&S Express Vote with DS200 optical scanners similar to many of the other Kansas counties. What is interesting is Jewell is one of just 4 counties that publicly announced that their equipment was tested before the election.
@BonginoReport@dbongino Dawn Buckingham must be a very popular candidate. She received more votes by any other Republican running for office in Texas. This report was produced using Grok.
@laralogan The Republican running for Land Commissioner in Texas must be very popular person amongst Republicans. She received more votes than any other Republican candidate.
@MLindellOffense Since you mentioned Georgia, here is my report for Georgia. notice the Republican candidate that received the most votes was the Agriculture Commissioner.
@MLindellOffense An interesting trend has developed in many of states in you table. Here is a report you should see for Texas. Notice that the Land Commissioner got more votes cast than any other Republican candidate running.
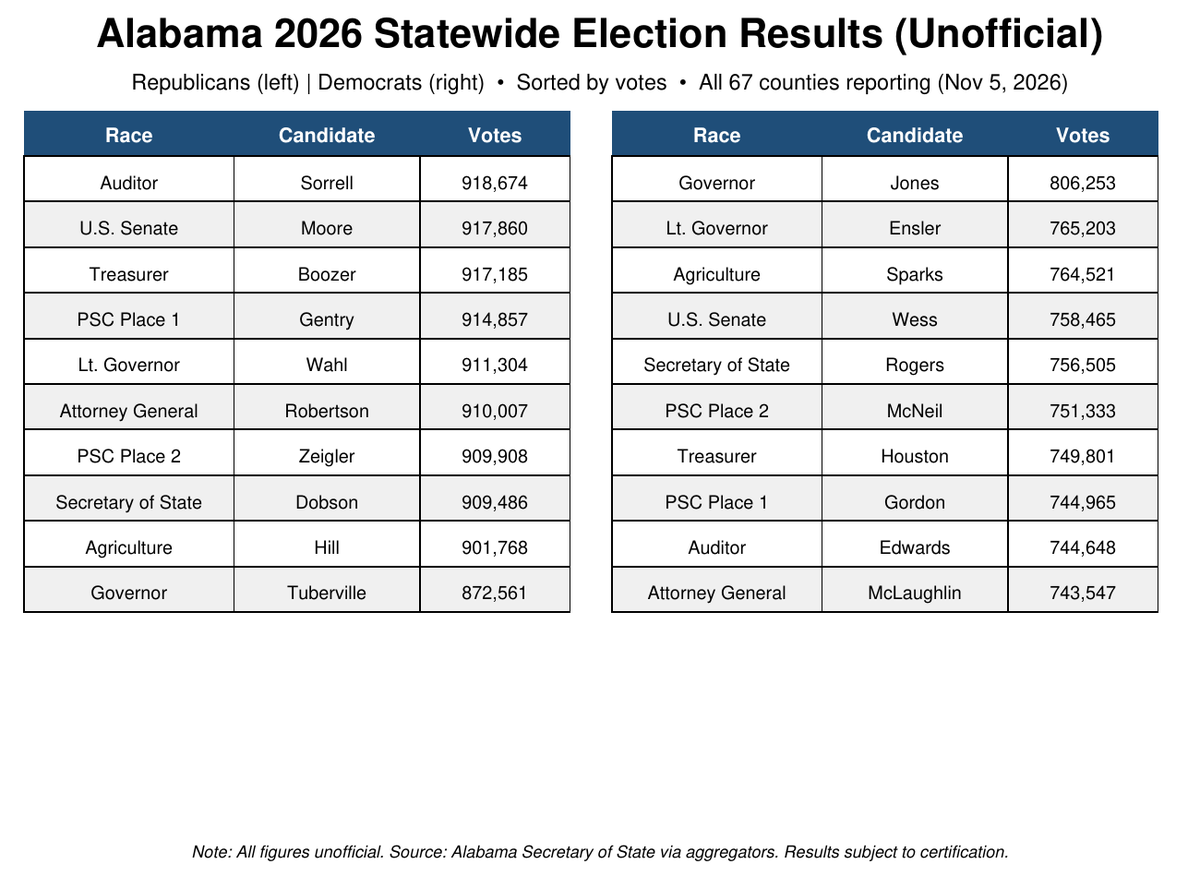
@TonerousHyus Here is some interesting data for Iowa. This report shows the number of votes cast for each candidate by party. The tables are sorted by number of votes received. I have been finding a similar pattern in many states.
@FSociety_1942 There would seem to be a pattern developing here. You can send this report to grok and recreate it for any state. So far, I have done this for several states and most of them have similar patterns.
@FSociety_1942 I asked Grok to verify the numbers in your report which it did. Then I asked Grok to produce a similar report for Arizona. I find this report interesting as well...
@Rob17665947@RealSKeshel Wood county now holds the 88th spot with 5.91% of 2026 total. Wood county is a Trump county but they haven’t made available in-person votes so their number is skewed. Montgomery County is probably still on the bottom.