THE 15% BAND
Look at this chart.
59 races. Senate and governor.
States ordered from reddest to bluest in 2024.
The solid lines are 2024.
The dashed lines are 2026.
The shaded bands are what moved.
One formula fits all of it:
Republican 2026 = 0.85 × Trump 2024
Democrat 2026 = Harris 2024 + 0.15 × Trump 2024
For every 1,000 Trump points, 850 stayed Republican. 150 landed on the Democratic side.
The numbers:
Senate: Republicans kept ~85% of Trump’s share
Governor: ~86%
Variation explained: 88%
What makes it strange:
It didn’t matter how red the state was. Wyoming, Ohio, Illinois, Massachusetts: same 15% (p = 0.69). The Democratic gain was sized by Trump’s vote, not Harris’s. The Harris part is zero.
The 0.85 beat both standard election-swing models in every set of races.
Drop any single state and the multiplier stays between 0.846 and 0.853.
Why seats flipped:
At 0.85, any state where Trump got under about 58.5% falls below 50%. Texas, Kansas, Iowa, Ohio, South Carolina, North Carolina: all under that line. All flipped.
What this means:
Midterms are messy. This one isn’t. Two sets of races, different candidates, different campaigns, and the same 15% decrease almost everywhere.
A pattern this even demands answers at the ballot level: paper ballot hand counts, poll-book check-ins against votes counted, and voter files showing who actually turned out.
The numbers raise the question.
The ballots can answer it.
To everyone asking who is behind this account: I am an independent citizen with financial and legal experience. I am not a career politician or a corporate pollster.
When I noticed a strange consistency in the election data, I analyzed it and posted what I discovered.
I have proudly supported President Trump since the day he came down the escalator. To know that a pattern I shared is of interest to him is a humbling and surreal honor.
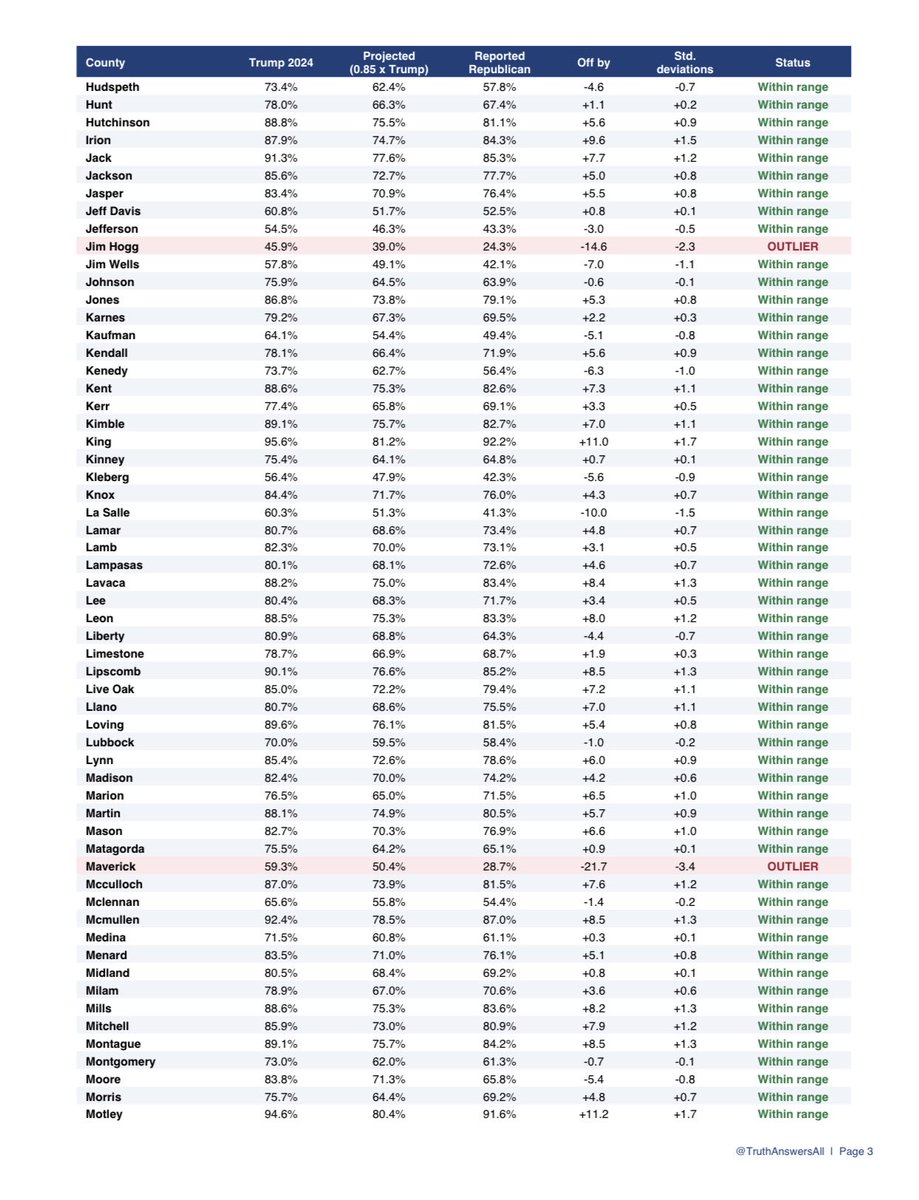
TEXAS: THE 15% GAP, COUNTY BY COUNTY
The 15% gap held across the Senate map. Here’s Texas, all 254 counties. 97% of counties fell within range: 246 of the 254.
Below the formula: Starr, Zapata, Maverick, Webb, Hidalgo, Cameron, Duval, Jim Hogg. Border counties along the Rio Grande.
What the formula tells us: If a county is below the formula, the proportion of Democrats to Republicans who voted 🗳️ in that specific county was higher than in 2024. If it’s above the formula, the proportion of Republicans to Democrats was higher than in 2024.
Why this matters:
This isn’t a statewide average hiding the normal county-to-county variation underneath. The same 15% shows up in counties with dozens of voters and counties with more than a million. The few that break from it break in predictable directions.
One rule works at the state level and the county level. That’s not what scattered voter decisions usually look like.
@miredrobin Aww… thank you. 😊 It's definitely frustrating to see it happen, and it has by many accounts over these last couple of days, but reading a comment like yours makes me smile. Truly appreciate your support!
ALL 21 STATES. ALL 1,799 COUNTIES. EVERY SINGLE ONE SHIFTED BLUE.
You can blame the Iran war. You can blame the economy. But you expect me to believe Republicans were THAT angry that every single state and county shifted blue?
And before anyone says it, this isn’t about being unable to accept a loss. I can accept losing. What I can’t do is ignore something that just doesn’t pass the smell test.
Sorry, but I have questions. 2020 makes me look at things way differently.
@MarleyGoat1 That is great information! My working theory had been that the proportion of Republicans to Democrats was higher than in 2024, but it sounds like it may be a result of the truth.
THE 15% BAND
Look at this chart.
59 races. Senate and governor.
States ordered from reddest to bluest in 2024.
The solid lines are 2024.
The dashed lines are 2026.
The shaded bands are what moved.
One formula fits all of it:
Republican 2026 = 0.85 × Trump 2024
Democrat 2026 = Harris 2024 + 0.15 × Trump 2024
For every 1,000 Trump points, 850 stayed Republican. 150 landed on the Democratic side.
The numbers:
Senate: Republicans kept ~85% of Trump’s share
Governor: ~86%
Variation explained: 88%
What makes it strange:
It didn’t matter how red the state was. Wyoming, Ohio, Illinois, Massachusetts: same 15% (p = 0.69). The Democratic gain was sized by Trump’s vote, not Harris’s. The Harris part is zero.
The 0.85 beat both standard election-swing models in every set of races.
Drop any single state and the multiplier stays between 0.846 and 0.853.
Why seats flipped:
At 0.85, any state where Trump got under about 58.5% falls below 50%. Texas, Kansas, Iowa, Ohio, South Carolina, North Carolina: all under that line. All flipped.
What this means:
Midterms are messy. This one isn’t. Two sets of races, different candidates, different campaigns, and the same 15% decrease almost everywhere.
A pattern this even demands answers at the ballot level: paper ballot hand counts, poll-book check-ins against votes counted, and voter files showing who actually turned out.
The numbers raise the question.
The ballots can answer it.
The test is whether this multiplier applied to the 2024 baseline predicts the 2026 result closely enough that most counties land inside a narrow band. If the results were only ordinary midterm variation with no stable relationship to the prior presidential share, that single 0.85 rule would not place 94% of the counties inside the same band. The fact that it does is the observation.
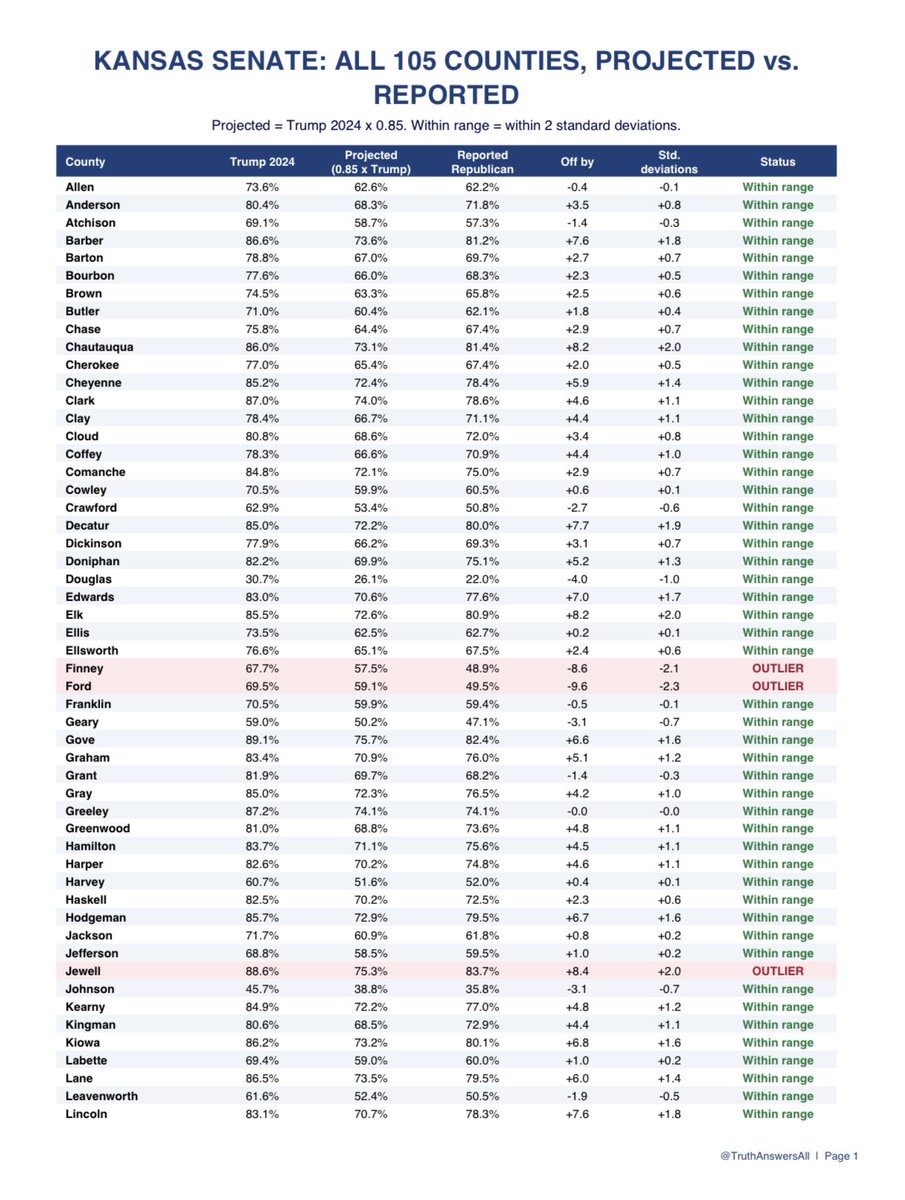
KANSAS: THE 15% GAP, COUNTY BY COUNTY
The 15% gap held across the Senate map. Here’s Kansas, all 105 counties. 94% of counties fell within range: 99 of the 105.
Below the formula: Seward, Ford, Finney. Meatpacking counties in southwest Kansas.
Above the formula: Wallace, Sheridan, Jewell. Three of the reddest ranch counties in the state, about 90% Trump.
What the formula tells us: If a county is below the formula, the proportion of Democrats to Republicans who voted was higher than in 2024. If it’s above the formula, the proportion of Republicans to Democrats was higher than in 2024.
Why this matters:
This isn’t a statewide average hiding the normal county to county variation underneath. The same 15% shows up in counties with hundreds of voters and counties with hundreds of thousands of voters. The few that break from it break in predictable directions.
One rule works at the state level and the county level. That’s not what scattered voter decisions usually look like.