One of the biggest mistakes i used to make is buying stocks after they’ve gone green 3 days in a row off the lows.
At that point, the easy money has already been made.
Continuation becomes harder because:
• Early longs take profits
• Late buyers chase
• Risk increases, not decreases
• Momentum and volume dries up
When looking for new positions, you want tight price action near they moving averages
Tight structure = defined stop
Defined stop = ability to size
Sizing correctly = long-term survival
Waiting for a high tight flag to form and the moving averages catch up will give you the highest odds of a great entry.
If a stock is in fact beginning a new trend there will be plenty of opportunities to buy it
You must be patient for high probability setups.
As @Qullamaggie said - Trading is all about " PATTERN RECOGNITION"
So everything changes like :-
Time Frame changes
Script changes
Year changes
but the pattern remains same & repeat itself day and day out.
Memorize this pattern to improve your trading.
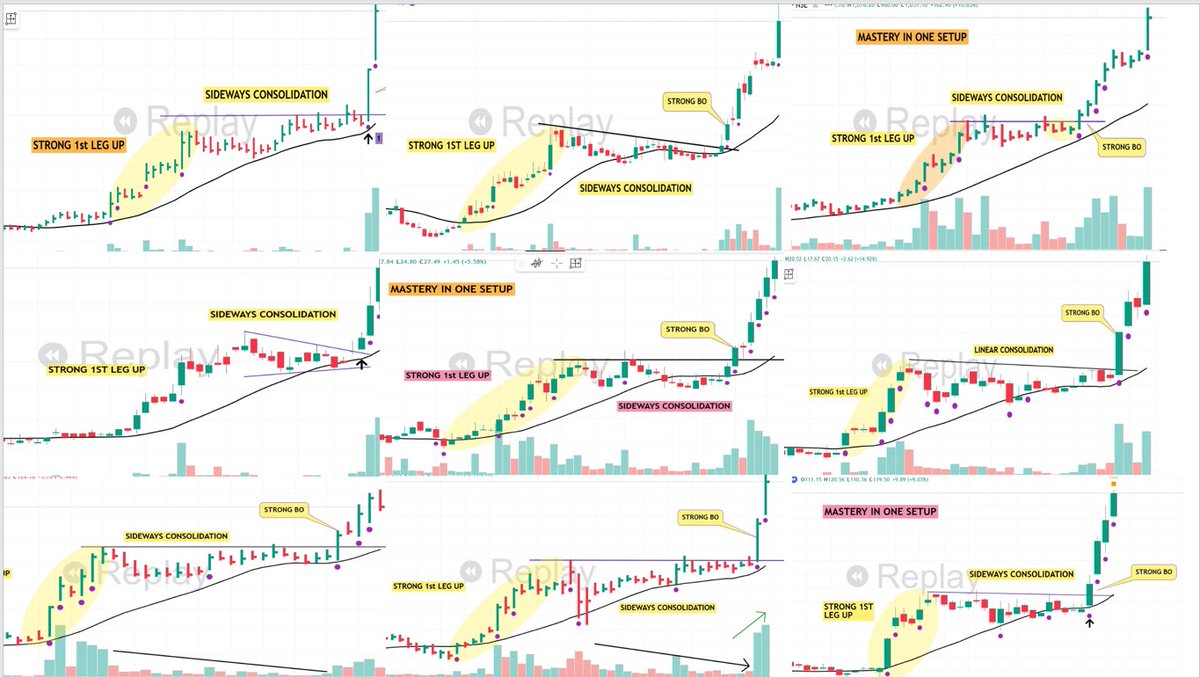
Focus on One Setup
When I say focus on one setup, people think I mean you should only trade one setup forever. That’s not the point.
I say it because when you study one setup deeply, you learn it inside-out how it forms, how it develops, where the entry is, and where you should book your profits. You understand the entire story of that setup.
And once you truly understand one setup, learning other setups becomes easier.
Because every setup has a rhythm, and when you master one rhythm, your mind starts catching the beat of others too.
One setup becomes the foundation for many setups.
For beginners, this is even more important.
You don’t need ten tools.
You need one tool you can trust blindly.
There’s another reason I push this so much.
When you go through a tough phase and trust me, if you survive long enough, you will your bread-and-butter setup becomes your safety net. It’s the one thing you know better than anything else.
It’s the setup that pulls you out when nothing else is working.
In trading, depth beats variety.
Master one, and the rest will follow.
"They can manipulate Price, but cannot manipulate volume: Richard D. Wyckoff"
Institutions leave their footprint in Volume form.
So, I have created my own Screener to determine the Institutions (FIIs & DIIs) Footprint.
Criteria:
- Daily Move > 5%
- Volume > 2*SMA(20) = 100% up than 20DMA avg Volume
If you want this scanner, comment "Volume". I will DM you.
You must follow me so I can DM you!
#Scanner | #StockMarket | #Nifty
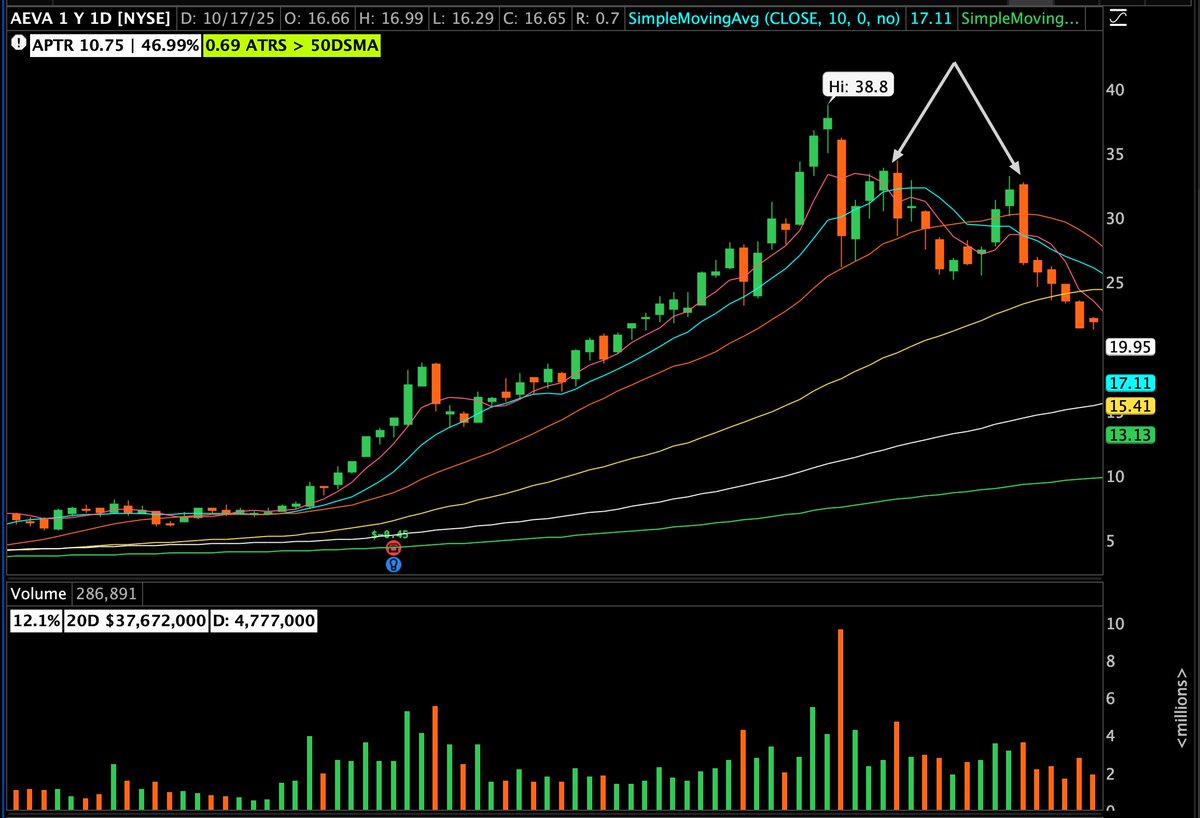
I forget what @Qullamaggie stream it was, but he talked about these 3-day bounce shorts and i've added the setup to my playbook recently. Lets use $AEVA as an example:
1. Huge linear move up.
2. Nasty character changing red day.
3. Finds support on SMA.
4. Three day bounce squeezing the chasers.
5. Short the fourth day green to red failure.
This is a true "backside" short setup. Ill be stalking Quantum and metals names for this setup mid/late next week.
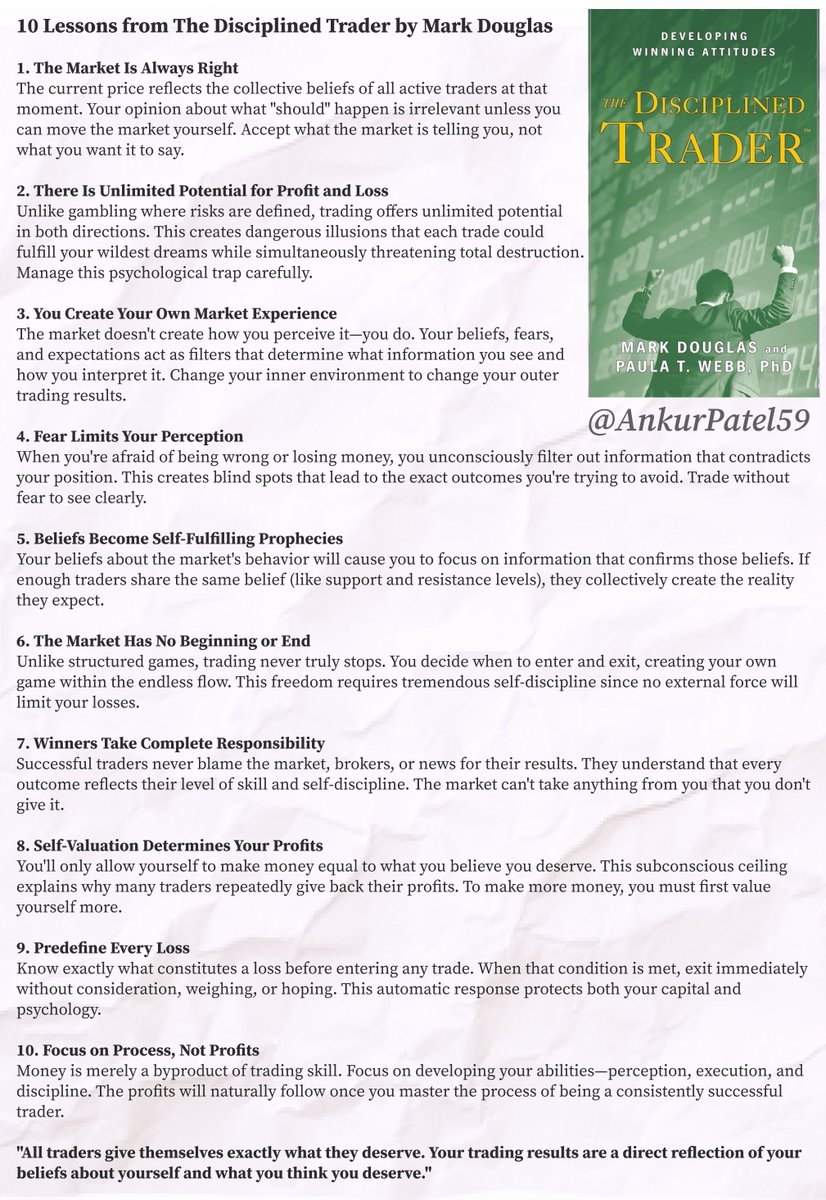
Your brain is literally programmed to lose money in markets.
The same mental patterns that make you successful in life will destroy you as a trader.
Mark Douglas figured out how to rewire your trading psychology.
Here are his 10 insights:
Qullamaggie Motivation - How to Never Work a Day in Your Life
“Everyone needs to do this. If you haven't done this yet, if you're struggling, if you're not getting the results you want - you get TC2000. Click US stocks. There's almost 5000 stocks here.
Then you go to the monthly chart. Start looking at every stock that made a big move. Just go back and look.
Look at daily charts and even intraday charts going back 10, 20 years, 30 years. And then you start looking for patterns, okay? You will see the exact same setups I trade, they happen over and over again. And you're probably gonna find your own setups. At least 3-5 patterns that occur over and over and over again.
You need to build a foundation. You can't just trade blindly, following some other trader, being in these alert services, no. You need to develop your own expertise. You need to develop your own setups. Things you believe in. Things you have backtested that you know work.
That's pretty much where all your problems stem from, not knowing what the heck you're doing.
You need to spend at least 1000 hours doing that study. If you do it 3 hours per day, it's going to take you a year. And you will have a skill for life. You only need to do it once. And you probably won't have to work a day in your life.
But you need to do this, OK?
@BullMichael8 Sure, there you go...
https://t.co/uqHysQppgS
You can also look to populate it automatically as outlined in this post from @DaoTraderX 🙌
https://t.co/10MTFL8CZM
Are you paying attention?
Bitcoin is now up +55% since its April 2025 low, hitting a RECORD $115,000.
Meanwhile, the US Dollar just had its WORST start to a year since 1973, falling nearly -11% in 6 months.
This is not a coincidence. Let us explain.
(a thread)
It's official:
The Fed's Reverse Repo Facility (RRP) is now down ~$2.5 TRILLION from its peak in December 2022.
The US is borrowing so much debt to fund deficit spending that the RRP has been DEPLETED to a 1,386 day low.
What does it mean? Let us explain.
(a thread)
While trends are sustained by beating expectations and raising guidance, this isn’t how bottoms are formed.
Bottoms are formed when positioning has been flushed out and often reversed to short.
The assets do not put a bottom in when news becomes better, but when they peak and can’t get worse. The space from the worst to neutral news is the first stage of the recovery.
The market rises in anticipation of the shift to positive revisions both by earnings power and news, not when they happen.
Thus I become extremely interested when:
News:
• “Uninvestable”
• “The worse numbers in xyz”
• “Capitulation by long fund xyz”
Positioning:
• Traders and funds that were very bullish are now short or “won’t touch ever again”
•Top crowded short idea
•Short positioning in proxy index highest in xyz
Chart:
•Sideways for 6months to multiyear
Overall the mood near bottoms is fearful and focused on smaller timeframe issues and potential hazards. The truth is much of the discount is already engrained into the market and the rise against the news flow begins.
Reasons for the rise are only known months into the future but by then the market usually already made its first big move.
This phase is then often followed by major chasing and emotions which is why the swings phase is usually extremely choppy ( $SHOP and $NFLX examples).
This phase took about 2-3Qs during the 2024 US recovery. This flushes out chasers, optimists and alike.
Only then do the earnings stabilize and the beat and raise scheme continues into the true new bull market.
Despite common belief, waiting for a breakout out of phase 1 and positioning later on proves very difficult. This is why I prefer to be involved during the phase 1 building phase such as my China long now or in the USA back then.
I do not pretend to be able to pick bottoms but I try to listen to the bottom process and trust in the ability of human nature to strive for progress to guide us out of the predicament. This phase presents the biggest discounts and deals.
The sheer amount of multiyear backwinds and recovery make up for the less accurate entry and can subsequently used to pyramid.
Earnings season is here, and the best way to take advantage of it is by mastering one specific edge:
The High Volume Edge.
This is the same pattern that made traders like @Qullamaggie millions.
Here's everything you need to know (so you come prepared to start next week):
We've mentored thousands of traders.
One common issue we see with those in the boom and bust phase is that they don't have a consistent approach to position sizing.
Here are 3 different ways that market wizards position size (that you can steal and make your own):
—
1. Risk a Fixed Percentage of Capital
• Michael Marcus suggested risking only a small portion of trading capital on each trade.
This approach prevents a single loss from wiping out the account. For example, he moved away from betting his entire capital on one trade after suffering significant early losses.
Notice how your position sizing approach is actually based on your risk first — something many struggling traders do not grasp.
Example: Most successful traders do not risk more than 1% of their equity on any given trade. If you have a $100,000 account, you are only allowed to risk 1%, which means $1,000 per trade.
This approach does not yet take stop losses into affect, so let's move on:
—
2. Position Size Using Stop Loss Levels
• Traders like Marcus and Ed Seykota recommended using stop-loss levels to define the maximum allowable loss on a position.
Position size should be determined by calculating the difference between the entry price and the stop-loss level, ensuring the total risk aligns with the predefined percentage of capital.
Example: To take the scenario above (with your $100,000 account only risking 1% of equity) one step further, let's now look at what this approach means using a stop loss.
If you've found a stock to enter at $100, and a logical stop loss based on the chart is $90 ($10/share), you can now calculate your position size.
→ Entry price: $100
→Exit price: $90
→Total risk per share: $10
→Allowable loss to the position: 1% equity, or $1,000
Based on the math, you can buy 100 shares. This represents a 10% equity position.
So you've now calculated 1% risk, and know you are within your parameters to have a 10% position size.
—
3. Adapt Size to Market Conditions
• Position sizes can be adjusted based on market volatility. In calmer markets, larger positions may be appropriate, while in volatile conditions, smaller positions reduce the risk of large losses.
Example: Let's say you use the 21-day SMA as your 'market health gauge'.
→ When the market trades above the 21-day SMA, you're allowed to risk 1% of your account on each trade (and your position size would vary based on your stop loss level).
→ When the market trades below the 21-day SMA, you're only allowed to risk 0.25% or 0.5% of your account on each trade.
This approach allows you to bend with the market — increasing risk when the environment is favorable and decreasing it when it isn't.
—
The 3 methods above combine important concepts:
· Having a risk-first approach
· Defining your size based on your risk
· Listening to the market environment
If you're a struggling trader (unprofitable or not able to keep the gains you make), you'd be surprised at how consistent position sizing will quickly improve your performance.
🦁
More past big winners to study from the 2020 strong uptrend. Many current leaders are doing the same thing - support at 21 & 50 day areas and moving on price and volume action. From ‘Monster Stock Lessons 2020-2021’