🚀 New Feature (!!): Screener AI Assistant (BETA)
Over the years, TradersLab's screener has become incredibly powerful.
More filters.
More flexibility.
More ways to build exactly the screen you want.
But with that came more complexity.
So instead of simplifying the screener...
We taught AI how to use it. 🤖
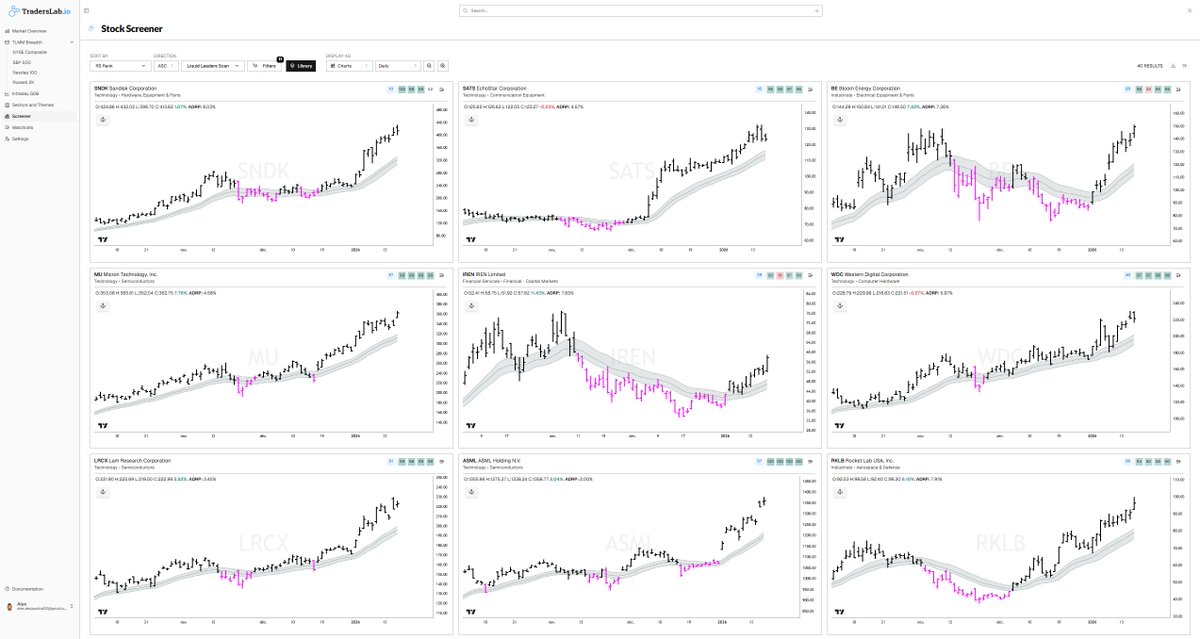
Simply describe the screen you want to build in plain English.
Examples:
✅ "Find stocks up 15% in the last 10 days that are now tightening."
✅ "Create a Liquid Leaders pullback screen."
✅ "Modify this screen to focus on higher ADR names."
✅ "Exclude biotech and tighten liquidity requirements."
Whether you're creating a brand new screen or improving an existing one, the AI helps translate your ideas into screener filters—making it faster than ever to test new concepts.
It's still BETA, and we're improving the model every day, but it's already becoming a huge productivity boost.
AI shouldn't replace the trader.
It should help the trader spend less time building screens and more time finding opportunities.
👀 P.S. We also quietly released another BETA dashboard this week...
We aren't announcing it just yet, but if your process revolves around market leadership, market rotation, and generating high-quality trade ideas, you're going to like what's coming.
Stay tuned. ✌️
🇺🇸 4th of July Special for New Members
Thinking about joining TradersLab? Now's a great time.
For a limited time, new subscriptions receive 25% OFF your first 3 months with code FOURTH.
TradersLab helps you stay on the right side of the market by identifying:
• The current market model & regime
• The strongest leading groups and themes
• The stocks showing institutional leadership
• Relative strength before it becomes obvious
• Powerful dashboards built for swing & position traders
Spend less time searching. More time executing.
Happy 4th of July! 🎆
Themes Lab Update !! 🚨
Small improvement, but one that I think adds a lot of value.
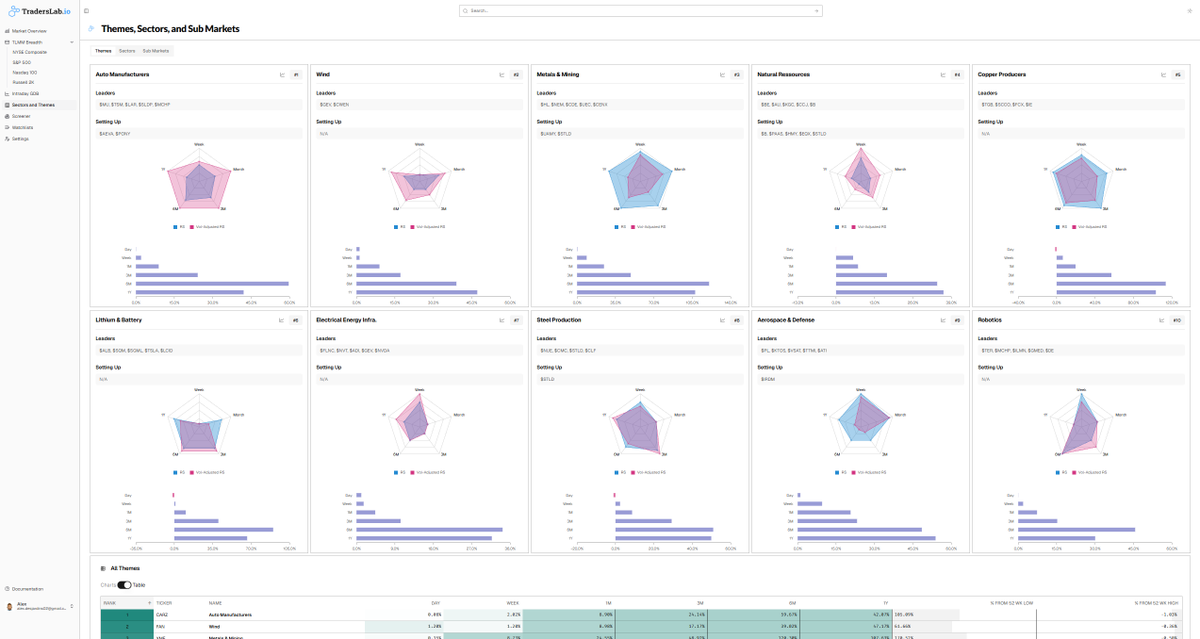
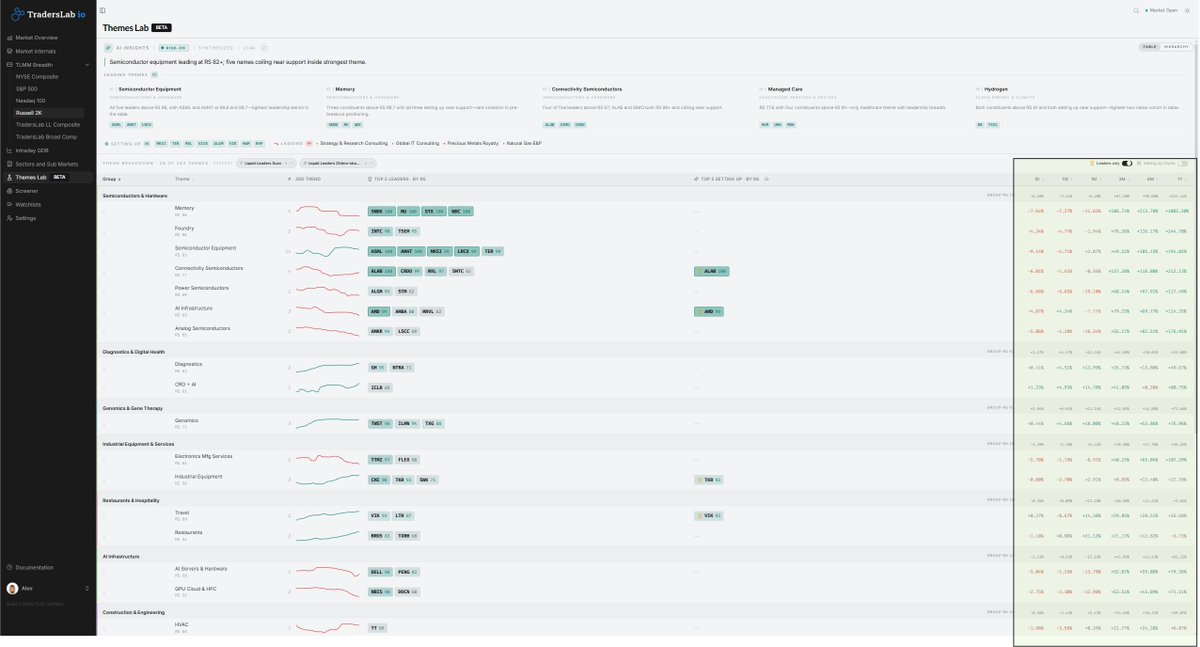
Based on member feedback, we've added the multi-timeframe performance table directly into the main Themes Lab dashboard.
You can now quickly see how each theme has been performing across multiple timeframes (1D, 1W, 1M, 3M, 6M and 1Y) without leaving the page.
The goal with Themes Lab has always been simple: make it easier to identify institutional leadership through a top-down process. Every small improvement gets us one step closer.
Thanks for all the feedback—keep it coming!
Tlab team💪
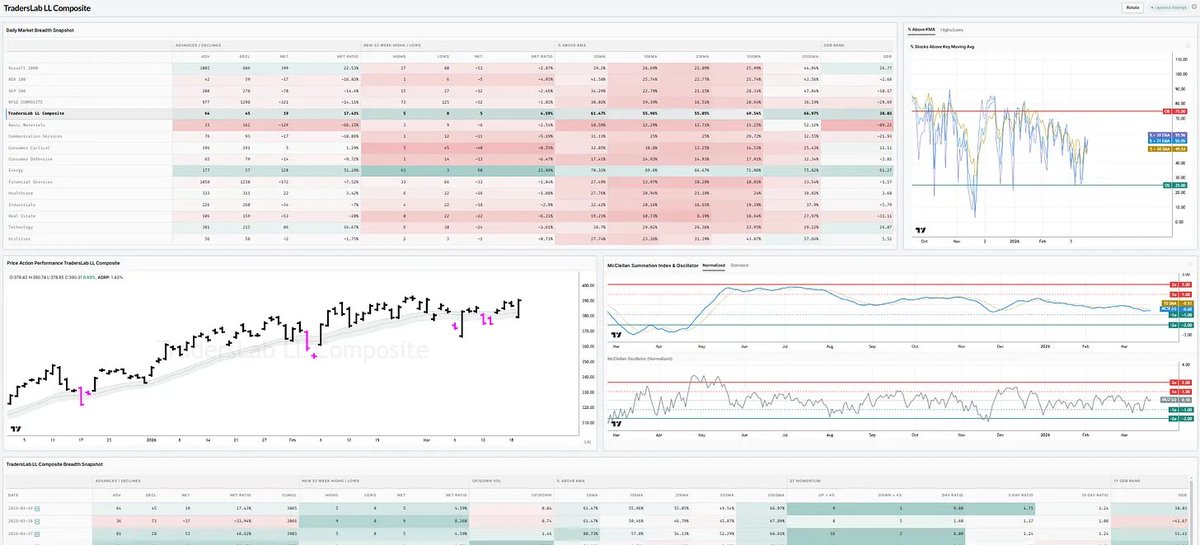
360° LIQUID LEADERS TLMM Dashboard
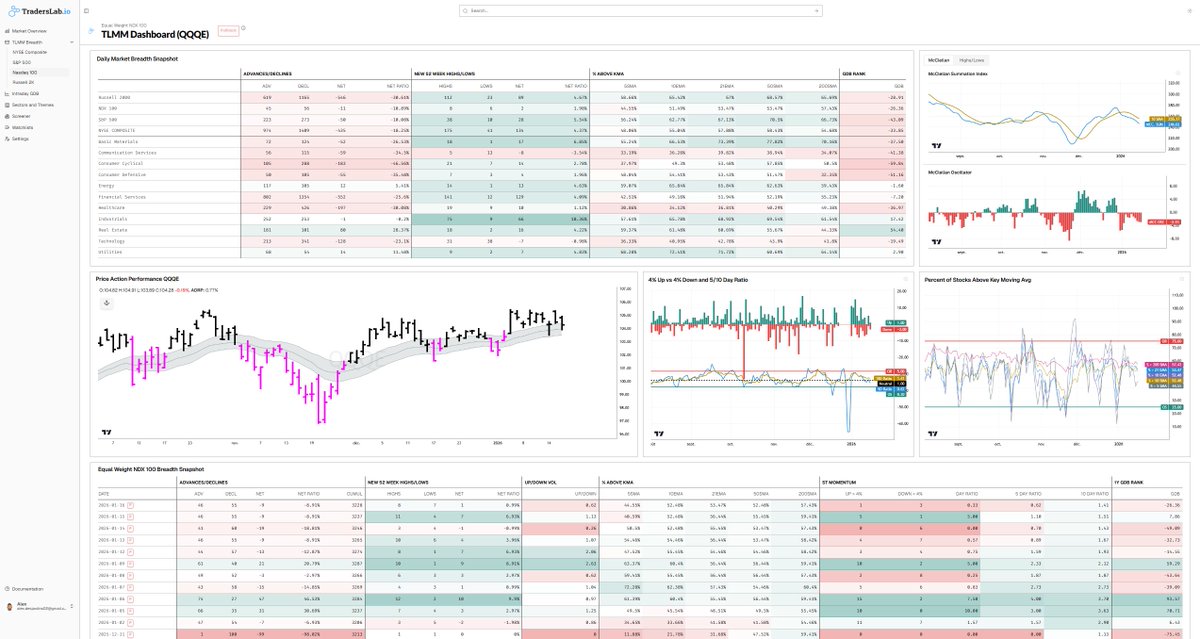
Something we're cooking in Tlab, but still in test. Interesting action of the 100-ish top Liquid Leaders basket I trade (The LL scan I share each night).
They backtested the 21dma-structure after another higher low and a DTL breakout & retest setup. (as a whole, that's like an ETF chart). MCSI also flipped up 2 days ago, and after a hook-down at the open, breadth in leaders quickly came in to re-confirm the MCSI uptrend.
That gave very good clue to engage the leaders this morning at the open when it was bought right into support like that.
We are right up against the 10dma, so we'll need confirmation with that reclaim in the next few days. That's something I can share in the Prime Report & in here if there is interest while it's still in testing.
Most traders don’t lack effort — they lack structure.
TradersLab is built for those who take markets seriously.
A complete analytical research environment designed to help you read market conditions, track breadth, and make cleaner decisions.
Professional tools. Rational workflow.
$29/month👉 https://t.co/VSZTb1o3T0
We built https://t.co/GEJpgVvdaY because I got tired of jumping between 5 tools to understand what the market was doing, when to engage, what to engage, and when to wait on the sidelines.
It’s the same platform I use daily for my own execution, and also in PrimeTrading dashboards — breadth, momentum, sectors, Liquid Leaders, pullback setups — all in one place.
A tool that I personally believe every serious swing trader should use.
Try it 1-month free with the code TRIAL → https://t.co/GEJpgVvdaY
🚨 NEW feature in TradersLab 🚨
IBD / CANSLIM traders → this one’s for you.
The RS Line is now natively integrated across TradersLab.
Quick reminder:
RS Line = stock performance vs the market
• Rising RS → outperforming
• Falling RS → lagging
Now you can see RS Line + its MA on all charts & mini-charts (Markets, Sectors, Themes, Scans, Watchlists).
Turn it on once in Settings → shows everywhere. Leadership, at a glance.
More to come!
Tlab team 🫶
TradersLab Update: Our New Home Page is Live everyone !!!
Our new Home Page is live — built around the full top-down approach:
market → sectors → groups → stock setups.
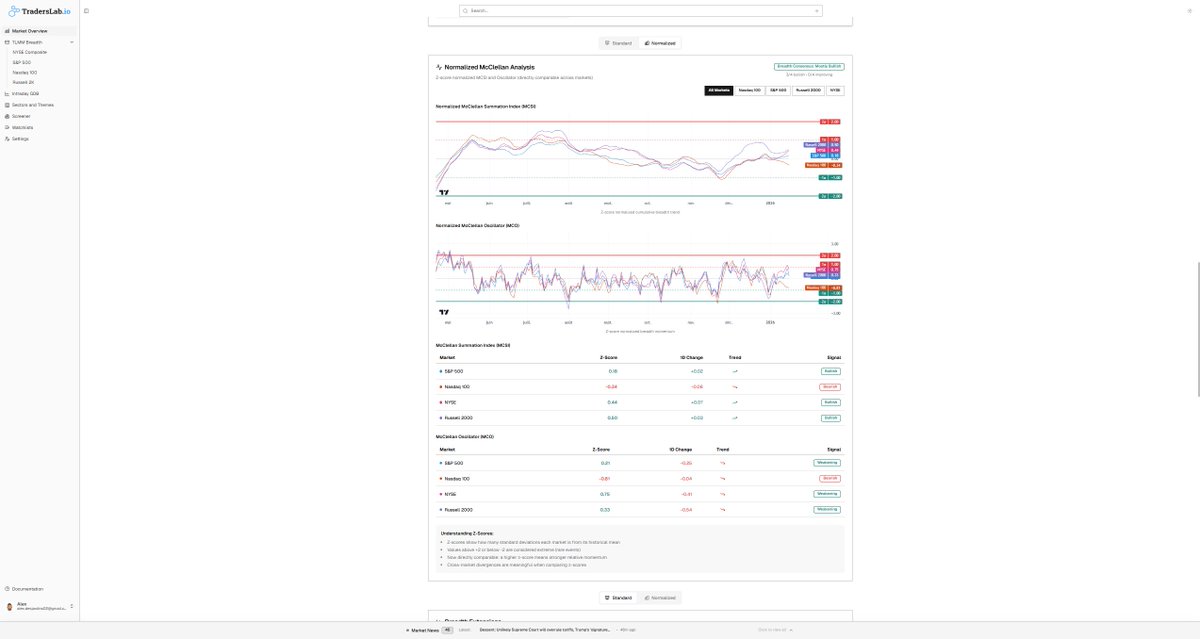
New features include normalized breadth indicators like the McClellan Oscillator & Summation using z-score normalization, making signals more consistent and actionable.
📅 Webinar: Wednesday 12:00 PM EST
We’ll walk through the new tools and explain how to use them. It’ll be recorded — come with your questions.
https://t.co/WzrJht5APl