Cutting-edge platform designed to help traders streamline their decision-making process with a top-down market analysis to uncover high-potential opportunities.
🎥 Free Webinar — How Alex Desjardins Uses TradersLab in His Own Process
Join us for a special live session where Alex Desjardins, a full-time trader, owner of PrimeTrading, and co-founder of TradersLab, will explain how he uses the TradersLab platform in his daily routine.
From market timing to building watchlists, scanning for setups, and managing trade execution, this is a behind-the-scenes look at how a seasoned swing trader integrates TradersLab into a real-world trading workflow.
🗓️ Friday, May 23 at 13:30 EST
📍 Live-streamed in our free community Discord
👉 Access here: https://t.co/1KwYzbveKS
📼 The session will be recorded for those who can’t attend live
✅ Like, comment, and share this post for a chance to win:
• A TradersLab T-shirt & baseball cap
• And one lucky winner will receive 3 months of free access to the platform
Don’t miss this opportunity to see how one of the traders who helped build the tools uses them.
See you there!
Built Themes Lab dashboard🧪 to answer one question every morning:
Which groups are leading — and who's leading inside them? (!!!)
One screen. Beta is live.
Steel is now #1 on @TradersLab_ top ten themes. This is tied to AI infrastructure and physical robotic builds. Another way of playing the old picks and shovels play. They are literally using picks and shovels to get the iron ore…
@PrimeTrading_ As a @TradersLab_ subscriber myself, I love this new feature. Easy to see what groups are leading and even the leading themes within the leading groups. Super cool
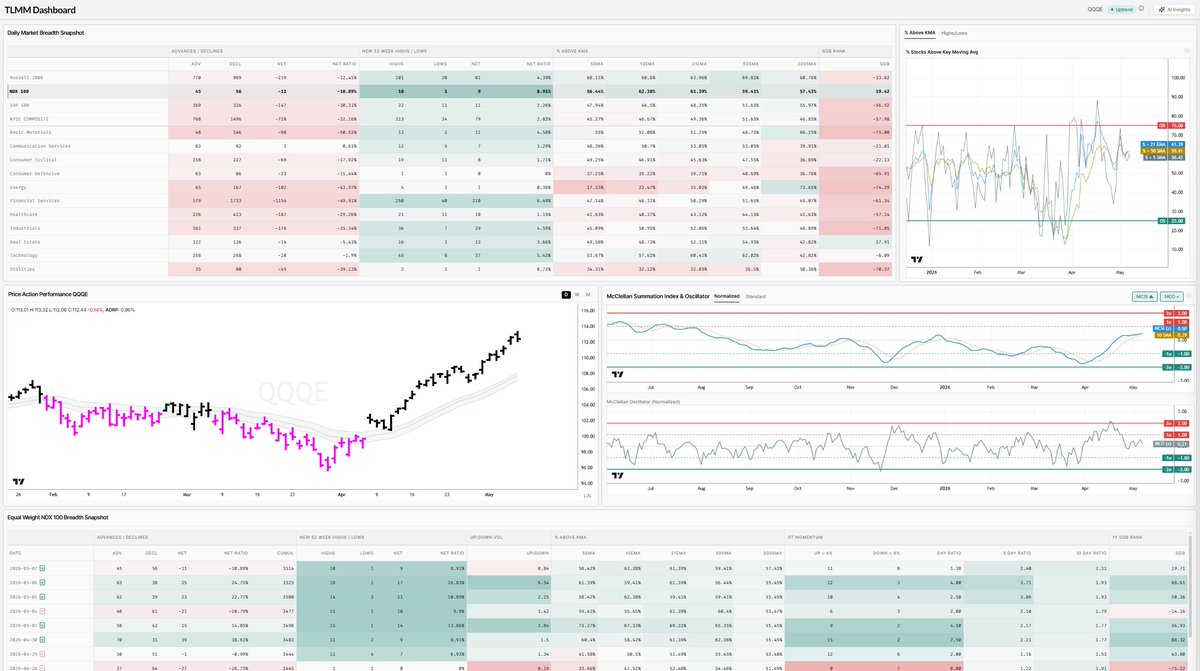
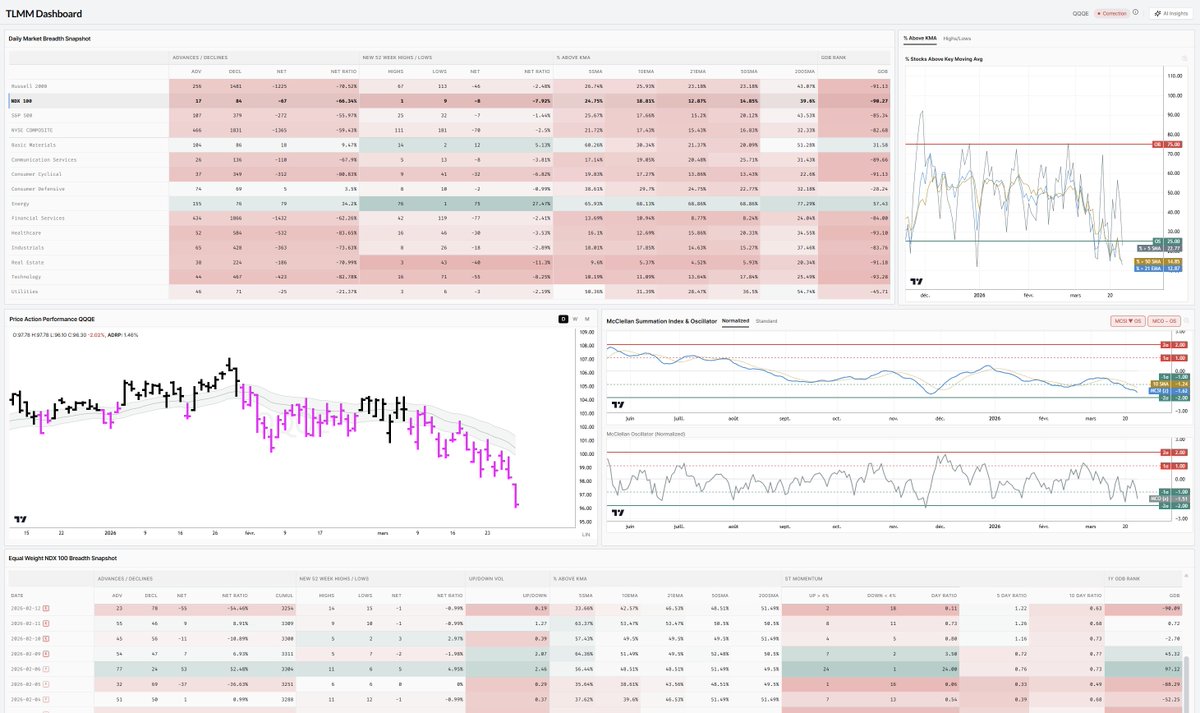
📊 TLMM Dashboard — Uptrend
Tape is constructive: $QQQE trending cleanly above the 21dma-structure area with breadth internals turning back up after a healthy reset.
📈 Price Action ($QQQE)
Trading 112.44, well above the 21dma-structure area
Clean stair-step trend off the April lows — consecutive higher highs, no distribution character
Mild -0.14% daily pullback, ADRP 0.96% (orderly)
🌡️ Breadth Internals (MCSI / MCO)
MCSI z-score 0.50, above a rising 10dma (0.39) → constructive backdrop intact
MCO z-score 0.21 — neutral, neither oversold nor overbought
Translation: trend is on, no exhaustion signal, no dip signal yet — carry positions, no chase
👀 Breadth Snapshot
$NDX 100 leading: 61.4% above 21EMA, 59.4% above 50SMA, GDB rank +19.4
New highs/lows: NDX 10/1, Russell 101/20 — broad participation under the surface
Sector standouts: Technology (60% > 21EMA), Real Estate GDB +27.9
Laggards: Energy (-74 GDB), Utilities (-70), Industrials (-71) — defensives + cyclicals soft, classic risk-on rotation
Takeaway
Regime: Uptrend, risk-on. Lean long, respect the 21dma-structure area on $QQQE as the line.
MCO neutral means next oversold dip is the buy — not chasing strength here.
Watch: MCO push above +1σ = caution flag. Loss of 21dma-structure area + MCSI rolling under 10dma = regime change.
By: @TradersLab_
We just released a new Market Internals page on TradersLab. 👀🔥
It brings key cross-asset data, credit spreads, volatility, rotation, rates, commodities, and crypto into one clean view with mini-charts. You can fully customize it to track what matters to your process, and use it to quickly read the broader environment behind price.
There’s also a small layer starting to build on top to help interpret these signals… more on that soon.
Hope you'll enjoy that new addition... and stay tuned for more releases soon!! 🙂
Tlab team ✌️
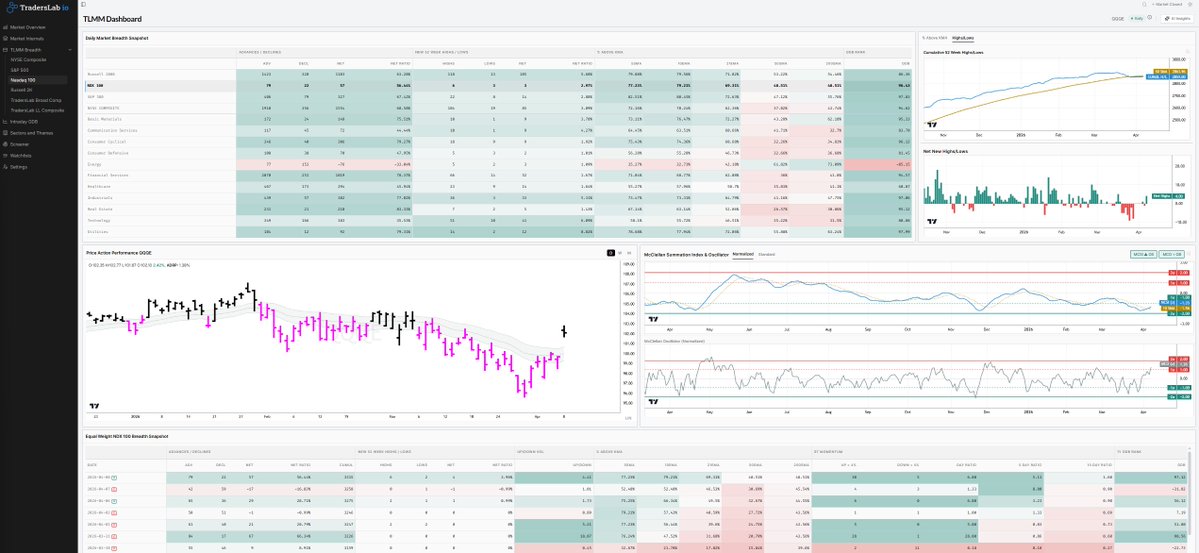
360° MARKET VIEW $QQQ TLMM Dashboard
The NASDAQ is caught between short-term bounce mechanics and intermediate-term deterioration. Price structure is split: the 21-EMA is rising and price is above it, but the 50-SMA is flat-to-declining and price has broken below it. This is a classic setup for a rally that lacks structural confirmation.
The McClellan Summation Index recovery is a positive signal for breadth stabilization, but it must be watched closely—if MCSI rolls over below its 10-day moving average again, it would confirm that the distribution phase is resuming.
Participation at 44.5% above the 50-SMA is the key constraint; healthy rallies typically see this metric move toward 55%+. The dominance of new lows over new highs and the persistent negative Global Daily Breadth (-63.5) suggest that leadership is not expanding into the rally, which is a red flag for sustainability.
Watch for:
(1) whether participation can expand above 50% above the 50-SMA,
(2) whether the 50-SMA can stabilize and begin rising, and
(3) whether new highs can begin to expand relative to new lows. Until these confirmations occur, this remains a countertrend rally vulnerable to reversal.
360° MARKET VIEW $QQQ TLMM Dashboard
The rally is real but contextually fragile. Extreme breadth readings (GDB +97, MCO Z +1.08) typically mark inflection points rather than continuation signals, especially within a downtrend.
The reclamation of the MCSI 10-day moving average is a positive technical development, but it must be sustained and followed by actual participation expansion (% above 50-SMA moving above 60%) to signal a structural shift.
Watch for:
(1) whether MCSI continues higher and breaks above zero,
(2) whether participation quality improves materially in the next 5-10 days, and
(3) whether the 50-day SMA begins to flatten or rise. The current setup favors a pause or pullback in the near term given the extreme short-term extension.
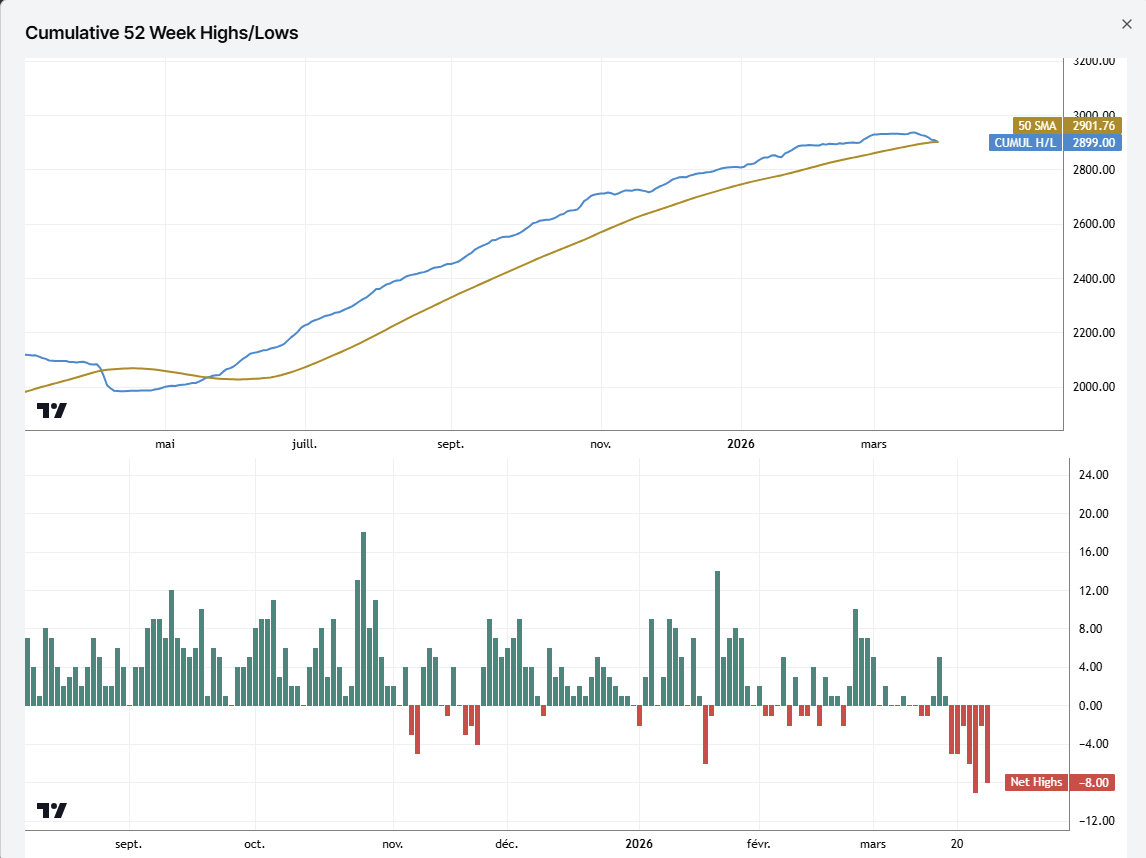
Leadership expansion remains the key missing piece—new highs are not broadening, which limits the conviction of this rally.
The correction is confirmed by broken price structure and deteriorating breadth. The 5-day breadth thrust (+86 GDB) is notable but must be contextualized: it represents a recovery from extreme weakness, not a trend reversal.
For a meaningful uptrend to resume, NASDAQ would need to
(1) reclaim the 50-SMA around 102.03,
(2) see the McClellan Summation Index reclaim its 10-day moving average, and
(3) expand participation back above 40% of stocks above the 50-SMA.
Currently, only 27.7% qualify, which is well below healthy levels. Leadership expansion is stalled (cumulative net highs-lows at 2868 vs 50-day average of 2874.8), confirming that new highs are not driving the market. The 21-day deterioration in all major breadth metrics (participation down 23.8%, ad-net down 48, GDB down 79 points) establishes the corrective trend as the primary regime.
Watch for stabilization at the 50-SMA as a potential inflection point, but confirmation would require breadth expansion, not just price bounce.
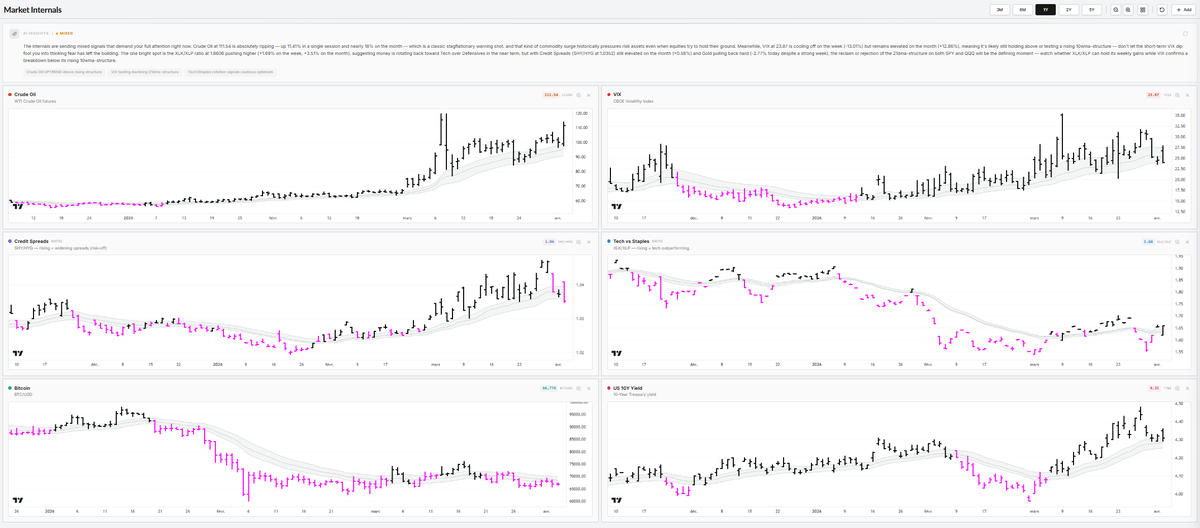
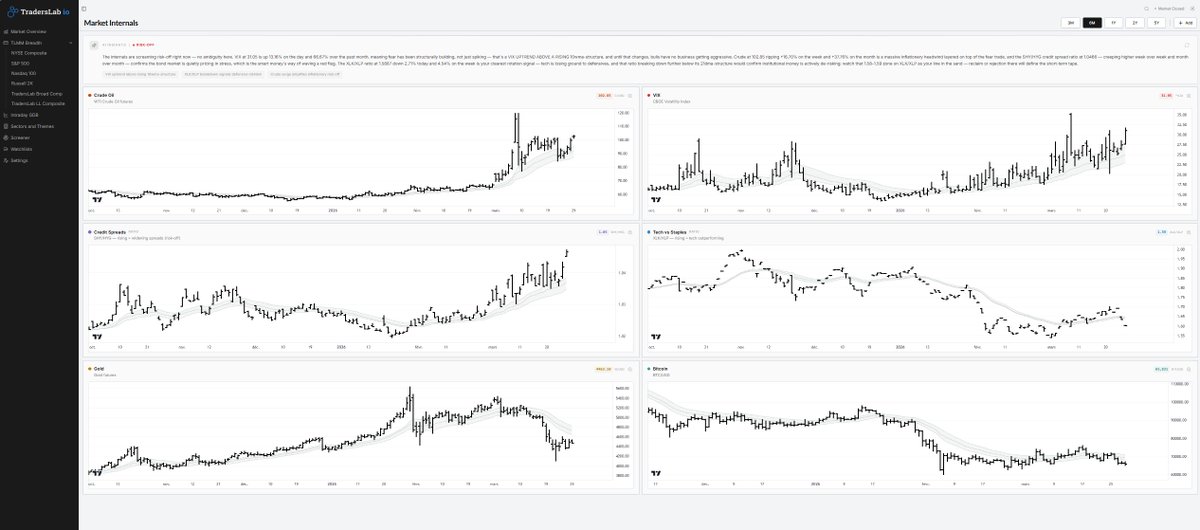
Market Internals - MIXED
The internals are sending mixed signals that demand your full attention right now. Crude Oil at 111.54 is absolutely ripping — up 11.41% in a single session and nearly 18% on the month — which is a classic stagflationary warning shot, and that kind of commodity surge historically pressures risk assets even when equities try to hold their ground. Meanwhile, VIX at 23.87 is cooling off on the week (-13.01%) but remains elevated on the month (+12.86%), meaning it's likely still holding above or testing a rising 10wma-structure — don't let the short-term VIX dip fool you into thinking fear has left the building.
The one bright spot is the XLK/XLP ratio at 1.6606 pushing higher (+1.69% on the week, +3.51% on the month), suggesting money is rotating back toward Tech over Defensives in the near term, but with Credit Spreads (SHY/HYG at 1.0352) still elevated on the month (+0.58%) and Gold pulling back hard (-2.77% today despite a strong week), the reclaim or rejection of the 21dma-structure on both SPY and QQQ will be the defining moment — watch whether XLK/XLP can hold its weekly gains while VIX confirms a breakdown below its rising 10wma-structure.
• Crude Oil UPTREND above rising structure
• VIX testing declining 21dma-structure
• Tech/Staples rotation signals cautious optimism
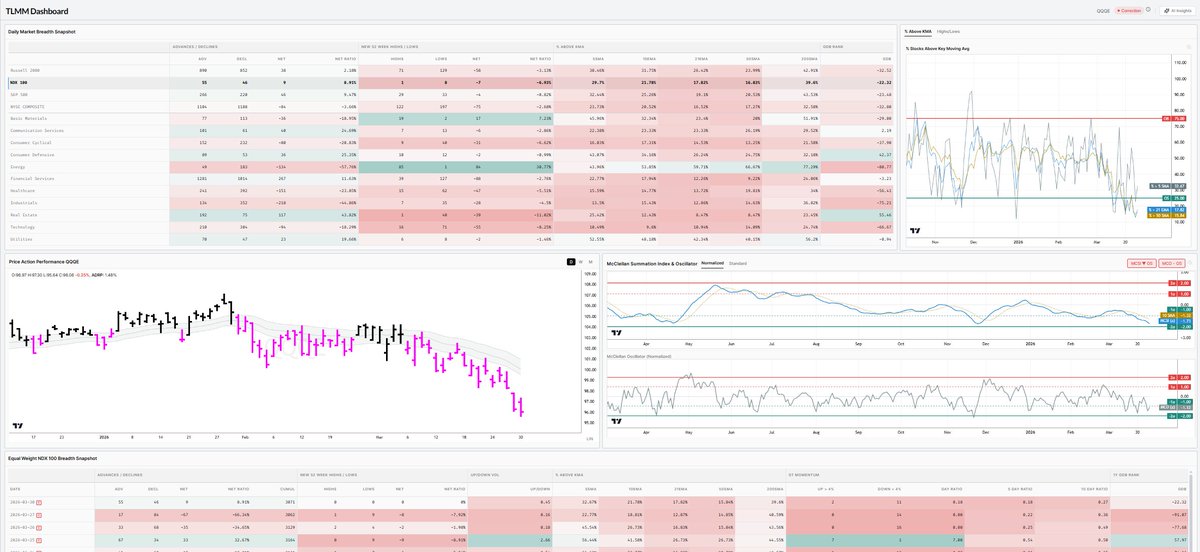
360° MARKET VIEW $QQQ TLMM Dashboard
The correction is confirmed by price structure failure and breadth deterioration.
Key observations:
(1) Participation has fallen sharply—only 24.8% above 50-SMA is well into weak territory;
(2) The 21-day GDB swing (+113 to -52) suggests a reflexive bounce may have exhausted;
(3) Advancers are still leading on a net basis (+21 A/D net today), but this is masking internal weakness—volume is upside-dominant but participation is collapsing, a divergence typical of late-stage rallies;
(4) The MCO Z-score of +0.30 is not extreme, suggesting room for further deterioration before an oversold bounce becomes likely;
(5) Leadership is not expanding (cumulative net highs-lows below 50-DMA), which is a red flag in a correction. Watch for MCO to reach -2.0 Z-score or lower for potential oversold inflection.
Confirmation of a bottom would require MCSI reclaiming its 10-DMA and price stabilizing above the 21-EMA.
$QQQE running into declining 21dma-structure, while MCSI is following through on yesterday's hook-up.
Interesting picture as indices are running into potential overhead supply.
The extreme Global Daily Breadth reading (+97) warrants scrutiny: it reflects concentrated upside in a narrow set of leaders rather than broad participation.
With only 19.8% of stocks above the 50-SMA and leadership contracting, this breadth thrust is a distribution event masquerading as strength. The MCSI below its 10-day MA is the critical signal—it confirms that participation is not expanding despite the headline breadth number.
Watch for MCSI reclaiming its 10-day MA (15.23) as a confirmation signal; failure to do so suggests the correction continues. Price must reclaim the 21-EMA (100.04) and ideally the 50-SMA (102.32) to signal structural recovery. The up/down volume ratio at 23:1 is extremely elevated and unsustainable, suggesting volume is concentrated in a few names.
This is a tail-risk setup where the appearance of strength masks underlying weakness.
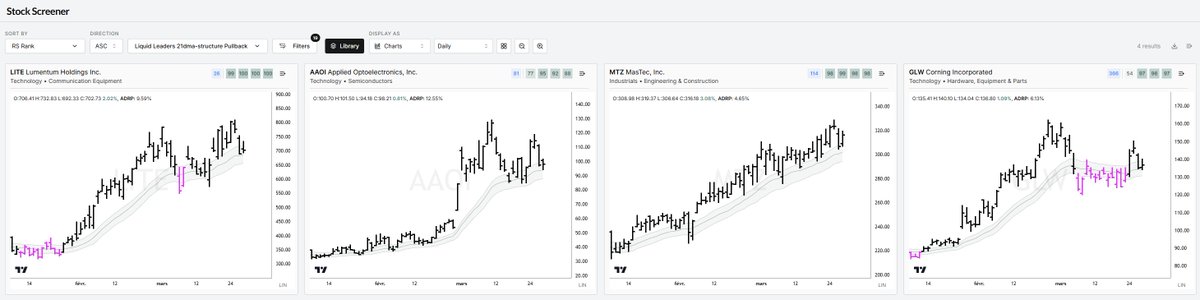
Impressive day for the liquid leaders, with +5.2% move, as the composite index tries to reclaim the 21dma-structure, and MCSI to hook up.
The next few days should be interesting for this basket of stocks. $SNDK, $LITE, $SATS, $WDC, $ONDS, $FIVE, $CIEN, $PL, $TSEM, $STX, $FSLY, $BE, $VRT, $MTZ, $DOCN, $GEV, $TER, $NBIS, $MKSI, $ATI
360° MARKET VIEW $QQQ TLMM Dashboard
Correction is well-established with no price structure support. The 21-day deterioration in participation (-35.6 percentage points in % above 50-SMA) is severe and suggests broad-based selling rather than sector rotation. Leadership is not expanding (cumulative net highs-lows at 2877 vs 50-day MA of 2880.72).
Key watch: whether MCSI can reclaim its 10-day MA (17.92) to signal early breadth stabilization, or whether it continues lower. Price needs to reclaim 102.32 (50-SMA) to challenge correction thesis.
Current flags include volume downside dominance, weak participation, and tail risk to the downside. The one-day bounce in MCO and GDB may represent a short-term oversold condition, but without participation expansion and price structure recovery, it lacks conviction.
Market Internal - RISK-OFF
The internals are screaming risk-off right now — no ambiguity here. VIX at 31.05 is up 13.16% on the day and 66.67% over the past month, meaning fear has been structurally building, not just spiking — that's a VIX UPTREND ABOVE A RISING 10wma-structure, and until that changes, bulls have no business getting aggressive.
Crude at 102.85 ripping +16.70% on the week and +37.76% on the month is a massive inflationary headwind layered on top of the fear trade, and the
SHY/HYG credit spread ratio at 1.0466 — creeping higher week over week and month over month — confirms the bond market is quietly pricing in stress, which is the smart money's way of waving a red flag.
The XLK/XLP ratio at 1.5887 down 2.71% today and 4.54% on the week is your clearest rotation signal — tech is losing ground to defensives, and that ratio breaking down further below its 21dma-structure would confirm institutional money is actively de-risking; watch that 1.58–1.59 zone on XLK/XLP as your line in the sand — reclaim or rejection there will define the short-term tape.
Our proprietary TLMM Trend Model has signaled a correction since Feb. 9th. Since then, the price/breadth/momentum is clear that this market is under-distributed.
Photonics of the last group standing right at their rising 21dma-structure. Can they hold and resist the market pressure?
That scan is getting thin, and it's normal considering the market environment.
Liquid Leaders 21dma-structure Pullback sorted by RS Rank.
$LITE, $AAOI, $MTZ, $GLW
By @TradersLab_