Myth:
Your PF stops earning interest if you are unemployed for 3 years.
Fact:
Your EPF keeps earning interest up to the age of 58.
The “3-year rule” is where most people get confused.
It does not mean:
You left your job at 30 → no PF contribution for 3 years → interest stops.
That is not how it works.
The 3-year rule is linked to an account becoming inoperative after specific events:
1. Retirement
2. Permanent migration abroad
3. Death
The 55-year logic also matters here.
EPFO considers 58 as the key age because it is 36 months after the retirement age of 55.
So the actual takeaway is simple:
Your PF does not stop earning interest just because you were unemployed for 3 years.
But this does not mean you should ignore old PF accounts.
Before withdrawing or forgetting your PF, check whether:
- your old PF is linked to your UAN
- your transfer is completed
- your passbook shows the full amount
- your EPS service is carried forward
- your KYC and exit date are updated
Half-knowledge makes people withdraw PF in panic.
Check your PF before you touch it.
Run a free “CheckMyPF” scan on FinRight. Comment for the link.
#EPFO #ProvidentFund #PFClaim #PersonalFinanceIndia
@monoscalper Yes, jo stock liya nahi, woh chal gaya, jo liya woh jyaada hi niche aa gaya ! Lets see next week !! One trending week chahiye - like in April !!
🙏Trade of the Day🙏
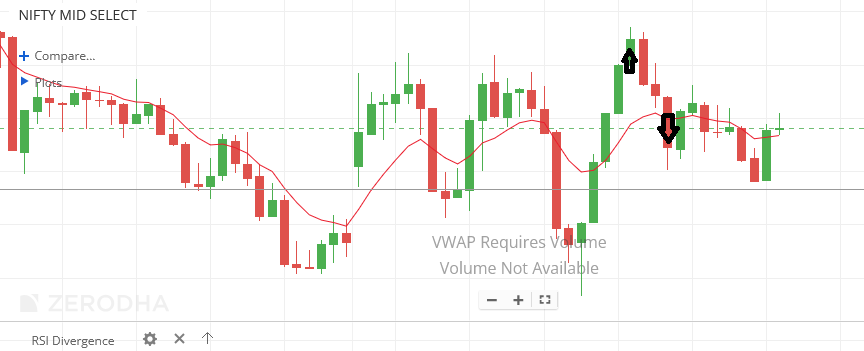
🔴Nifty Mid Select - Thought the breakout would come after the shakeout. Went with normal position size. Did not sustain and had to incur the loss.
Impact: -2%
Days like today remind me of the importance of having profit cushion so that I dont lose your mental peace. Moving on to next week.
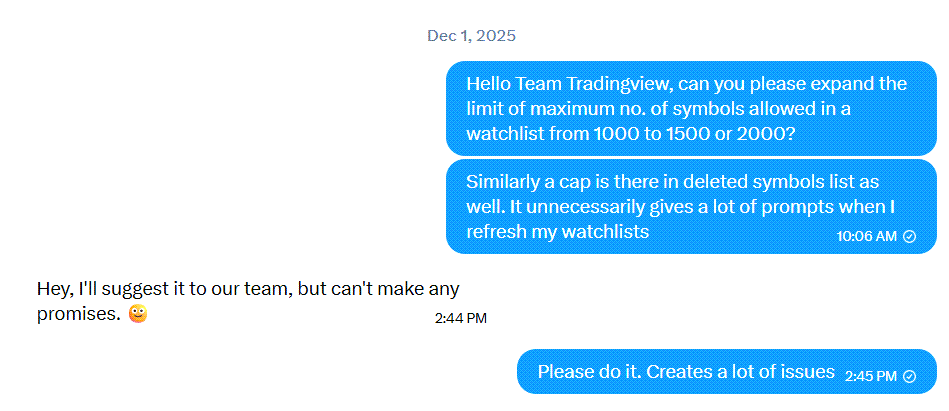
UPDATE AND FOLLOW-UP:
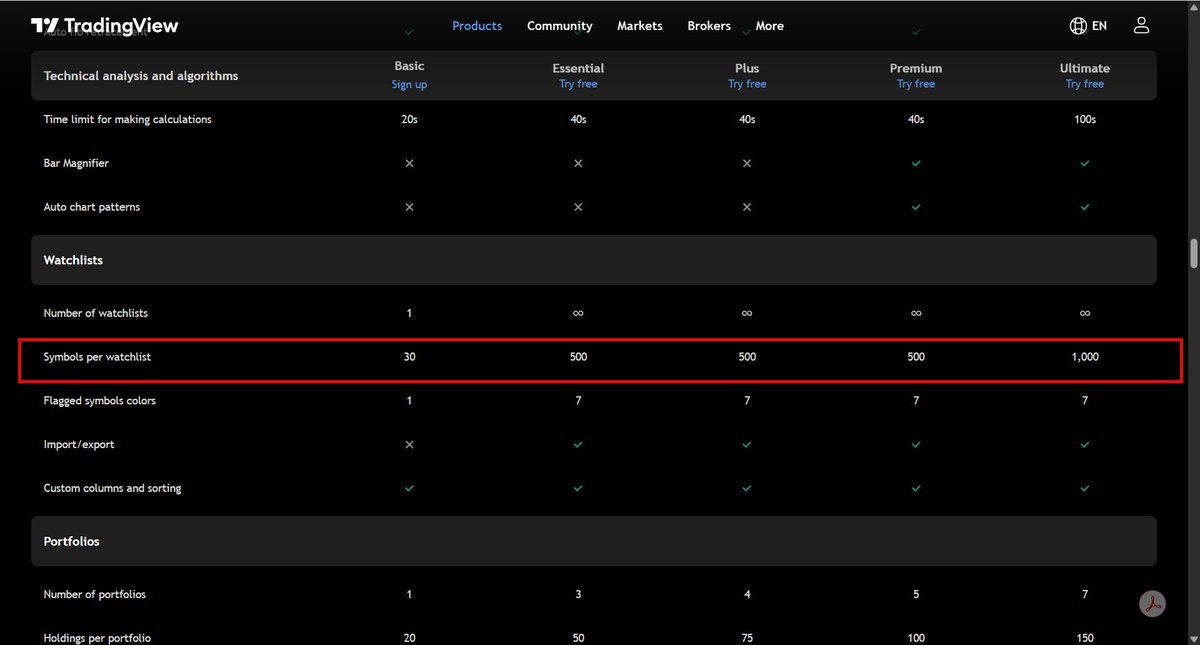
I sincerely thank @tradingview for revising the limits to something more workable for traders who can only afford the entry-level plans.
However, there is still a strong need for TradingView to restore the Premium plan limit to 1000 symbols. This is the highest tier plan that a common retail trader can realistically afford, and they should not be restricted simply for maintaining a larger watchlist while already paying for the best available option in their category.
As I mentioned in my earlier note, this limitation directly affects the usability of the scanner, especially powerful features like scanning on watchlists and watchlist-based alerts.
I have always been a strong admirer of your platform, along with your highly responsive and customer-friendly support. I genuinely believe you will address this as well and not limit your users over something as basic as the number of symbols they can add to a watchlist.
I request everyone to please support this cause. Our unity is our strength, and it will show how many traders are genuinely affected by this change.
Relative Strength (RS) chart highlighting the strong outperformance of the Mid-cap, Small-cap and Micro-cap segments against the benchmark.
On the higher timeframe RS charts, all three segments are showing strong formations indicating the possibility of a strong bullish phase ahead.
These RS charts started turning positive during Feb and early March when market sentiment was still weak and fearful.
This was one of the earliest signs of strength returning after nearly 1.5 years of consolidation in these segments.
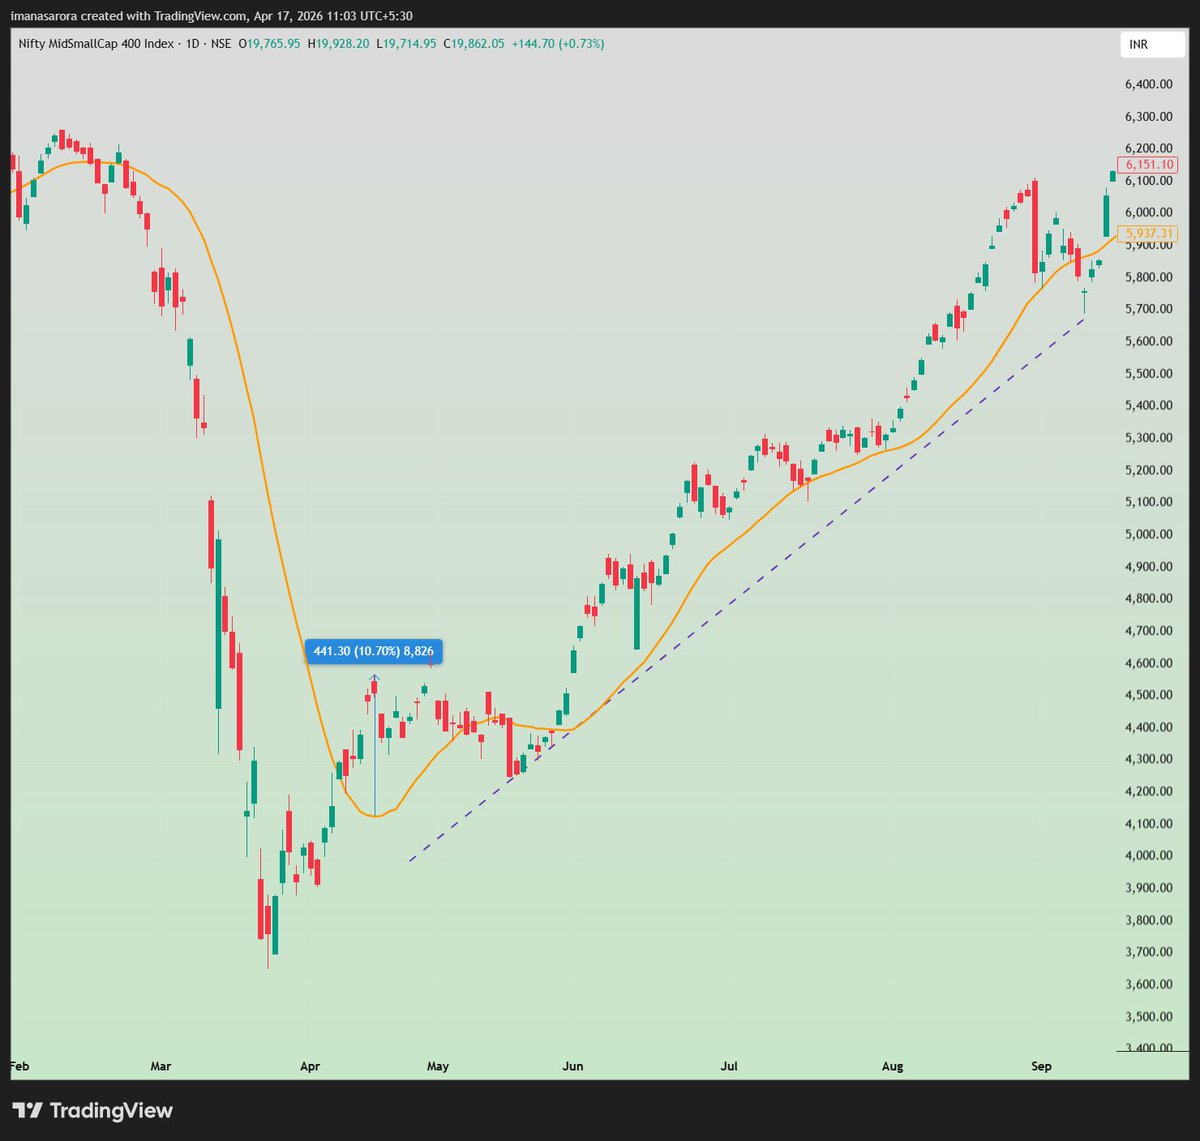
Since the Nifty bottom on 2nd April 2026, nearly 618 stocks out of the top 750 have outperformed the index. Nifty with ~8% return since then is a most underperforming index on NSE.
This indicates that the current rally is broad-based.. a sign of healthy market momentum.
At the same time, market breadth indicators suggest some short-term exhaustion. Breadth readings in the Micro & Small-cap indices are now above 75% which may lead to a temporary pause (price or time correction) in the near term.
Knowing this helps identify which market segments to focus on.. and when to stay away.
But in practical execution, I have seen timing and disciplined execution remain difficult for most people. Momentify portfolios are nice way to participate in such trends.
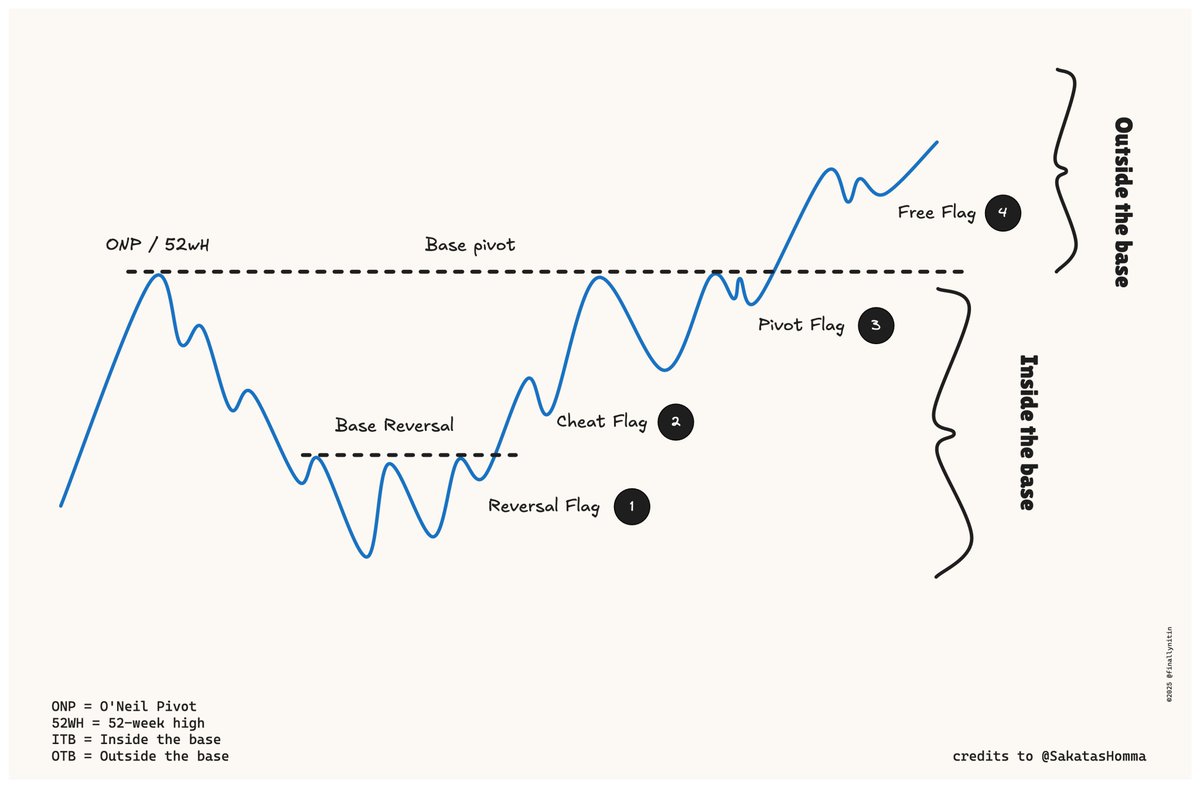
Different types of flags, along with inside and outside bases, help you see how price is behaving within the bigger market structure.
When you understand these patterns visually, it becomes easier to judge the move. This clarity helps you take better trading decisions.
1. Reversal flag
2. Cheat flag
3. Pivot flag
4. Free flag
Idea Credit - @SakatasHomma
Image Credit - Nahi dena 😉 @finallynitin
Six.Months ago, had you asked Claude to build a Cold Fusion Reactor out of discarded aluminium sheets, in the bathroom of your flat and use it to run a computer and design a 2nm chip, it would have done it in 2% of your weekly usage limit
Today if you ask Claude to write a python script that adds 2+2, it takes 40% of your weekly usage limit
AN OPEN LETTER TO TRADINGVIEW FROM AN ADMIRER
I’ve always been a big admirer of the team at @tradingview for what they’ve built and how they’ve transformed the charting experience for traders. I’ve also been quite vocal about the importance of investing in essential tools rather than hesitating over such costs.
However, the recently introduced symbol limits per watchlist, even on paid plans, feel like a step backward. I understand the intent to increase ARPU and push upgrades, but reducing the Premium plan limit from 1000 to 500 symbols is quite restrictive, especially considering it’s already at the upper end of what retail traders in India can afford.
This change feels unjustified and, ideally, the earlier limits should be restored. If that’s not feasible, then at least increasing the caps would be a fair middle ground, bringing Premium back to 1000 symbols, and raising Essential and Plus tiers to 250 and 500 respectively.
Now, one might argue why anyone would need such a large number of symbols in a watchlist and how it actually helps.
What most traders, and even the team at TradingView, may not fully understand about India is the concept of circuit filters enforced by our regulators. This is quite unique to Indian markets. Since international platforms don’t provide a way to exclude stocks based on these filters directly in scanners, we are forced to first eliminate such stocks using local tools.
To avoid illiquid names, especially those stuck in 2% or 5% circuit filters, we have to create a refined “Total Universe” watchlist first. Only then can we effectively run scans on TradingView. If we skip this step and rely purely on inbuilt scanners, results often get cluttered with circuit-bound stocks, which are practically untradeable and hard to filter out afterward.
Currently, National Stock Exchange of India has around 2300 listed stocks. Even after filtering out illiquid names and those under strict circuit limits, we are still left with roughly 900 to 1100 stocks depending on market conditions. This already exceeds even the earlier limits. I had earlier requested increasing these limits, but the recent change has gone in the opposite direction, making it almost impractical to use TradingView’s watchlist-based scanning effectively in Indian markets.
I’ve used multiple platforms over the years, free and paid, desktop and web, and haven’t encountered such restrictive limitations elsewhere. This kind of constraint could actually give competing platforms an opportunity to challenge TradingView, at least in the Indian market.
On behalf of retail traders and the fintwit community, I would strongly request the TradingView team to restore the earlier limits. If changes are unavoidable, then at least consider increasing the limits as suggested earlier.
I’d also urge the fintwit community to support and amplify this, so the importance of this issue is clearly communicated.
Power T&D - 9L Cr investments till 2032
Enough & more for every T&D company to benefit from.
Some names I am tracking:
Transformers - Atlanta Electricals, Shilchar, TARIL
EPC - Skipper, Transrail, Advait, KEC
HVDC - Quality Power, GE Vernova, Hitachi Energy
Others - KSH International, Vidya Wires, Apar, KEI etc.
No reco. DYDD.
How has the recovery been for #MutualFunds after the recent fall ?
I compiled a single-page view for most top #AMCs and the top categories I could fit here, from 30th March bottom to 20th April.
A sharp recovery.
I've included respective #TRI benchmarks as well.
Lesson: stay invested.
A repost would be awesome if you like such data ;)
#MutualFunds #Investing #FinAlpha #Flexicap #Midcap #Smallcap
Situational awareness for today: the market should remain flat or negative. Most of the news coming in is, are negative or flat. Individual stocks may move, especially the defence, auto etc. Other than that, a normal pullback day one.
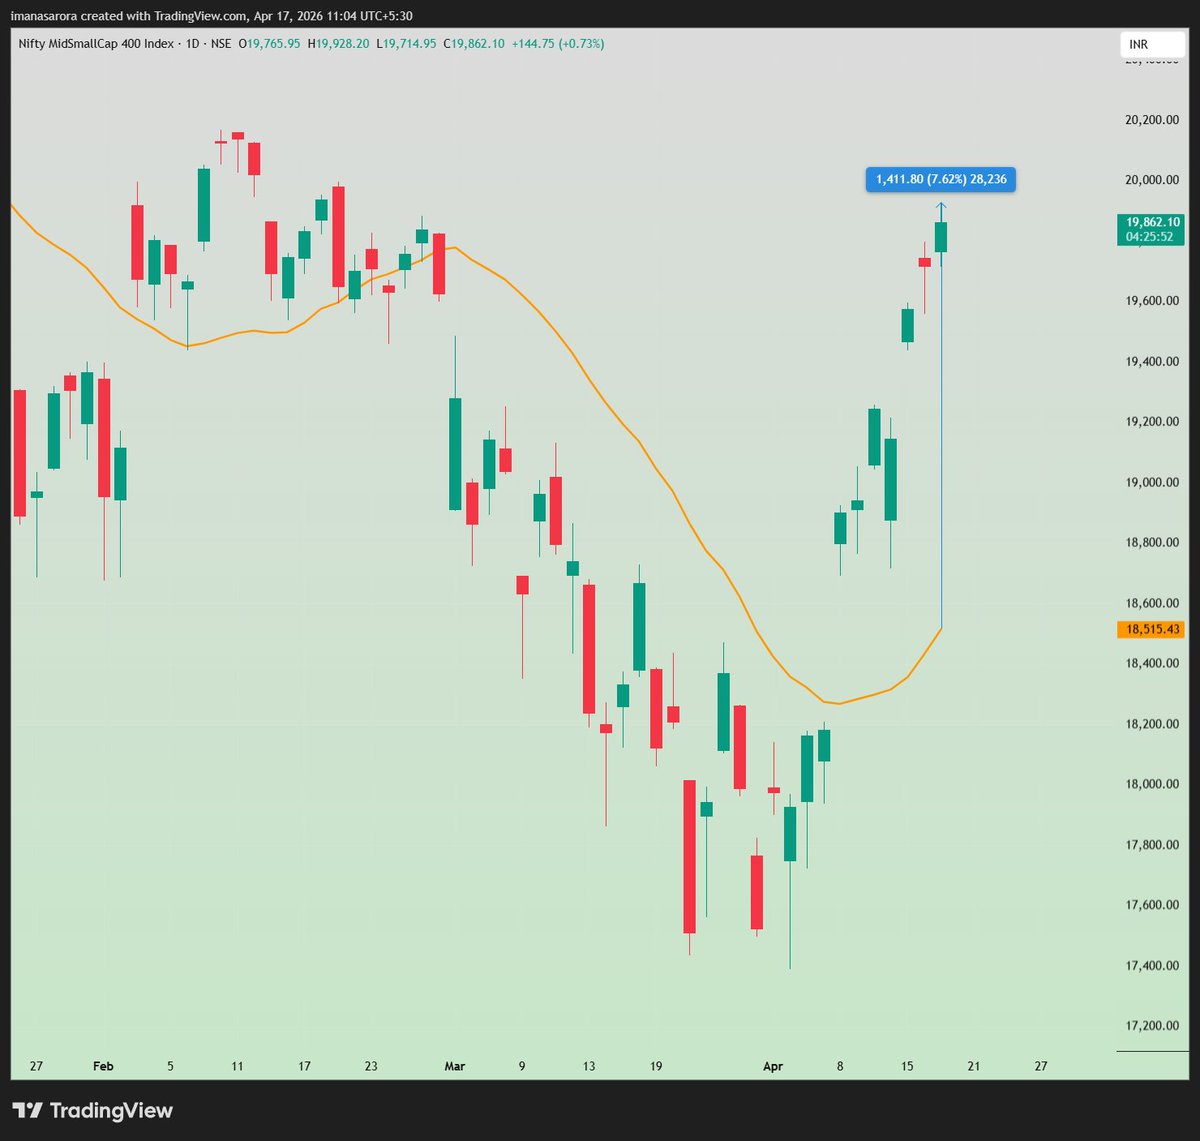
#NIFTYMIDSML400 is now 7.62% away from its 20 SMA.
This kind of move doesn’t come from weak hands. Bulls are clearly in charge.
Last time we saw this was right after the 2020 crash.
What followed was a long, relentless rally.
#Situationalawareness. Today's market looks like a pause or sideways. There is no news coming from the US Iran deal, and most of the stocks for swing look extended. It doesn't look like that it can give trending move. Stock-specific moves are possible for the EPs