While this may sound counterintuitive to many of you $APO stands to benefit the most from a dislocation in private credit and a widening of credit spreads
$APO generated $3.4B in SRE (spread-related earnings) from Athene in FY 2025 vs. $2.5B in FRE for its AM unit
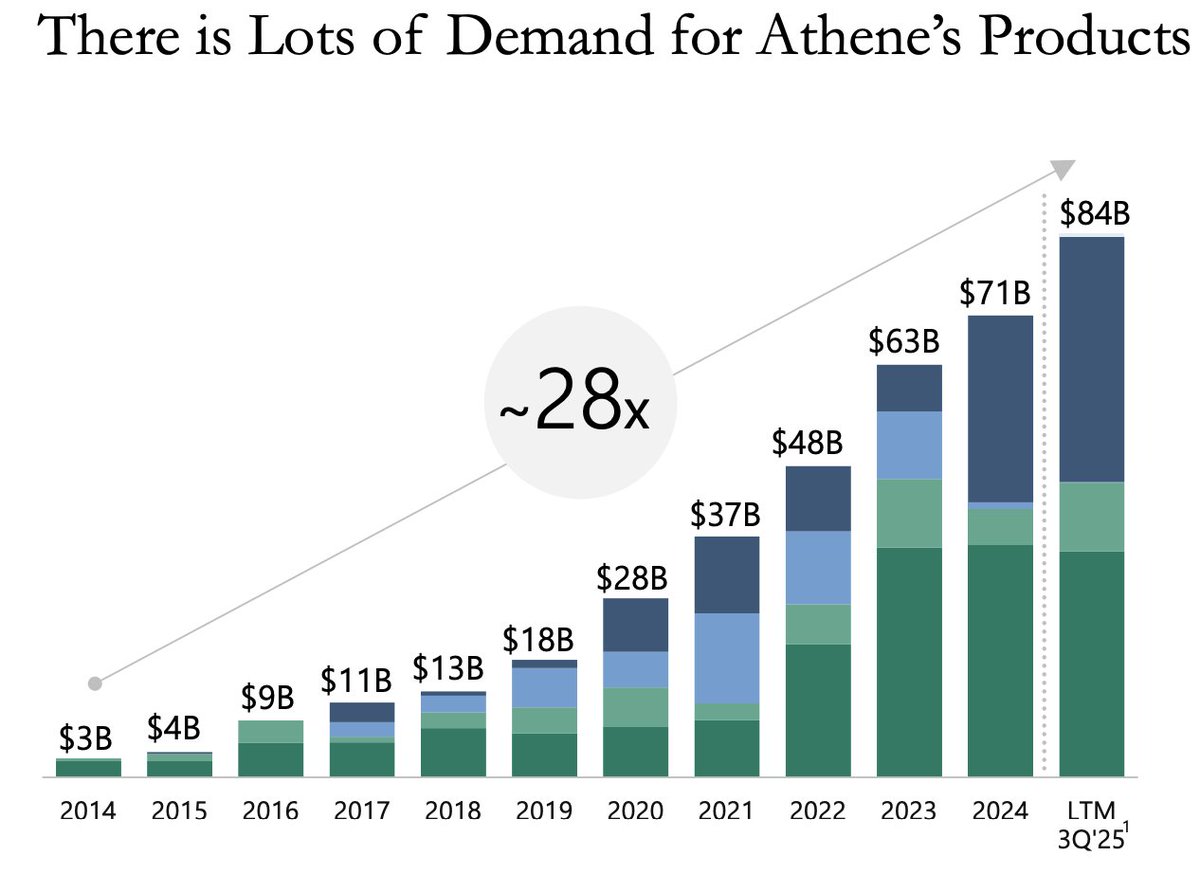
Athene's annuities/products produce net inflows to the tune of $84B a year or ~28% of its net invested assets and the ability to earn a spread on those incremental assets is the NUMBER ONE driver of the $APO market cap - not retail demand for BDCs, not even LP demand for its core funds within its Asset Management umbrella
You will say what about the impact on Athene's existing book? It is 99.7% unlevered (unlike BDCs, private credit fund structures) and sits predominantly in asset-backed (low LTV residential mortgage) and IG (government + corporate). And private IG DOES NOT mean Mickey Mouse loans to mid-scale SAAS companies - these are private placements with Intel, ABInBev, Sony, Microsoft.
In fact Athene is subject to regulatory disclosures well in excess of any Bank/BDC/PC fund and every quarter they file a 5,000 page statutory report detailing every single position and transaction. The autistics among you can check it out here:
https://t.co/3DO8pQThaZ
The Art of Asymmetry
Probably one of the most overused terms on here
Seeing many set-ups that purport to be asymmetric in nature: most likely in the context of being long a common stock and generally lacking a defined timeframe in addition to having wildly overstated right tail distributions
What truly defines asymmetry in my mind are two things: (i) a very tight and quantifiable downside and (ii) an appreciation for probabilistic outcomes and time decay
To illustrate this I will give you two perhaps counterintuitive examples involving (i) bonds and (ii) being short (which most would probably associate with downside asymmetry)
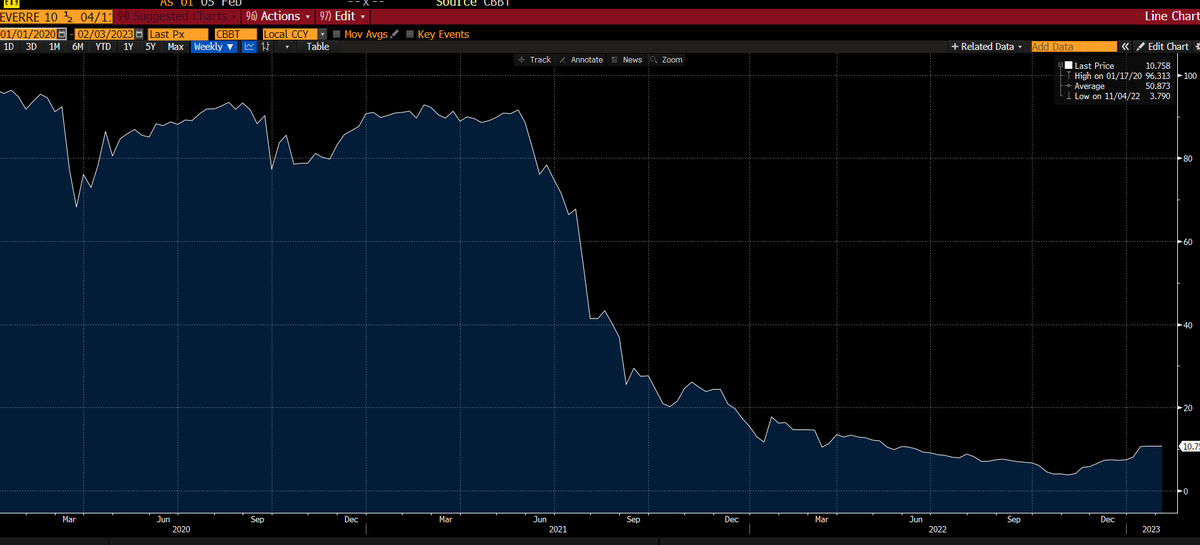
Example 1: China Real Estate High Yield Bonds
Back in December 2021, Evergrande (the poster child for the China RE bust) had already unravelled and its bonds were trading at ~20c on the dollar (Figure 1)
Despite obvious contagion risk, the prevailing view at the time was that the universe was bifurcated towards the "strong" and "weak"
Whilst Evergrande dragged the weaker developers down with it, there was a flight to safety to what the market considered to be "blue-chip" developers
This created a very interesting 3-4 months window where a handful of China RE bonds were trading at or even above par
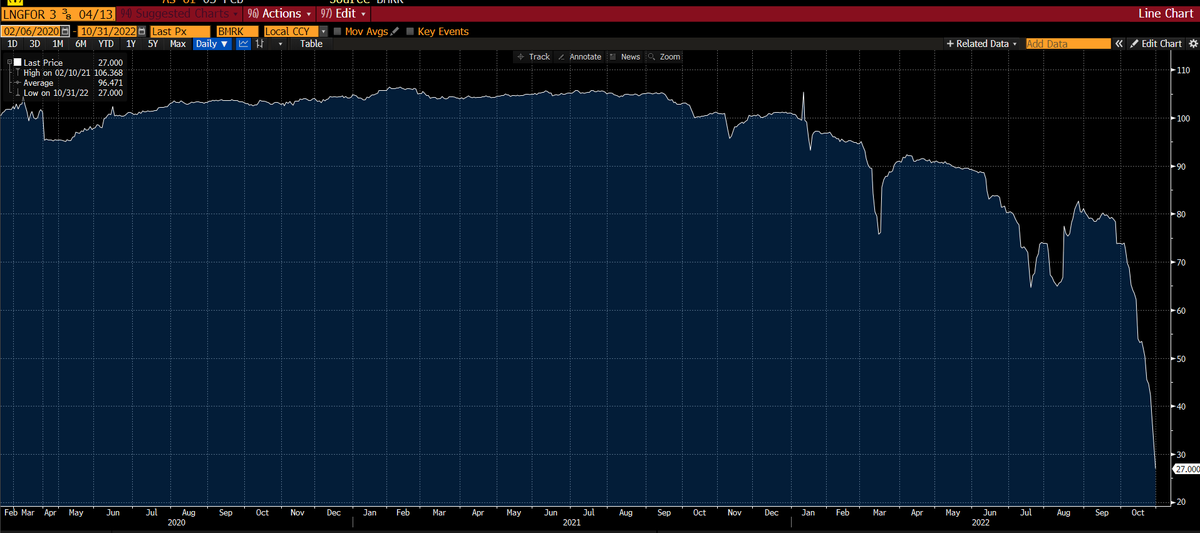
In January 2022, the bonds of Logan for example were trading well above par at ~104 (Figure 2)
What was the probability at that time that China would see a prolonged real estate downturn?
The trade set-up was straightforward: short Logan bonds (and comparable names) at 104 with a very low cost of carry (~1-2% per annum) and a high degree of probability that the contagion would worsen within a short time frame
Sure enough, Logan bonds traded all the way down to 27c in the space of 9 months
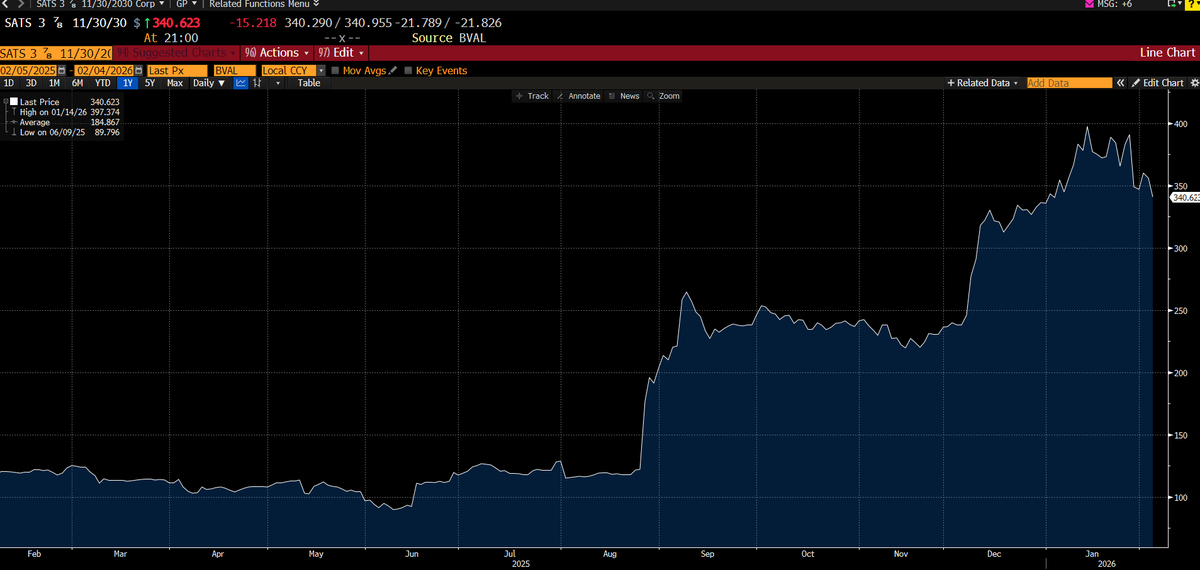
Example 2: $SATS Convertible Bonds
Only 8 months ago, you could buy $SATS 2030 convertible bonds in the low 90s at an implied YTM (yield to maturity) of ~6% (Figure 3)
This was in the midst of the FCC debacle where the forced shift in business model created some capital structure dislocation
The advantage with credit is that, so long as you do the fundamental work right you are rewarded with defined return profiles and hard catalysts (maturity dates)
A sharp analyst will have done the work around the strategic value of the spectrum licenses and taken a view around the probability and extent to which the converts could get back ITM (in addition to being fully comfortable that the 2030s were par paper in any liquidation)
So you essentially had an uncapped return profile to the upside where at worst you were clipping your 6% YTM
Of course we know what a blockbuster trade this ended up being with converts up 3.7x from trough in less than a year
Asymmetry is the holy grail which underpins low drawdown / high sharpe track records. Having many instruments in your toolkit and knowing how to best express a view is what defines a great money manager.
@MrMojoRisinX
Farming pre-IPO stocks on Hyperliquid HIP-3 (SpaceX Edition)
What if you could long SpaceX at under $400B and simultaneously lock-in a $1.5T valuation?
With HIP-3 markets reaching $4B in DTV we are reaching a point where (i) liquidity is becoming meaningful but (ii) large inefficiencies still exist
Combine this with the current pre-IPO pipeline and we have a unique window where there are juicy pair trades galore for those fluent across fundamental stock analysis and perpetuals trading
I model a L/S trade set-up on SpaceX which I believe offers a unique R/R profile and discuss some key considerations
1) Long leg: EchoStar $SATS
Those that have been following already know we like $SATS as the best value proxy for SpaceX (please refer to my prior posts / substack for a detailed breakdown)
With the recent pullback we estimate EchoStar shares today imply a SpaceX valuation of $387B (base case)
2) Short leg: SpaceX on Hyperliquid HIP-3
SpaceX is currently trading at $1.26T on Hyperliquid
Importantly, given most of the market is looking to get long, there is an annual funding rate of 41% (which gets paid to shorts)
One way I like to think about this is in terms of implied forward valuation as a function of actual IPO date - the longer SpaceX takes to IPO the higher the required IPO price for longs to breakeven
Using Jun-26 IPO as a base case this means longs are implicitly pricing in a $1.45T valuation and this rises to $1.8T if the IPO gets delayed till year end
This is very attractive and allows us to implicitly hedge our $SATS position against both time decay and valuation (one of many reasons why I prefer equity perps as a more nuanced tool over prediction markets)
3) Putting it together
I model out the pair trade assuming 1:1 notional with 1.3x leverage on the short leg and examine a range of outcomes at various IPO dates and valuations with the following observations:
a) we are able to generate 50-70% with no downside skew from either valuation or time decay
b) this compares with a $SATS only range of flat to 2x with negative carry on time decay
1/
$SATS EchoStar Updated Analysis
Since we now have a tentative timeline on a SpaceX IPO, its a good time as any to update my NAV analysis and areas of interest as we go crescendo in to the next 6 months. Exciting times.
The key takeaway from this exercise is that at the current valuation of $129 / share, $SATS is still trading at a discount to what I estimate to be a worst case scenario
With a clear catalyst ahead EchoStar represents a high conviction expected value play with a high probability of 40-90% upside within a compressed timeframe
Let's dive deeper into some of the swing factors at play:
1) Value ex-Space X: I estimate there to be $42-53B of asset value to the HoldCo (net of any OpCo debt). The main variables to this are (i) value of the remaining AWS-3 (paired) and (ii) Boost Mobile.
AWS-3 (paired) remains a highly strategic asset and my base case at $2.5 MHz POP is quite conservative in my view.
Boost Mobile is the largest "unknown" and can seriously surprise to the upside if the hybrid MVNO model takes-off and they become a core player in D2C through the SpaceX partnership. If this happens there is probably further upside to my high case.
2) HoldCo liabilities: there is a ~$8B NAV swing between my low and high case which is a function of (i) tower lease litigation and (ii) tax impact from spectrum sales.
On the tower lease litigation there is >$4B of remaining lease obligations as at Q3 and we are taking the full hit in my low case. Whilst we are not privy to the contractual details it is highly unlikely in my view that EchoStar would be liable for the full sum with recourse to the HoldCo. Without going into too much detail the key legal elements revolve around the drafting of the Force Majeure clause (since EchoStar was forced by the FCC to sell its spectrum) as well as the counterparty and guarantor group under the contract. From what I gathered from the case it is likely that the EchoStar subsidiary that entered into the agreement is separate to the spectrum selling entities, is of limited substance and did not provide guarantees. Having said this I am still assuming some settlement amounts in both base and high cases.
On the tax liability from spectrum sales, as I've highlighted previously there is a chance the Company can avoid this all together due to section 1033 of the tax code on forced sales of property (since the FCC mandated the spectrum sale they should qualify for a deferral so long as they reinvest the proceeds)
3) Based on all the above I get to a NAV ex-SpaceX range of $24-42B. Now if we overlay the value of the SpaceX stake, even at the very low-end of the IPO range ($800B) I get to a total NAV of $133-186/share. If the $1.5T rumoured valuation is true then we are closer to $190-243/share. Note that SpaceX is expected to represent >50% of $SATS NAV in my base case.
4) Thoughts on exit / trimming: as we approach fever pitch on the IPO I believe there is a good chance that $SATS trades, at least temporarily, at a premium to NAV (which is not reflected in my analysis). If this happens I would suggest trimming more aggressively as I would expect that premium to flip to a small discount once SpaceX shares are live. On the balance of probabilities I think the $200-250 range is a good area to take some profits.
@transhumanica @BDeveran@ACapitalLP@HighStakesCap
@BostonDynamics just announced the release of its Atlas humanoid Robot
In a robotics sector with limited publicly available opportunities this is one where investors can get in through the backdoor on a pre-IPO basis through Hyundai MotorCo (HMC) 005380.KS
HMC ($49B market cap) indirectly owns ~34% of Boston Dynamics and trades at a very reasonable forward P/E of ~7x (non-adjusted)
This is not my favourite way to play it however
In typical Korean fashion the original acquisition structure is convoluted involving member companies and circular shareholdings
Hyundai Glovis 086280.KS ($11bn market cap) is a smaller entity (specialised in logistics) within the Hyundai sphere indirectly holding ~11% indirect interest in BD
It offers (i) better ratio of BD shareholding to market cap (ii) trades at 5x EBITDA (with 80% historical FCF conversion) and is net cash
Similar to my coverage of Echostar $SATS as a trojan horse ahead of a SpaceX IPO I expect these entities to re-rate as Boston Dynamics continues to roll-out its roadmap ahead of an expected IPO
With the uptick in M&A activity and as the market gets frothier, here is an idea as to where you can park your cash for ~5.5% min yield with ~50% upside (with some luck
Screen for long dated lower dollar cost bonds (< 75c) with change of control (CoC) provisions and identify potential M&A or take-private candidates
With the $55bn EA take-private (and the 2051s gapping up >25 points on the news) nothing is off the table in this market
The one that is jumping out to me are the PayPal 2050s currently trading at 70.7c
$PYPL trades at <10x EBITDA and 10-12 FCF, stock is up 5% yesterday after flat-lining for months at these valuations and option volume is up 4-5x
$EBAY also potentially interesting
Thanks to @randysteuart for the inspiration on this one
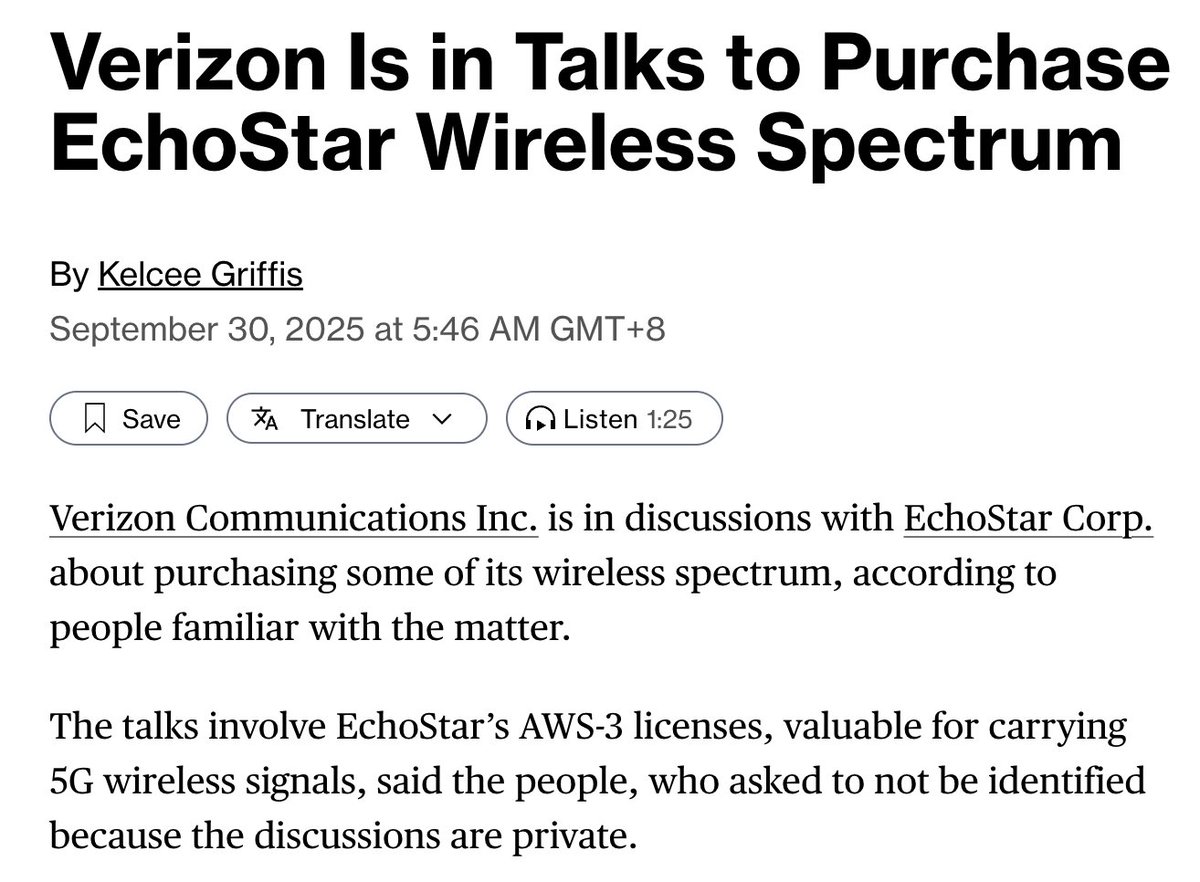
Echostar $SATS in talks to sell some of its remaining spectrum to Verizon
Carrying value for their AWS-3 licenses is $9.8bn (AT&T and SpaceX were at significant premium to carrying)
Will see where this ends up but probably some upside to my out of the gate NAV of $33bn
$SATS is up +8% on the news
Circle has 1,200 Employees
Marketcap of $28b
Loses Money and gives 50% of rev to @coinbase
Hyperliquid has 11 Employees
Marketcap of $14b
Is highly profitable with free cashflows of >$1b which are used to buyback $HYPE
EchoStar $SATS still looks cheap to me despite the 20% move yesterday
26.5% upside per DB SOTP
+ every $100bn increase in SpaceX should be worth an incremental ~7.5% (72% upside at $1trn)
+ the ticker is literally $SATS and its the only clean way of getting SpaceX exposure
I absolutely love downside protected investments that have the capacity of going ballistic
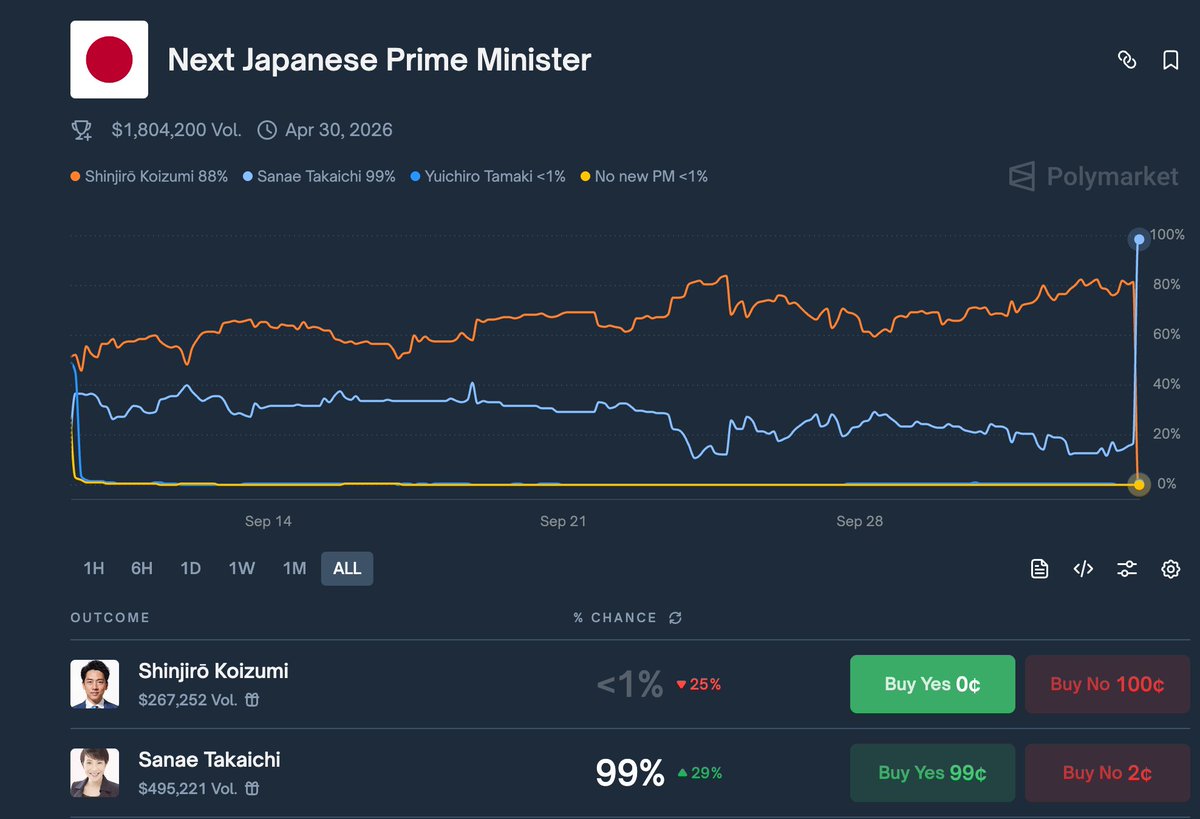
Japanese stocks and the illusive bargain 🇯🇵
Seeing lots of discussion on the TL right now so jolting down a few thoughts to bear in mind when looking through rose-tinted value screens
If you can think like a creditor and assume everyone is trying to screw you (they are) you might just be able to hit a higher hit rate across your basket
1/ Start with the shareholder register
If there is a >30% shareholder then you are probably fighting an uphill battle. Can come in a few different shapes and forms
Keiretsu relationships: these are subsidiaries tied to larger conglomerates (very common in the auto sector). Here assuming the ParentCo actually chooses to unlock value it will do so by working with a third party to do a take-private and dividend-out all that cash pro-forma in a structured deal. This is both tax efficient (avoid hefty cap-gains given long standing ownership) and avoids leaking value to minorities. Read: they want the lowest take-private price possible.
Founder-led business: inheritance tax in japan is prohibitively high (up to 55%) and very strict. For this reason there is actually an incentive to suppress share price. Much better for them to extract value (high salaries etc) out of the business at the expense of minorities.
Cross-shareholdings: can't get anything done in a web of blocking positions
2/ Market saturation
Think about who the marginal buyer is. J-REITs are a good example of this where for a long-time retail was the exit liquidity of choice and supply < demand meant a lot of vehicles were trading at a premium to NAV. Now there is a proliferation of small mid-sized J-REITS, the sector is trading at a discount and many portfolios face capex refurb issues because the sponsor can't do a discounted capital call. Lots of zombie-like structures due to sponsor/ fee arrangements
3/ Industrial heavy names
Sector is rife with captive relationships with high customer concentration and non arms-length arrangements (usually hand-in-hand with the earlier Keiretsu point). Also lots of situations with significant catch-up capex required. That low P/E ratio might not be represantive of true through-the-cycle FCF
4/ FX
Have a view on you time-horizon and the USD JPY curve, can have a significant impact on returns if you are a USD denominated investor
Some more will probably come to mind and will add long the way. Will also write about positive signals and what and set-ups that I like to see and are ripe for actual positive catalysts.
Congrats, you are up 20-50% this year
Things to avoid through EOY:
1. Relative value "catch-up" trade ideas
2. Chasing dopamine through increased sizing
3. Chasing dopamine through reduced time frame
4. Excess portfolio churn to catch the flavour of the day
Thank me later