Portfolio Update – 05/30👇🏻👀
• $NBIS – 17.0% ($27.41)🧑💻// Up 656%🟢
• $AMD – 9.1% ($112.6) 💻// Up 304%🟢
• $RMS – 8.9% (€1,698.06)📺// Down 4%🔴
• $CRWD – 8.6% ($221.27)🔏// Up 210%🟢
• $SHOP – 7.5% ($57.98)📦// Up 105%🟢
• $FICO – 7.4% ($1,021.58)📒// Up 21%🟢
• $NFLX – 5.1% ($17.25)📺// Up 344%🟢
• $PANW – 4.3% ($145.09)🔏// Up 80%🟢
• $DUOL – 4.2% ($168.73) 🧑🎓// Down 35%🔴
• $ENPH – 4.0% ($32.35) 🌞// Up 109%🟢
• $CELH – 3.4% ($21.98)🧃// Up 34% 🟢
• $RDDT – 3.1% ($130.10)💻// Up 37%🟢
• $TMDX – 3.0% ($56.97)💟// Up 4%🟢
• $TTD – 2.5% ($31.31)💻// Down 29%🔴
• $DLO – 2.4% ($10.03)💳// Up 5%🟢
• $INTU – 2.1% ($309.59)💳// Up 7%🟢
• Cash Balance – 7.4%
• YTD Performance: +19.5%🟢
• YTD Nasdaq Comp Performance: +16.1%🟢
• Market Updates:👇
- Iran and the U.S. seemed to near a Temporary Deal on Memorial Day weekend, with many of the key issues unresolved.
- In the U.S, the University of Michigan consumer sentiment index fell to ~44.8, an all-time low, but artificial intelligence related themes (Semiconductors, Cybersecurity etc.) drove stocks to new Highs.
- Indeed major indexes set new highs, though no Iran deal emerged.
- On the week, the Dow industrials rose 0.9%, the S&P 500, 1.4% and the Nasdaq Composite 2.4%.
• Current View on Equity Markets:
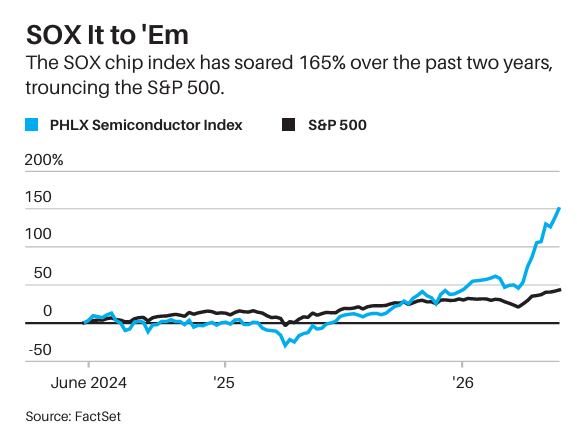
- Chips became the accelerant for the technology and Equity Markets. Supply constraints compounded the excitement.
- The PHLX Semiconductor Sector Index, or $SOXX , rose for 18 straight days, for a gain of ~47%.
- Indeed, the index is up ~80% since March 30, leading to worries about a new dot-com style Bubble.
- For example the Best YTD Performing Stocks today such as $SNDK (+523%), $INTEL (+225%), $STX (+195%), $WDC (+181%), and $MU (+163%) are all Ghosts of Technological Races from the past.
- These five Stocks rocked the 1990s tech boom and crashed the next decade and today they are back.
- History could repeat itself.😳
• Our Strategy over the Next Few Weeks:
- Consequently to this excitement on AI Themes, investors are paying less attention to the Healthcare Sector, which now only accounts for 8.3% of the S&P 500, down from ~14.2% in 2020.
- We recently took some profits on the following stocks $NBIS (concentration risk), $AMD (valuation risk) and $ENPH (cyclicality risk) to raise our Cash Balance, and protect the Portfolio against Downside Risks.
- We would like to continue to selectively lock additional gains over the next few weeks and raise our Cash Balance to 10-15%.
- We would use this Cash Balance to reinvest in Healthcare stocks, which are more defensive by nature.
- We are currently tracking many Healthcare Stocks that could be a great addition to the Portfolio such as: $ISRG, $BSX, $DXCM, and $DHR.
• Next Week:🔍
- $DG and $PANW release earnings on Tuesday, followed by $AVGO and $CRWD on Wednesday.
- The Federal Reserve will release the beige book for the fourth of eight times this year.
- The report gathers anecdotal information on current economic conditions from the 12 regional Federal Reserve banks.
• Additional Details:🔍
- $SHOP (+15%), $CRWD (+10%), and $PANW (+9%) are the best performing Stocks this week.
- $NBIS and $AMD (AI Theme) are so far the best performing stocks in the portfolio (+176% and +140% YTD respectively).
- We believe $INTU and $TMDX are the most attractive Stocks in our portfolio.
How your portfolio is performing?🤔
I would say it depends on your strategy.
But for a short-term focused strategy $50-55 would make sense for $CELH.
Personally I try to Buy businesses that can compound over the long-term, therefore I don't really have specific sell target.
It all depends on if there is something that is changing the Investment Thesis (competition dynamics, management changes, strategy change, market dynamics etc.).
Portfolio Update – 05/30👇🏻👀
• $NBIS – 17.0% ($27.41)🧑💻// Up 656%🟢
• $AMD – 9.1% ($112.6) 💻// Up 304%🟢
• $RMS – 8.9% (€1,698.06)📺// Down 4%🔴
• $CRWD – 8.6% ($221.27)🔏// Up 210%🟢
• $SHOP – 7.5% ($57.98)📦// Up 105%🟢
• $FICO – 7.4% ($1,021.58)📒// Up 21%🟢
• $NFLX – 5.1% ($17.25)📺// Up 344%🟢
• $PANW – 4.3% ($145.09)🔏// Up 80%🟢
• $DUOL – 4.2% ($168.73) 🧑🎓// Down 35%🔴
• $ENPH – 4.0% ($32.35) 🌞// Up 109%🟢
• $CELH – 3.4% ($21.98)🧃// Up 34% 🟢
• $RDDT – 3.1% ($130.10)💻// Up 37%🟢
• $TMDX – 3.0% ($56.97)💟// Up 4%🟢
• $TTD – 2.5% ($31.31)💻// Down 29%🔴
• $DLO – 2.4% ($10.03)💳// Up 5%🟢
• $INTU – 2.1% ($309.59)💳// Up 7%🟢
• Cash Balance – 7.4%
• YTD Performance: +19.5%🟢
• YTD Nasdaq Comp Performance: +16.1%🟢
• Market Updates:👇
- Iran and the U.S. seemed to near a Temporary Deal on Memorial Day weekend, with many of the key issues unresolved.
- In the U.S, the University of Michigan consumer sentiment index fell to ~44.8, an all-time low, but artificial intelligence related themes (Semiconductors, Cybersecurity etc.) drove stocks to new Highs.
- Indeed major indexes set new highs, though no Iran deal emerged.
- On the week, the Dow industrials rose 0.9%, the S&P 500, 1.4% and the Nasdaq Composite 2.4%.
• Current View on Equity Markets:
- Chips became the accelerant for the technology and Equity Markets. Supply constraints compounded the excitement.
- The PHLX Semiconductor Sector Index, or $SOXX , rose for 18 straight days, for a gain of ~47%.
- Indeed, the index is up ~80% since March 30, leading to worries about a new dot-com style Bubble.
- For example the Best YTD Performing Stocks today such as $SNDK (+523%), $INTEL (+225%), $STX (+195%), $WDC (+181%), and $MU (+163%) are all Ghosts of Technological Races from the past.
- These five Stocks rocked the 1990s tech boom and crashed the next decade and today they are back.
- History could repeat itself.😳
• Our Strategy over the Next Few Weeks:
- Consequently to this excitement on AI Themes, investors are paying less attention to the Healthcare Sector, which now only accounts for 8.3% of the S&P 500, down from ~14.2% in 2020.
- We recently took some profits on the following stocks $NBIS (concentration risk), $AMD (valuation risk) and $ENPH (cyclicality risk) to raise our Cash Balance, and protect the Portfolio against Downside Risks.
- We would like to continue to selectively lock additional gains over the next few weeks and raise our Cash Balance to 10-15%.
- We would use this Cash Balance to reinvest in Healthcare stocks, which are more defensive by nature.
- We are currently tracking many Healthcare Stocks that could be a great addition to the Portfolio such as: $ISRG, $BSX, $DXCM, and $DHR.
• Next Week:🔍
- $DG and $PANW release earnings on Tuesday, followed by $AVGO and $CRWD on Wednesday.
- The Federal Reserve will release the beige book for the fourth of eight times this year.
- The report gathers anecdotal information on current economic conditions from the 12 regional Federal Reserve banks.
• Additional Details:🔍
- $SHOP (+15%), $CRWD (+10%), and $PANW (+9%) are the best performing Stocks this week.
- $NBIS and $AMD (AI Theme) are so far the best performing stocks in the portfolio (+176% and +140% YTD respectively).
- We believe $INTU and $TMDX are the most attractive Stocks in our portfolio.
How your portfolio is performing?🤔
Mr. Market is teaching you a lesson on $ADBE and you have to learn from it.
We will never be right on all the bets we make. Everybody makes mistakes and it is fine.
Over the long-term, the key difference between losers and winners is the following:
- Winners are not scare to make mistakes and learn something new from each of them to avoid making them again in the future.
- Losers are scare to make mistakes and refuse to learn the lessons and keep arguing. Probably they will continue to make the same mistakes in the future.
Btw, congrats on $ASML! All the best with your investments.
Yes, it seems like the healthcare/ MedTech segments have suffered a lot over the last few months, as liquidity has been flowing into the AI stocks (semiconductors, energy, cybersecurity etc.). I believe a rerating of the healthcare segment is due over the long-term. The key question is when investors will come back to it. 🤓
$MDT: Medtronic / $ABT: Abbott / $BSX: Boston Scientific
Current Valuation at Historical Low😳
$BSX Fwd EV/EBITDA from June 2016 to June 2026:
- High: 30.36x ;
- Low: 12.00x ;
- Average: 19.96x ;
Today $BSX is trading at 12.0x Fwd EV/EBITDA (see below), which is ~40% below the 10 Year Average.
Historical data points show that the risk-reward is really favourable.
$BSX looks like a clear bargain.
Would you consider Buying $BSX at current level?
🤔
@SixSigmaCapital@oguzerkan $AMD is being valued on future market-share gains.
$NVDA already dominates AI accelerators and data center GPUs. $AMD's valuation reflects the possibility of taking share over the next several years rather than its current earnings power.
@SimeonResearch_@pernasresearch It reminds me the financial fraud related to Wirecard (German FinTech listed on the Dax).
One day they announced EUR1.9bn was missing on the Balance Sheet.😳
$CORT: Corcept Therapeutics
YTD: +100%🟢
Beginning of the year, I suggested $CORT when nobody cared.
Today, the Investment Thesis is playing out exactly as expected (see below). 👇
$CORT Stock is Moving already😳
$CORT stock surged ~15% after the company announced its Phase 3 trial for relacorilant in platinum-resistant ovarian cancer met its overall survival primary endpoint.
The pivotal ROSELLA trial showed patients treated with relacorilant in addition to nab-paclitaxel chemotherapy experienced a 35% reduction in the risk of death compared to those receiving nab-paclitaxel alone. Median overall survival reached 16.0 months for patients on the combination therapy versus 11.9 months for those on nab-paclitaxel monotherapy, representing a 4.1-month improvement.
This success follows the company’s previous announcement that the trial also met its other primary endpoint of improved progression-free survival. Patients receiving the combination therapy showed a ~30% reduction in disease progression risk.
Notably, the drug combination was well-tolerated, with adverse events comparable to those seen in the nab-paclitaxel monotherapy arm, indicating relacorilant provided its benefits without increasing safety concerns.
The U.S. Food and Drug Administration is currently reviewing relacorilant’s New Drug Application with a target action date of July 11, 2026. The European Medicines Agency is also reviewing a Marketing Authorization Application for the treatment.
This is really exciting ! See below our previous post.👇
@StableBread Yes, but investors are only paying attention of next year Financial Expectations. However, $CELH could grow faster over the long-term (5-10 years).
Why $CELH Stock is Significantly Undervalued ?😳
$MNST : Monster Beverage (YTD: 16%)🟢
$CELH : Celsius Holdings Inc (YTD: -14%)🔴
Introduction:
• Both businesses develop, manufacture, sell, and distribute energy drinks in the U.S and internationally.
$CELH has around ~21% market share (No.3 Player in the U.S. Energy Drink Market) and $MNST ~31% market share (No.2 Energy brand behind Red Bull).
• Therefore, these businesses are truly comparable and we can use Trading comps to assess current valuation.
1. Historically $CELH has been Traded at Significant premium to $MNST
• Over the last 5 years $CELH (54.86x EV/EBITDA) Stock has been traded at significant premium to $MNST (23.19x EV/EBITDA), which represents ~137%.
• This premium was making absolute sense considering $CELH grew (~81% CAGR) way faster than
$MNST (~13% CAGR), which is ~5x faster.
• Indeed, $MNST is larger and more mature than $CELH. Its size makes high-percentage growth harder, incremental growth tends to be smaller in percentage terms compared to a smaller company like
$CELH.
2. Today $CELH is trading at Significant discount to $MNST
• Nowadays, investors are ready to pay $CELH at 12.47x EV/EBITDA and $MNST at 27.92x, which represents ~65% discount.
• Indeed, $MNST is one of the largest energy-drink makers globally.
• Larger beverage players often benefit from economies of scale, broader distribution networks, and supplier leverage.
• Its size gives it advantages that $CELH
doesn’t fully have yet.
• Because of this scale, investors believe $MNST has less execution risk than $CELH.
3. This valuation Discount is Abusive
• Next year $CELH (+9.77% ) is expected to grow its revenue at similar pace than $MNST (+8.23%) driven by the expansion of its portfolio, partnership with $PEP, and International expansion and growth beyond the U.S. market.
• $MNST (31.87% EBITDA Margin) is sightly more profitable than $CELH (24.70% EBITDA Margin) due to structural differences in scale, cost structure, product mix, and brand maturity.
• We believe this 65% discount on $CELH is abusive considering its growth and margin profile (similar to $MNST) and the fact that the management team has been excellent at executing its business plan.
4. $CELH is significantly undervalued
• $CELH will certainly not have the same growth rates experienced over the last 5 years, as the business is larger and has ~21% market share.
• Therefore, we should expect $CELH to trade at 137% premium to $MNST in the future.
• We believe execution risks and slight less margin from $CELH are overstated by investors.
• $CELH (12.47x) should trade at least in line with
$MNST (27.92x).
• By considering this assumption $CELH Stock could double over the next few months.
5. The Management Team and Investors are Buying $CELH Stock
• $CELH shares jumped after investors spotted heavy insider buying from CEO John Fieldly and Director Hal Kravitz, signalling strong confidence in the company’s outlook.
• Besides, Traders also piled into call options, adding fuel to the rally as many had viewed the stock as recently oversold.
Disclaimer: We are long $CELH Stock.
@CatherineP86502 Hi Molly, Yes that is true however investors are focused on the long-term and believe the investment thesis is getting more exciting, as $ENPH's new technologies are exposed to Data Centers (dynamic market segment).
$ENPH
This Investment Thesis is aging like a fine wine ! 🍷
Few months ago nobody was paying attention to $ENPH.
Congratulations to the shareholders!
We are long $ENPH.
$ENPH: Enphase Energy (Mkt Cap: $5bn) 🇺🇸
Why we believe $ENPH is one of the most undervalued Stocks in the entire Equity Market? 🧵👇
1. $ENPH is highly Sensitive to Interest Rates %✅
• $ENPH sells solar microinverters, and energy storage systems, often to homeowners and small businesses. These customers usually finance solar and battery systems through debt or leases.
• However, higher interest rates mean higher monthly payments for solar systems, which affect the demand from customers.
• Consequently, $ENPH is highly impacted as customers deter new installations.
• To support this point, we have collected the Federal Funds Effective Rates (%) over the last 10 Years and compared them with $ENPH yearly growth rate from 2015A to 2025 (see chart below).
• As we can see when interest rates % drop (e.g. in 2020), usually $ENPH generates significantly more Sales (+78.5% in 2021).
• Besides, we can clearly see that when FED Rates % are lower than ~3% the business is able to grow substantially (+97.5% in 2019).
@StableBread I agree ! There is a really low free floating (<5%, number of shares available to trade), therefore they are limiting the supply of shares to push price at highest level possible.
The history of the largest U.S. IPOs Suggests that it is not a good idea to Buy Stocks at IPO.🧐
Interesting Data Points (See Table below):
- Excluding $CBRS, the chip maker that completed its IPO a few weeks ago, 36 U.S companies have gone public with a market cap > than $15 bn.
- Only nine have beaten the S&P 500 index’s returns from their first-day closing price. Besides, just ~17 have generated positive returns at all.
- On average, stocks spike on their first trading day but struggle to keep up the momentum overtime.
- $SPCX will be the next name in that data set. At an estimated market cap of $1.8 Tn, the company would trade at 93x Sales.
- In December 2012, $SPCX crossed the $1 bn Equity valuation threshold. From there, it’s up 1,000-fold and no average investor could get in.
Why Stocks are not attractive at IPO ?
- Businesses are going public too late and majority of the upside potential is already gone (the average time between founding and going public for the Mag 7 was 6.4 years vs 24 years for $SPCX).
- Investment Bankers responsible of the IPOs are incentivised to sell the Stock at Highest Equity Value possible to generate more commissions (fees in % of Enterprise value). Consequently, high valuation makes the investment opportunity less compelling.
- Usually the equity valuation is based on an aggressive business plan, which is difficult to achieve.
- It is a great opportunity for Management Teams and Historical Shareholders (who bought way earlier) to dump their shares at attractive level. Therefore, the shares would be under serious selling pressure following the IPO, as these peoples are locking profits.
What are the Best Practices ?
- Wait few quarters/years and let valuation resets before considering adding the stock.
- Let the management revises its Business Plan by presenting more conservative expectations.
- Wait for a moment of panic or significant stress to Buy the stock at discount (e.g. investors had several opportunities to Buy $META Stock at discount following its IPO in May 2012 at $38).
Do you Buy Stocks at IPO?🤔
@FrugalisteFutee Et si tout n'était pas une question de prix ? Mais de dynamique compétitive et de business model? Les prix ne sont que les conséquences et non les causes de ces variations.
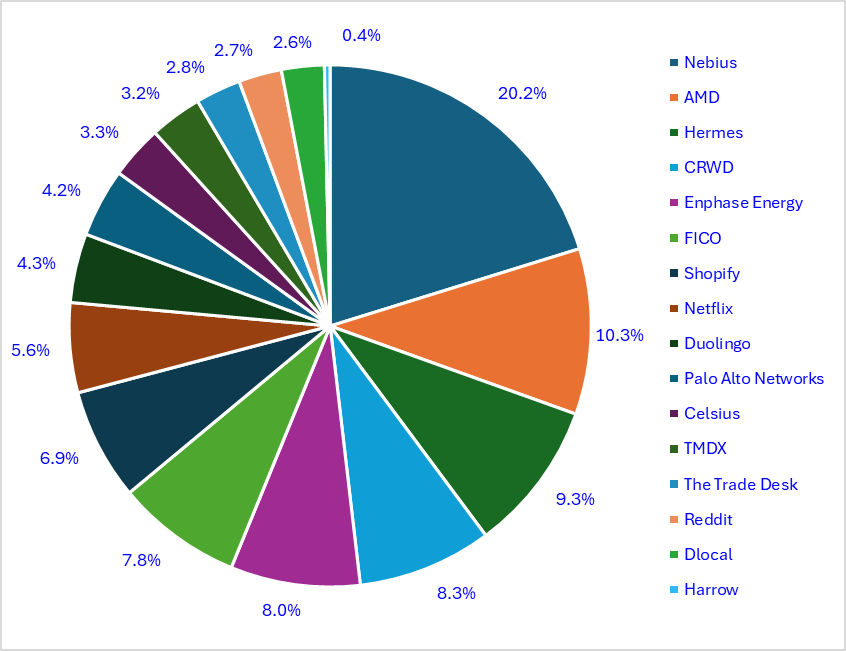
Portfolio Update – 05/23👇🏻👀
• $NBIS – 20.2% ($27.41)🧑💻// Up 606%🟢
• $AMD – 10.3% ($112.6) 💻// Up 268%🟢
• $RMS – 9.3% (€1,698.06)📺// Down 5%🔴
• $CRWD – 8.3% ($221.27)🔏// Up 182%🟢
• $ENPH – 8.0% ($32.35) 🌞// Up 97%🟢
• $FICO – 8.0% ($1,021.58)📒// Up 21%🟢
• $SHOP – 6.9% ($57.98)📦// Up 80%🟢
• $NFLX – 5.6% ($17.25)📺// Up 360%🟢
• $DUOL – 4.3% ($168.73) 🧑🎓// Down 37%🔴
• $PALO – 4.2% ($145.09)🔏// Up 67%🟢
• $CELH – 3.3% ($21.98)🧃// Up 23%🟢
• $TMDX – 3.2% ($56.97)💟// Up 7%🟢
• $TTD – 2.8% ($31.31)💻// Down 26%🔴
• $RDDT – 2.7% ($130.10)💻// Up 11%🟢
• $DLO – 2.6% ($10.03)💳// Up 8%🟢
• $HROW – 0.4% ($30.77)💳// Up 8%🟢
• YTD Performance: +12.7%🟢
• YTD Nasdaq Comp Performance: +13.3%🟢
• Market Updates:👇
- Inflation was back on investors’ minds as the week began, with government bonds selling-off around the world and yields surging.
- Indeed the 30y Treasury yields hit highs not seen since 2007.
- However, the S&P 500 index saw its eighth straight week of gains, and the Dow industrials hit a record high on $2 bn in federal incentives for nine quantum computing companies.
- On the week, the Dow was up 2.1%, the S&P 0.9%, and the Nasdaq Composite 0.5%.
• Complete Divergence between Equity and Bond Markets:📈
- Equity markets are pricing strong earnings acceleration, from AI, cloud and semiconductors.
- According to investors AI should drive productivity gains from automation boosting future margins and cash flows.
- Consequently central banks will ease monetary policy without causing a deep recession (soft landing).
- On the other side, Bond markets are pricing higher for longer interest rates due to sticky inflation.
- Besides, large fiscal deficits and heavy government debt issuance pushing yields structurally higher.
- Consequently real interest rates may remain permanently above the ultra low post 2008 era.
- Historically, Bond Markets have usually been better at spotting macroeconomic turning points but are often too early.
• Next Week:🔍
- $A, $HPQ, $MRVL, and $CRM report quarterly results on Wednesday, followed by $COST and $DELL on Thursday.
- The Bureau of Economic Analysis will release the personal consumption expenditures price index for April. Economists forecast a 3.8% y-oy increase, three-tenths of a percentage point more than in March.
• Additional Details:🔍
- $ENPH (+24%), $CRWD (+12%), and $DUOL (+9%) are the best performing Stocks this week.
- $NBIS continues to be so far the best performing stock in the portfolio (+156% YTD).
- We believe $HROW and $TMDX are the most attractive Stocks in our portfolio at current level considering the risk-reward potential.
How your portfolio is performing?🤔