Feb 27 Bitcoin update 🇺🇸
Failure to reclaim 68k, combined with a loss of 65.5k, increases the odds of a grind down toward 62.5k, which our own structure identifies as the major floor.
Price action and tape
Bitcoin is camped in the mid 66k area after failing to hold the 68k to 70k push and rolling back toward 66k. The immediate read from our charts is simple: we are still inside a broad compression box with a lot of two-way inventory, and every attempt to trend has been getting faded quickly. Our one-hour chart shows a sharp downdraft into 66k with the short moving average still above spot, which usually means bounces can be capped until price reclaims that average and holds it. Our four-hour chart still looks like a larger downtrend from the prior cycle peak, with price stabilizing but not yet proving a real trend reversal.
Volatility and range expectations
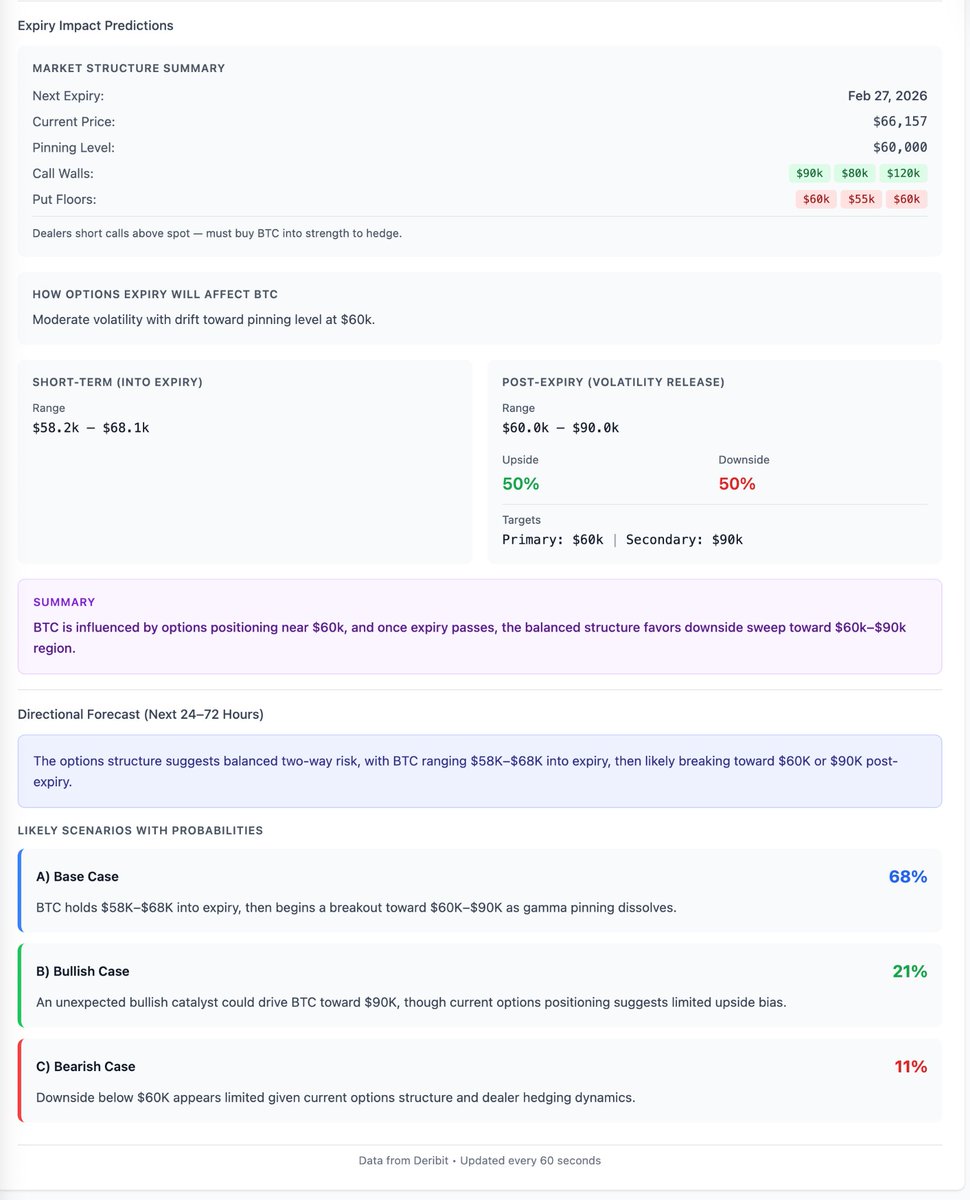
Realized movement has cooled versus the recent swing highs, but implied and positioning say volatility risk is still present. Our expiry module is calling moderate volatility with a drift toward the pinning level at 60k, with a near-term into expiry range of roughly 58.2k to 68.1k and a wider post-expiry range of 60k to 90k. That framing matches the broader picture: tight chop near 66k to 68k can quickly expand once the expiry-related pinning pressure relaxes.
Technicals across timeframes
Momentum and trend strength
ADX is not screaming trend right now on the very short end, but it is elevated on higher timeframes. Our daily ADX is high, which is consistent with a market that has been trending on the macro window, even if the intraday looks choppy. Directional components lean slightly negative on the shorter timeframes, with negative DI above positive DI in several rows, which fits the current pullback. Translation: the bigger picture still carries trend energy, but the near-term push is pointed down unless price reclaims key levels.
Mean reversion and where the price sits in its bands
Bollinger positioning shows price hugging the lower side on the fastest windows, while the one-hour reads as pressed and vulnerable. When we see percent B near the bottom and the distance to the lower band tight, that is where bounces can start, but we need confirmation because strong down moves can walk the band. On the daily window, price is still below the mid band and below many longer averages, which keeps the macro tone cautious.
Moving averages and slope
On the micro windows, price is slightly below the fast averages, with negative distance to EMA12 and EMA26. That is consistent with a short-term bearish bias. The daily picture is still the heavier weight: price is far below the longer averages, so even if we get a relief rally, it can still be a countertrend rally until we reclaim and hold higher time frame levels.
Ichimoku state
Ichimoku is flashing bearish break conditions on most timeframes in our table, and trend reads negative on higher windows. Thin cloud on the very short end can mean a quick flip is possible, but until we see confirmation and price building above cloud structure, rallies are more likely to be sold into than to run cleanly.
Oscillators
RSI is mid-range overall, with the live around the mid-40s, not deeply oversold, but our fifteen-minute and one-hour show weaker momentum and oversold flags on parts of the stochastic complex. That combination often produces choppy bounces that struggle to follow through without a catalyst, especially when higher timeframes remain heavy.
MACD and divergences
MACD signals are mixed: short windows show some rebound attempts while the larger windows remain conflicted. We also have a bearish divergence flag on the four-hour in our market structure block, which is an important caution light. Divergences do not time the turn, but they do tell us rallies can fail if buyers do not step in with real follow-through.
VWAP positioning
Spot is below VWAP on our live read with a meaningful negative distance, which is consistent with current risk-off pressure. We do have anchored VWAPs very close to the current price on the one-hour and four-hour anchors, which makes those anchors good real-time inflection checks. If the price cannot reclaim those anchored levels, bounces can get sold quickly.
Key levels from our support resistance block and pivots
Nearest support is the upper 65.7k to 66.0k pocket with a more obvious line in the sand at the mid 65k zone. Our rolling minima on bigger windows point to 62.5k as the major structural floor that matters for the whole range regime. On the upside, the first ceiling is the 66.17k area, then the 68.16k to 68.23k area, then the big one at 70k. If we reclaim 70k and hold, we open the door to the low to mid 70k region as the next magnet.
Derivatives and positioning
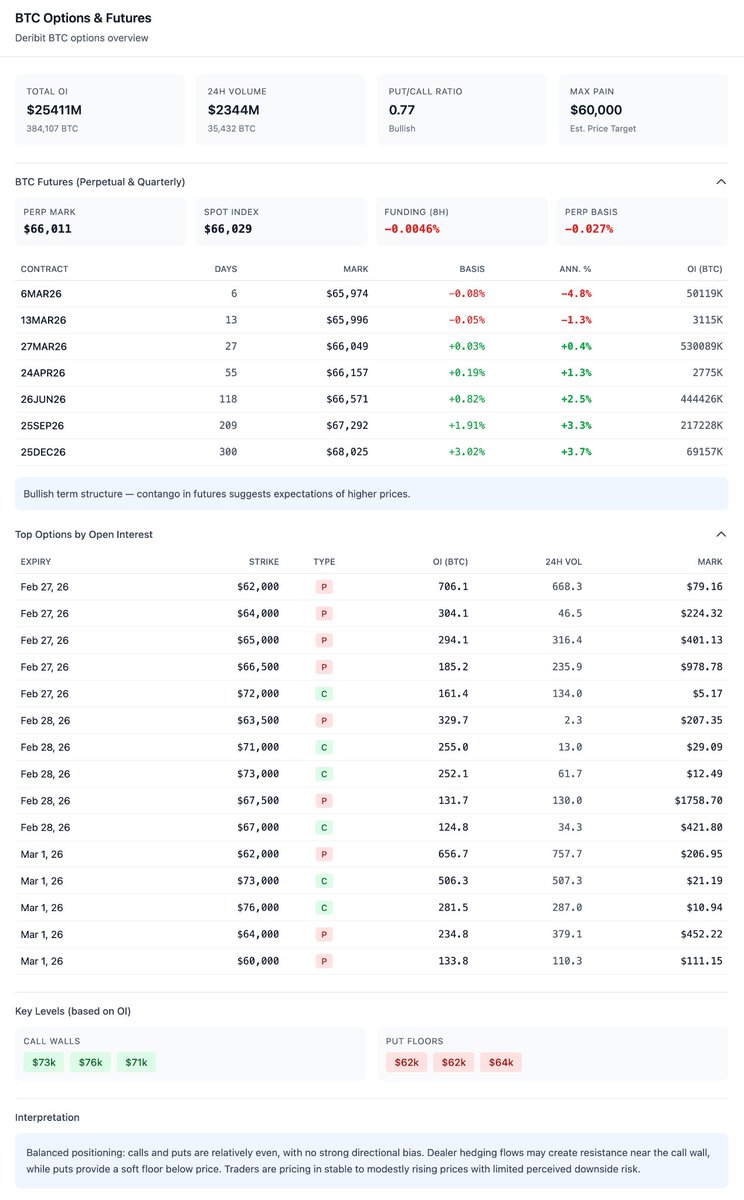
Deribit options overview is telling us the market is not panic hedging right now, it is cautious and balanced. Total open interest is huge, put call ratio is around 0.77, which is modestly bullish, and the max pain estimate on our panel is 60k, which means there is a strong gravitational narrative around 60k into settlement. The important nuance is that max pain is not a target; it is a positioning snapshot. It tends to matter most when the spot is close enough for hedging flows to influence the tape. Right now, the price is above it, so the risk is more about whether the market drifts lower into that magnet as expiry approaches.
Futures term structure
Perp is near 66k with spot about the same, funding is slightly negative, and perp basis is slightly negative. That setup is typical of a market that is not euphoric and is leaning defensive. Yet further dated futures show contango on the longer contracts, which is why our dashboard calls the term structure bullish. Translation: traders are paying up slightly for time on the back end, but are not paying up for leverage right now. That is often what a base building environment looks like: longer-term expectations are higher, and near-term leverage is being reduced.
Options walls and floors
Our key level block shows call walls stacked above in the low 70s on the first panel, and our expiry impact panel shows larger call walls way higher at 80k, 90k, 120k, while put floors cluster at 60k and 55k. This is a classic compression map: downside is being insured and defended in the high 50s to low 60s area, while upside is capped until we clear near-term resistance. It supports the idea of a range with occasional violent wicks as dealers rebalance.
Expiry impact model
Our expiry module is very explicit: moderate volatility and drift toward 60k. It also says dealers are short calls above spot, so in strength, they may need to buy BTC to hedge, which can accelerate upside once we break the correct level. That creates a very specific condition: if spot can reclaim and hold above the heavy resistance band, upside can feed itself through hedging. If the spot stays below resistance, gravity and pinning effects can keep pulling us toward the lower part of the range.
Flow and macro dashboards we attached
US Session Playbook
Premarket is tagged neutral with low confidence, and the broader session is neutral but risk off. Position size suggested is small. The important qualitative flag is miner stres,s and the note about declining reserves with elevated exchange selling. That aligns with the broader regime flags in our macro regime block: distribution regime, macro risk off, miner reserve drawdown extreme.
ETF Alpha Engine
Flow probability is basically a coin flip around the high 40s, directional bias is neutral, liquidity stress is low, and suggested position sizing is under half of base. Under the hood, we have exchange flows net negative, which is supportive, but the ETF premium is deeply negative, and the CME basis is slightly negative, which is consistent with muted risk appetite. Miner flows show BTC moving to exchanges, which can be a source of supply. Net read: flows are not screaming bullish or bearish, they are saying stay nimble and do not oversize.
Pump dump predictor
Tomorrow is flagged neutral with pump probability mid-40s, dump probability low-20s, and confidence very low. That matches everything else: the market is in balance, and any directional claim should be treated as a scenario, not a forecast.
Microstructure snapshot
We have taken to buy dominance on the shortest window and a positive order book imbalance, but our CVD delta is negative, and trade aggression reads negative. That is consistent with a choppy tape where bursts of buying appear, but the net flow is still being absorbed and sold. In this environment, the clean signals come from level breaks and retests, not from assuming every microburst will trend.
Macro and news themes from the feed we provided
Institutional rails and custody
Multiple stories hit about major banks expanding into BTC custody and trading rails, including Morgan Stanley and Citi building infrastructure with rollout plans in 2026. That is structurally bullish long term because it broadens access and normalizes BTC as an allocatable asset inside traditional portfolios.
ETF flows and demand
The feed shows renewed spot ETF inflows over recent days, with several notes of hundreds of millions in net inflows led by the largest products. That helps explain why downside has been contained despite heavy sentiment and why bounces keep showing up near the lower end of the range.
Options expiry and hedging behavior
We also have repeated references to a large options expiry and heavy put positioning around 60k. That is consistent with our Deribit snapshot and with the idea that big players are insuring the tail rather than betting aggressively on upside right now. It is cautious, not euphoric.
Miner stress and supply dynamics
Several headlines point to miner profitability pressure and reserve drawdowns, plus some miners moving toward AI and HPC diversification. Miner stress can matter because it changes the marginal seller. When reserves draw down and coins move to exchanges, supply can cap rallies. On the flip side, if the market absorbs that supply while ETF and institutional demand return, the eventual move can be sharp.
Sentiment regime
Extreme Fear readings and bearish commentary are prominent in our feed. That is not automatically bullish, but when the price stops making new lows while fear is elevated, it often precedes a base. Our on-chain snippets mentioned supply in loss elevated and NUPL modestly positive, which sounds like a market that is hurting but not fully capitulating.
Regulation and policy
We have mixed items: proposals to restrict bitcoin ATMs in a US state, and broader moves toward regulatory clarity and pro-developer bills. In aggregate, the regulatory tape looks noisy but is slowly institutionalizing, which tends to help long-term adoption and liquidity even if individual headlines are negative.
Geopolitical tail risk
One item mentioned the risk of conflict affecting mining activity in Iran and hashrate. Whether or not that specific scenario materializes, it reminds us that the market is not pricing every tail. Hashrate shocks can cause volatility spikes, mostly through narrative and risk premia, even when protocol security remains robust.
Scenarios from here using our levels and positioning
Base case, still the highest probability per our model
Bitcoin continues to chop inside the 60k to 70k box, with 66k acting as the near-term pivot. Into expiry, pinning pressure and hedging flows bias price toward the lower half of the range, with 65.5k to 66k needing to hold to prevent a slide toward the low 60s. After expiry, volatility expands, but direction depends on whether the price can reclaim 68.2k and then 70k on a closing basis.
Bull case, what needs to happen
We reclaim 68.2k, then break and hold 70k. If that happens, dealer hedging dynamics can flip from dampening to amplifying, and the market can squeeze toward the low to mid 70s quickly. In that outcome, negative or flat funding becomes fuel because positioning is not crowded long. The next milestones would be a clean hold above 70k, then acceptance above 72k. If accepted, the 75k region becomes the next magnet, and the higher call wall zones on our sheet become relevant later.
Bear case, what breaks it
Failure to reclaim 68k combined with a loss of 65.5k increases the odds of a grind down toward 62.5k, which our own structure identifies as the major floor. If 62.5k fails, the market likely targets the high 50s and then the 55k area where put floors are stacked. In that scenario, the 60k max pain and the heavy put interest turn from an abstract magnet into a lived battlefield where hedges get monetized and spot can accelerate lower before finding real support.
How would we summarize the whole setup today?
Spot is sitting at a decision point inside a bigger bear phase on the macro chart, but with early signs of basing behavior because leverage is not overheated, and longer-dated futures are still priced at higher levels. Options positioning is balanced with a modestly bullish put-call ratio but strong gravity around 60k into expiry. Flows are mixed to neutral: ETFs and institutional narratives support the longer term, while miner stress and macro risk-off messaging keep the near term cautious. Technically, the immediate path of least resistance stays down until 68k is reclaimed, but the market is close enough to key levels that a single strong push can flip the tape quickly.
Not financial advice.
#CryptoMarkets #BTCUSD #BITCON
@Matt_Hougan I’m trying to get my head around this:
If Jane Street were systematically suppressing BTC every day…
Why wouldn’t:
Citadel, Virtu, Goldman, Jump, DRW, Cumberland
front-run it?
Markets aren’t charity. They’re predator vs predator.
Sustained edge gets hunted.
$BTC into the US 🇺🇸 session: our models, on-chain, derivatives, and macro all say the same thing. This is a liquidity hunt phase, not a clean trend phase.
👇🏻👇🏻
Our system shows a bullish tilt (~73% pump bias), but confidence is extremely low (~17%), which keeps the daily regime Neutral. That means smaller sizing, breakout trading OFF, and mean-reversion favored both directions. In plain English: the market isn’t ready to trend yet. It’s still positioning.
On-chain signals back this up. Miner flows and supply metrics are mixed, not screaming distribution but also not confirming broad accumulation. Liquidity is rotating, not expanding. This is exactly the type of environment where price chops, hunts stops, and frustrates momentum traders before deciding direction.
Derivatives positioning tells a similar story. There’s a soft support pocket in the mid-60k region and heavy resistance stacked into the high-60s/low-70s. Expiry gravity still sits higher, meaning the bigger structural bias isn’t bearish, but that magnet usually works on a slower timeframe. Today’s moves are more likely to be driven by liquidity sweeps and equities than by options mechanics alone.
Technically, we’re in classic post-flush structure: higher timeframe momentum isn’t confirmed, volatility is elevated, and breakout filters aren’t validating. Historically this is the zone where range trades outperform and breakout chasing underperforms. These are the days where price moves just enough to bait traders into thinking a trend started, then reverses.
Macro backdrop is amplifying that behavior. Tariff escalation headlines, geopolitical tension, fiscal uncertainty, and mixed corporate crypto flows are keeping the entire risk complex sensitive to news. When BTC trades inside a macro-sensitive window like this, it usually behaves less like a pure crypto asset and more like a high-beta liquidity instrument reacting to broader market tone.
Put all of that together and the most probable script for today is:
early stop-runs both directions, mid-session stabilization, and real direction only after equities establish tone.
This isn’t a conviction day. It’s a positioning day.
Trade smaller, fade extremes, and wait for the market to show its hand instead of guessing it.
#Bitcoin #BTC #Crypto #CryptoMarket #CryptoTrading #CryptoNews
Not financial advice. Do your own research.
🔥 LIVE NOW: The FIRST Crypto AI TV
24/7 AI-driven market breakdown
Real-time technical analysis
Momentum, structure, volatility & sentiment
Non-stop crypto news
Built for traders
#BTCUSD#CryptoMarket#AITrading#AlgoTrading#CryptoSignals#FinTech#Web3 https://t.co/rgNVBhkcqA
🚨 U.S. Jobs Report Just Released:
Unemployment: 4.3%
Payrolls: +130K
Wages: +0.4% MoM
2025 payrolls massively revised LOWER
Headline looks firm… but benchmark revisions show the labor market was much weaker than thought.
That keeps medium-term rate-cut odds alive.
⚖️ Short-term volatility, but structurally supportive for liquidity.
📈 Bitcoin likely benefits after initial reaction.
#Bitcoin #BTC #Crypto #JobsReport #Macro #Markets
🚨 Market Desk goes LIVE in 3 minutes.
Bitcoin sitting at a critical level.
Flows shifting.
Volatility compressing.
Join live 👇
#Bitcoin#BTC#Crypto#MarketDesk#AITrading https://t.co/vhP4Wzauvy
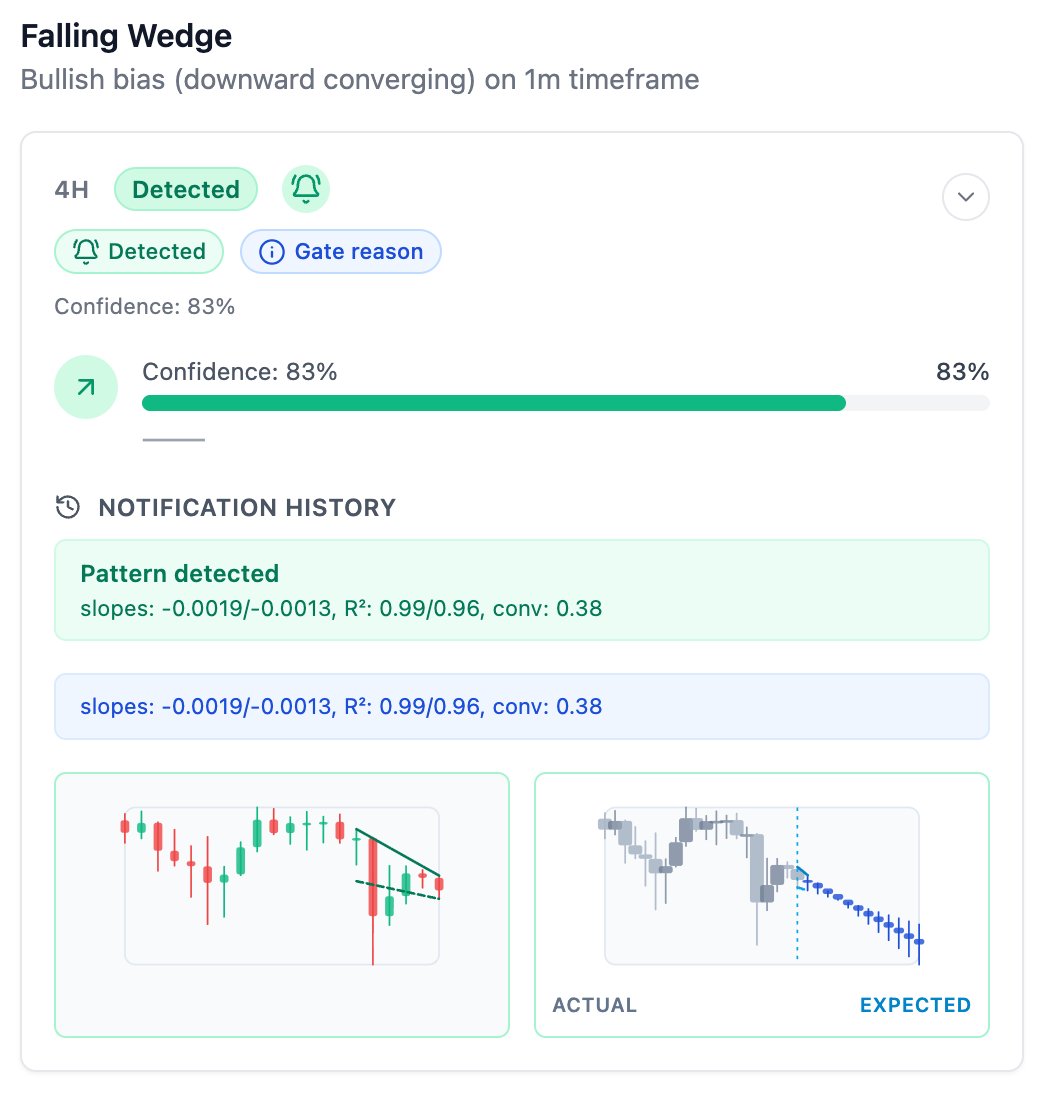
4H Falling Wedge detected on #Bitcoin
Confidence: 83%
Price: $75,670
Compression + downward convergence → potential bullish breakout setup.
Now we see if the structure confirms.
NFA. DYOR.
From $126k to $74k, Bitcoin went through a brutal drawdown.
Now it sits in no man’s land, and anyone claiming certainty about “what’s next” is lying to themselves.
What is clear:
Bitcoin is not a low-volatility asset, and it never was.
If you expect stability, you’re in the wrong market.
The real problem isn’t price. It’s expectations.
Too many people want to get rich fast.
That mindset almost always ends the same way.
If you can’t emotionally tolerate violent swings, up and down, you can’t handle this heat. And that’s okay. Not everyone is built for it.
Zoom out, and you’ll see something bigger unfolding:
Old money vs new money.
Banks vs crypto-native systems.
Centralized control vs sovereign ownership.
Legacy power vs emerging networks.
This isn’t a short-term trade war. It’s a generational shift.
If you’re in crypto, do it for your kin, not your ego.
Not for the “one big payday.”
That payday rarely comes the way people imagine.
Think in decades, not months.
10 years. 20 years.
Hold it, forget it, live your life.
No asset is worth sacrificing your health over, especially when the macro forces driving it are far beyond your control.
Conviction should bring peace, not stress. I am holding!.
#Hodl #Macro #BTC #WealthCreation
@DrProfitCrypto Weekly MAs confirm what already happened. This move smells like leverage flushed, liquidity thin, not final distribution yet. $75k decides if this is a repair or a true bear continuation. We will see...
Structural Fear.
Not panic.
Not emotions.
This is fear driven by liquidity, macro, and positioning.
Leverage flushed.
Spot holding.
Conviction missing.
Markets aren’t reacting; they’re waiting.
That’s where regime shifts start.
#GOLD#Silver#CryptoMarket#Bitcoin
#Bitcoin Feb 1 - 🇺🇸 (Turmoil Tape)
$BTC just printed ~$76.3k after a brutal leverage flush. This isn’t “one headline”, it’s macro stress + narrative shock + thin liquidity all hitting at once.
What’s driving the fear
- Macro risk-off / rotation into metals (then metals whipsawed too)
- Regulatory heat + Binance / Changpeng Zhao (CZ) accusation noise = confidence bleed
- Liquidity is still fragile → cascades travel farther than they should
Derivatives / Options snapshot (Deribit)
- Put/Call 0.78 (still “bullish” on paper)
- Max pain: $90k → big magnet later, not a promise now
- Perp funding ~flat + term structure still contango → market is hedged, not euphoric
- Nearest walls/floors: Calls $85–88k, Puts $78–82k / $80k (real battle zones)
My map (next 24–72h)
$75k = trap door / last line before deeper liquidation air pocket
$78–80k = reclaim zone (needs spot to confirm, not just perps)
$82–84k = first “prove it” ceiling
$87–88k = dealer gravity/resistance cluster
$90k = pin/magnet if stabilization holds
Scenarios
Base: chop + wicks $75–80k (Structural Fear → Stabilization)
Bull: hold $75k, reclaim $80k, squeeze to $84k+
Bear: lose $75k → fast sweep lower before any real bid shows up
Question for the timeline:
Are you watching $75k as the capitulation floor… or do you think this needs one more flush to reset leverage?
#Bitcoin 2-Day Catch-Up (Jan 29–30) 🇺🇸
Missed yesterday (client travel), so here’s the clean combined read.
What changed since Jan 28:
We got the liquidity flush everyone was leaning on: leverage got wrecked, spot didn’t “die,” and now we’re back in the dealer/expiry gravity field.
1) Tape / Structure (now)
BTC is sitting in repair mode after the sweep into low-$80Ks.
This is still derivatives + options-led: quick pops, quick fades — until a reclaim actually sticks.
Immediate battlefield:
- $85k–86k: first “get-back-in-range” zone
- $87k: first real supply/options friction
- $90k: control line into expiry gravity
- $80k–82k: the floor everyone is staring at (break = air pocket)
2) Options (Deribit snapshot)
- Put/Call ≈ 0.76 (mildly bullish positioning)
- Max pain ≈ $90k (gravity level, not a promise)
- Key OI levels: call interest clustered around $85k / $87k / $91k, puts heavy at $80k / $82k
Translation: range + pin attempts into expiry, then volatility releases once gamma hedging relaxes.
3) Futures / Funding
- Funding slightly positive (not panic-short; still some long-lean)
- Contango on dated futures = market pricing “higher later,” but near-term is still flow-driven.
4) News/Macro tug-of-war (last 48h)
Pressure: ETF outflow + macro hawkish vibes + risk-off tape = why dips accelerated.
Supportive undercurrent: more “BTC as reserve asset” narratives (large players increasing BTC exposure) + “rotation” chatter after metals volatility.
Net: headline flow is mixed, but price is still trading liquidity first.
5) Levels that matter (next 24–72h)
Support (must defend):
- $83k → $82k: first line
- $81k: recent flush low zone
- $80k / $80.6k: trap door (lose it and $78k–$75k becomes visible fast)
Resistance (reclaim ladder):
- $85k–86k: re-entry into structure
- $87k: first real “prove it”
- $90k: control line / pin magnet
- $91k–92k: call-wall area (expect defense + wicks)
6) Scenarios
Base: Chop/repair between $82k–$87k, expiry pins tugging toward $90k, then expansion post-expiry.
Bull: Reclaim $87k, then a clean push toward $90k–$92k (shorts start feeling it).
Bear: Lose $80k–$80.6k → fast sweep toward $78k–$75k.
Bottom line:
We likely finished the liquidation chapter, but conviction isn’t confirmed yet. Options say pin + chop first, then real move after.
Trade levels, not narratives. NFA / DYOR.
This is why we post scenarios, not predictions.
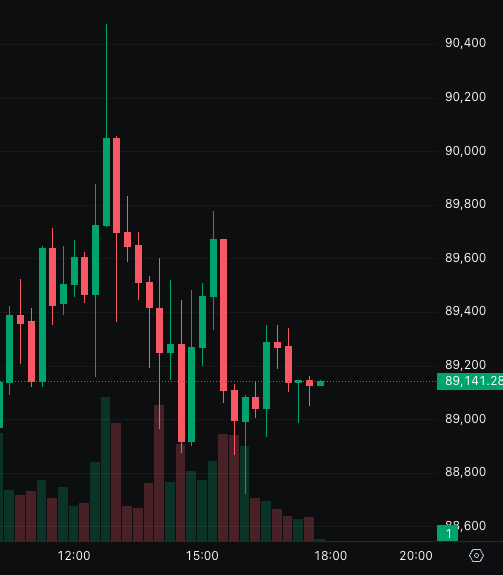
Base case: chop $88.5k–$90.8k → wicks → wait for expansion.
That’s exactly what price is doing.
The goal isn’t to be right; it’s not to be surprised.
#Bitcoin#BTC#MarketStructure
The volatility comes after the contracts are gone.
A lot of traders hear about options expiry but don’t really understand what it means in practice.
So let’s break it down 👇
It’s human behavior + risk management.
Think insurance + inventory management.
Here’s the real-world version 👇
Imagine a car dealer sold thousands of price-locked promises:
“I promise to sell you a car for $92,000 if you want it.”
Those promises are call options.
The dealer sold them. The dealer is now exposed.
As the car price rises toward $92k:
• The dealer gets nervous
• More customers may exercise
• The dealer starts buying cars early to prepare
That buying slowly pushes the price up.
Now the key part 👇
When price reaches $92k, the dealer is fully stocked.
At that point, they don’t want price to go higher.
Why?
Because above $92k:
• Every $1 higher costs the dealer real money
• Risk grows exponentially
So what do they do?
They discount inventory.
They sell aggressively at $92k to keep price from running.
That’s a call wall.
Back to #Bitcoin.
When $BTC approaches a major call wall:
• Dealers have already hedged
• New buyers hit heavy supply
• Rallies stall or fade
• Price chops instead of trends
That’s why BTC can feel “stuck” near certain levels.
Now the twist 👇
If buyers keep coming anyway:
• Dealers run out of inventory
• They’re forced to buy higher
• Hedging flips from selling → buying
• Price accelerates fast
That’s a breakout.
So remember:
• Below the wall → selling pressure
• Through and accepted → fuel
This is why BTC can:
• Hold $90k
• Reject $92k
• And still be bullish long-term
Nothing is broken.
The market is just managing risk.
Call walls don’t predict price.
They explain why price behaves the way it does.
Once you see it, you can’t unsee it.
Not financial advice.