For a second consecutive quarter, hyperscaler stocks reacted abnormally negatively to earnings season. Two main issues are plaguing the group and will need to resolve to enable better performance:
First, ROIC prospects are diminishing while WACC is rising, resulting in an overall reassessment of what the market is willing to pay for these stocks. Recall, hyperscalers historically commanded a premium relative to the market, but that premium is eroding, reflecting business models that are becoming more asset-heavy. Notably, only a few names currently have valuations lower than they were at the start of the year. We wrote about this in the spring, and continue to see the spread between ROIC and WACC as a critical signal to watch.
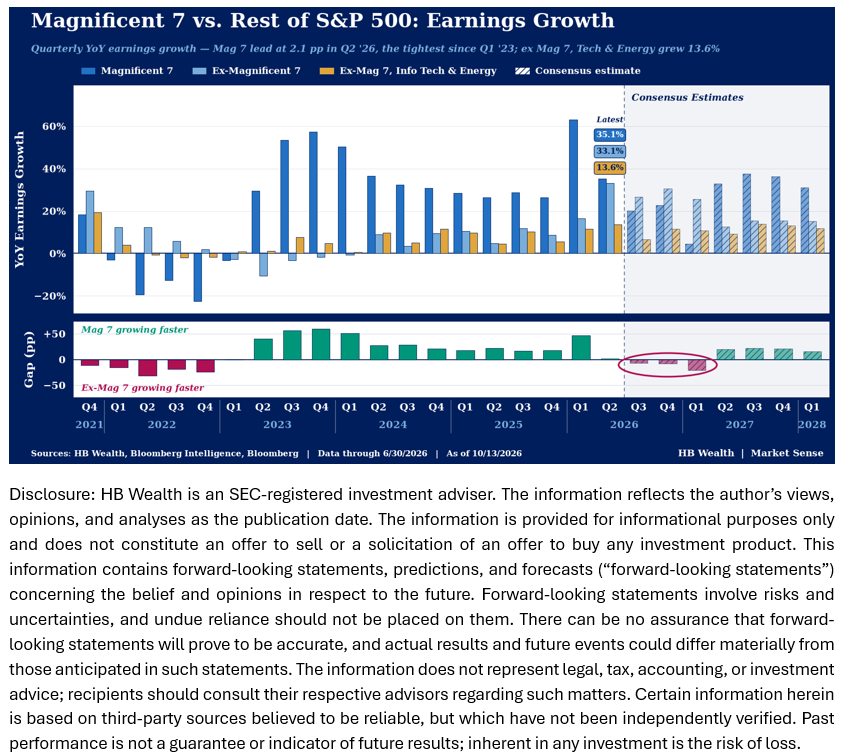
Second, earnings momentum is working against the Mag-7 at large, a group dominated by the hyperscalers. Mag-7 earnings growth peaked in 1Q and has been decelerating since then. This deceleration in earnings growth naturally leads to more volatility in stock prices, particularly when core businesses show weaker than expected trends, as was the case with Amazon and Alphabet. Mag-7's growth may continue to decelerate until it bottoms in 1Q earnings season next year. We wrote about this in our preview for earnings season.
If you would like to see more of the Market Sense research, please feel free to visit us and sign up to subscribe at https://t.co/ElbXTsEpYh!
@EricBalchunas It was, at least by Russell's definition until June. They really top ticked inclusion and it's part of the reason growth has been hurting.
Wrote this a few months back: https://t.co/lOSSWIxCx2
Is there a bull case for small caps? Chief Market Strategist @GinaMartinAdams joins host @DianeKingHall on Schwab Network Morning Movers to discuss the opportunities as large caps show signs of lagging: https://t.co/EhUcABH837
CCC rated credit spreads have surged to 1,127 basis points – a level currently wider than 5 out of every 6 days since 1996. This is well beyond the long-term average spread, and a level that has historically only been reached during periods of significant strain for the financial markets. In every other instance in which the CCC spread widened beyond long-term average over the last twenty years, the S&P 500 was nearing or already in the midst of a correction. Yet, the widening in CCC spreads has occurred without a major risk off event emerging in stocks – an extremely rare event. This begs the question, is the bond market signaling more significant distress ahead?
While the historical track record is ominous, the spread within high yield offers a good reason not to panic. The ratio between CCC spreads and those for the rest of the high yield market is at a new record high as the rest of the high yield market has barely budged. A combination of selection and weight explains why the broader High Yield index’s spread remains tight (merely at its 16th percentile) even as CCC is pricing substantially more risk than others at its 83rd percentile spread - BB is at its 11th percentile and is more than half of the index while that lower quality tier is just 8% of the index.
What's driving the correction in the Russell 2000? It's all about 10-year yields!
No sector, style or factor rose with beta and leverage falling most as they did in '22. However, some profitable stocks got thrown out with the rest.
https://t.co/prnz4Uujln
@GinaMartinAdams
Rates, fuel prices and AI. Oh my!
It’s been a while since stocks faced so many glaring risks heading into earnings season and yet, consensus expects the S&P 500 to put up nearly 25% EPS. However, ex-tech & energy, just 5.3% growth is expected in 3Q.
https://t.co/hGziFIK47J
Rising fuel costs are likely to pester earnings growth results for segments of the S&P 500 even if earnings for the index at large are relatively unaffected.
Higher fuel prices have so far had no impact on S&P 500 headline earnings growth expectations, but they are starting to eat away at S&P 500 consensus estimates beneath the headline, with consumer staples, discretionary and parts of industrials at the epicenter of cuts. As of now, the sellside sees this as just a short-term disruption, but that assumption is heavily reliant on a speedy resolution to the war in Iran. When diesel prices spiked roughly 63% in the first half of 2022, the discretionary and staples sectors’ 2H22 earnings estimates dropped an average 1,976 bps and 443 bps. Fuel costs have jumped more this time – up 86%+ from 2026’s low - suggesting significant downside revision risk is possible as 2H26 estimates are off only 662 bps and 506 bps since the start of the year.
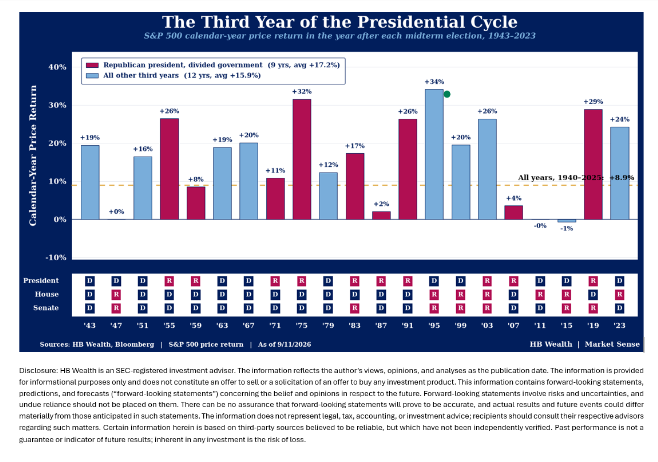
Polymarket odds show >50% chance of a Democratic sweep in Congress in the midterms. Will it matter for markets?
History says stocks love the third year of the Presidential cycle, and a divided government doesn't change that. Since 1940, the average market return in the third year of the election cycle has been 16.5%. Under Republican Presidents, the average is 18.2%. Republican Presidents with a Mixed Congress (2 instances) presided over an average 23.1% return in the year after midterms, while Republican Presidents with a Democratic Congress (7 instances) saw a 15.6% market return.
The election is only likely to pressure stocks if it also results in or coincides with a material change to the outlook for the foundation of stock prices’ gains - earnings and economic conditions.
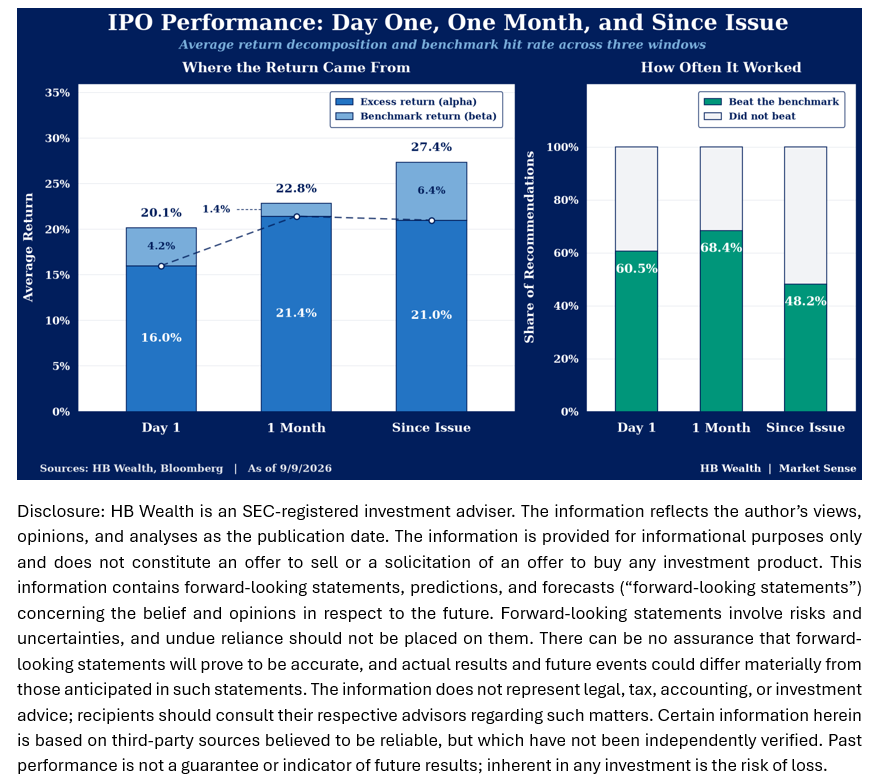
IPOs offer yet another signal that risk appetites remain subdued compared to the '99-'00 bubble. This year's US IPOs are up an average 20.1% in the first day of trading, slightly above the long term norm of 18.9% but well short of the 64.6% in the lead up to the dot-com bubble.
HB Wealth’s Michael Casper was featured in Kiplinger discussing how the stronger-than-expected August jobs report could affect expectations for a September rate hike—and what it may mean for different areas of the equity market: https://t.co/4C4UG0nnOV
· Contrary to popular belief, evidence from large investment cycles of the last 150 years shows there is no consistent “playbook” for how an investment boom emerges and fades in stock prices.
· The telecom and fiber boom of the 1990s sparked a rapid acceleration and subsequent decline in prices, while the highway and railroad booms started more slowly, and gathered stock price momentum after several years.
· Electrification was the only investment boom that led to lower real stock prices 10 years after its start. Despite the volatility in stock prices affiliated with the telecom build-out, the S&P 500 was up 62% in real terms 10 years after its start. Highway and railroad builds accompanied 78% and 85% gains, respectively, over 10 years.
· Earnings growth in the AI-investment era is strongest among peer comparisons of the last 150 years. Just over 3 years into the AI build, earnings are up 33%. The 40 months of the telecom-fiber era showed earnings growth of 10% and for the comparable period in the railroad era, earnings rose 19%.
· Thus, the gap between price and earnings growth in the first forty months of the AI Buildout is about 20 points, significantly lower than 92-point gap that developed by this stage of the telecom build and the 38-point gap that developed in the highway build.
· The 20% valuation gain affiliated with the AI boom is still very limited by comparison to past booms. On average, P/E had accelerated 55% from its trough by the time stock prices peaked in the other major investment periods of the last 150 years.
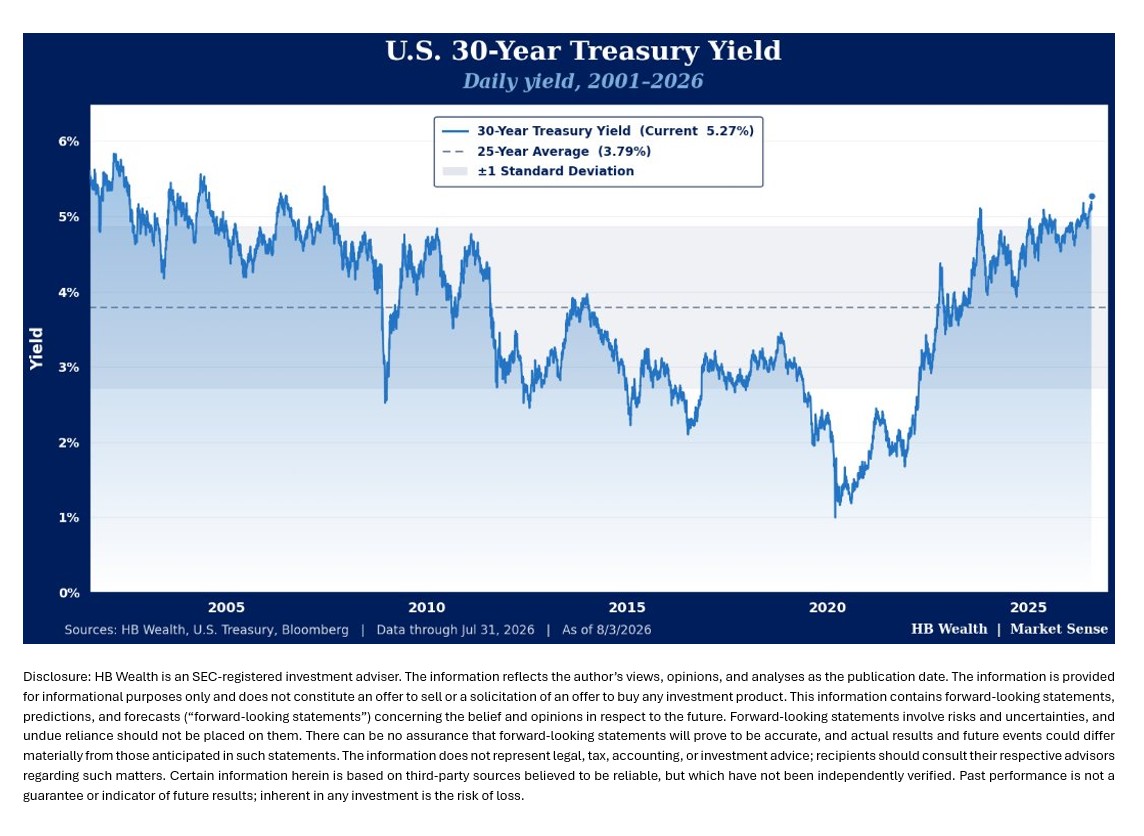
U.S. Treasury auctions this week showed appetite for U.S. debt continues to wane - the 10-year auction drew the highest yield at that tenor since 2007 while the 30-year auction yield of 5.216% was the highest since 2001. New communication policies and the infrastructure overhaul at the FOMC may continue to make bonds jittery, especially as inflation remains above the loose target of 2%. However, there is more to watch with respect to the 30-year yield. Competition from hyperscaler issuance as well as the federal deficit are likely secular drivers of higher-for-longer interest rates on the long end of the curve.
From our Market Sense note published earlier this week: "This enormous deficit will need to be funded through debt, which itself limits the likelihood that recent shocks to the long end will mean-revert. According to the Congressional Budget Office, net interest payments are projected to exceed $1 trillion annually and reach roughly 3.3% of GDP by 2030 as federal borrowing and debt costs rise, and net interest is on track to outpace major federal spending categories like defense and nondefense discretionary programs. Since the majority of the CBO’s projected budget problems now regard servicing the debt, higher rates become self-reinforcing; higher rates mean more debt service, which means more term premium. That dynamic dampens historical mean-reversion capacity and results in a naturally higher floor for 30-year yields."
Strong participation in the US equity market rally is currently being masked by large variations in performance among some of the market’s largest companies, and this is leading to significant sector distortions. A whopping nine of 11 GICS equal weighted groups have outperformed cap-weighted peers. In 2026, equal weighted Bloomberg 1000 tech is up 35.7% -- second only to equal-weighted energy’s 35.8% leading gain among sectors, and much stronger than the 24% rise in the cap-weighted version of the sector. Meanwhile, communications’ mega caps have somewhat masked a broad-based drop in the sector, leading to a 2.9% drop in the equal weighted sector versus a 3.8% rise in the cap weighted version. So far in the third quarter, eight of 11 equal weighted GICS sectors are leading cap weighted peers. Health care (233 bps) and materials (228 bps) have outperformed cap-weighted brethren by the most this quarter.
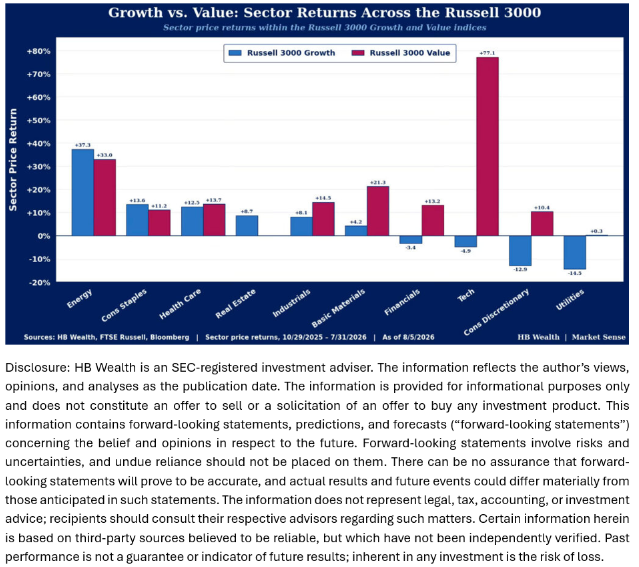
Think tech is the only reason growth is underperforming value this year? Think again!
Seven growth sectors have lagged value peers across the Russell 3000, hinting at a penchant for cheaper shares, not a slip up in a concentrated position.
@GinaMartinAdams
Join @PythonTrader and I for our US Equity Outlook webinar on 12/11 at 11am Eastern!
I'll be addressing the AI/Tech "bubble", how a more aggressive Fed could help small caps break out, and possible implications of a possible court reversal on tariffs.
https://t.co/JrBXZ3KVbA
In our part 2 of the What Makes A Bubble? series we examine prior melt-ups. Returns off the 2022 bear market low are tracking below both the lead up to the Great Depression and the internet bubble. Likewise, consensus EPS forecasts are stronger.
https://t.co/ltKPM4Tpwa
Perhaps the most compelling evidence against an AI bubble is coming from the IPO market. We've had just 93 new issues in 2025 and while they've posted strong gains, it pales in comparison with the 91% 1-month gain for 1999's 512 IPOs.
- Unprofitable small caps were bid to nosebleed levels back in 2000. We're at average now.
- More than 1/3 the US equity universe was comprised of zombies in '00
- Leverage ratios were 2x today's level. Now cash is king
So what gives?
With all the AI-bubble talk, I just keep thinking where's the froth? Market valuations are above norms for sure but Mag-7 is half the multiple of the Four Horsemen in 2000 (and its shrinking as earnings surge).
https://t.co/fzkGl0YzEd