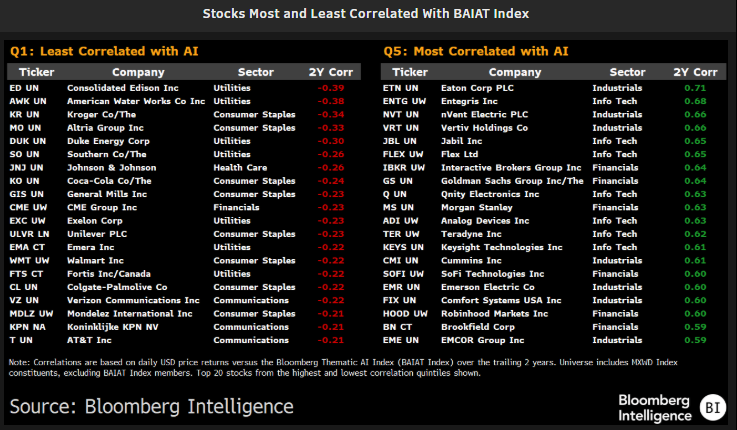
My Bloomberg Intelligence colleagues Jennie and Iza from our equity strategy team put out a note this morning on the stocks most and least correlated to AI. Here's a sample from the note with highest and least correlated quintile stocks:
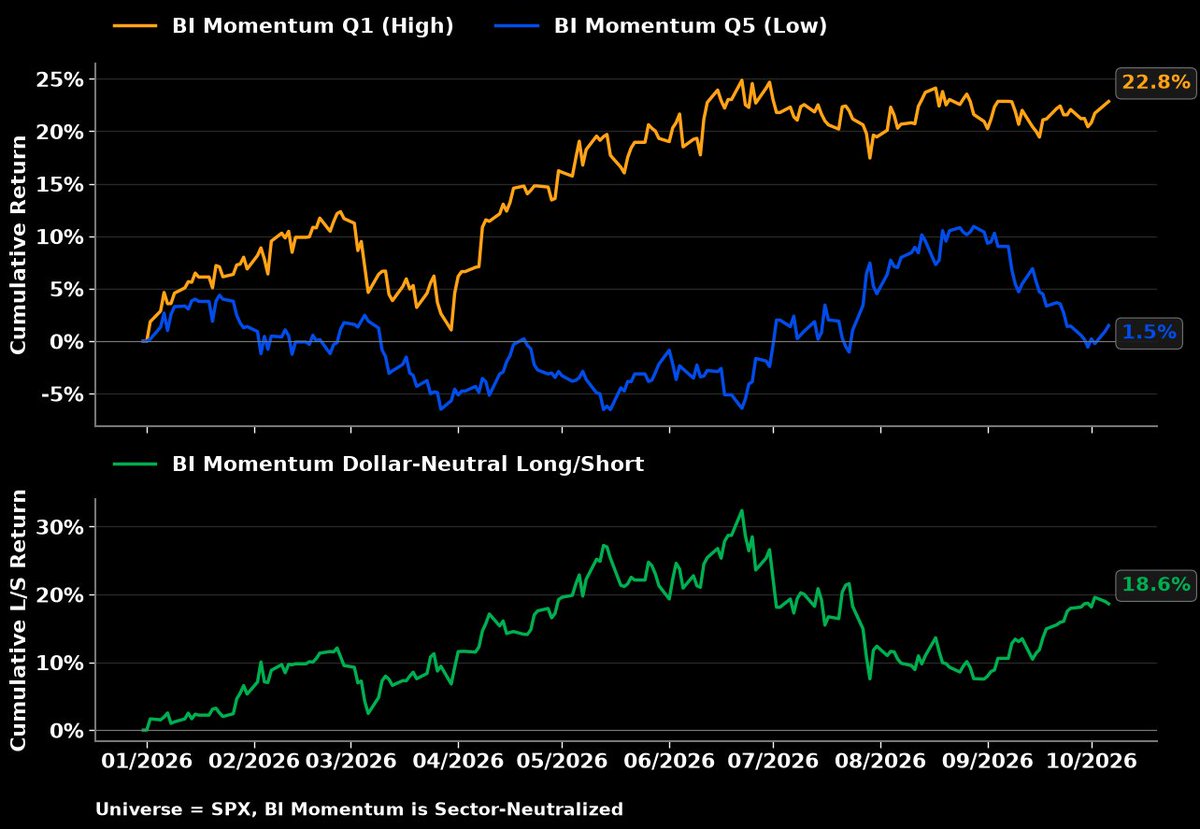
L/S momentum factor (S&P 500, sector-neutral) has retraced about half of its late summer situational awareness bloodbath.
Still up ~18% on the year tho
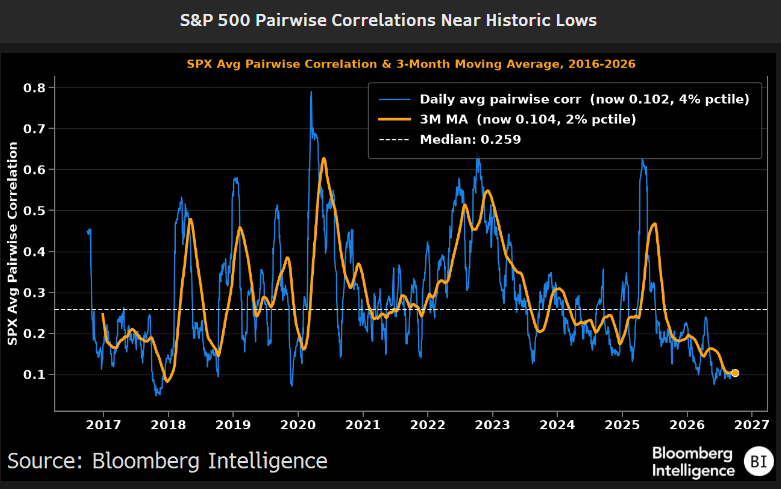
Average pairwise correlations near historic lows. Here we take the avg of trailing 30-day correlation readings using all possible combinations of stocks in the S&P 500 through time
Some weird stuff going on under the hood of the S&P 500 right now
None of this is necessarily bearish IMO, but worth watching:
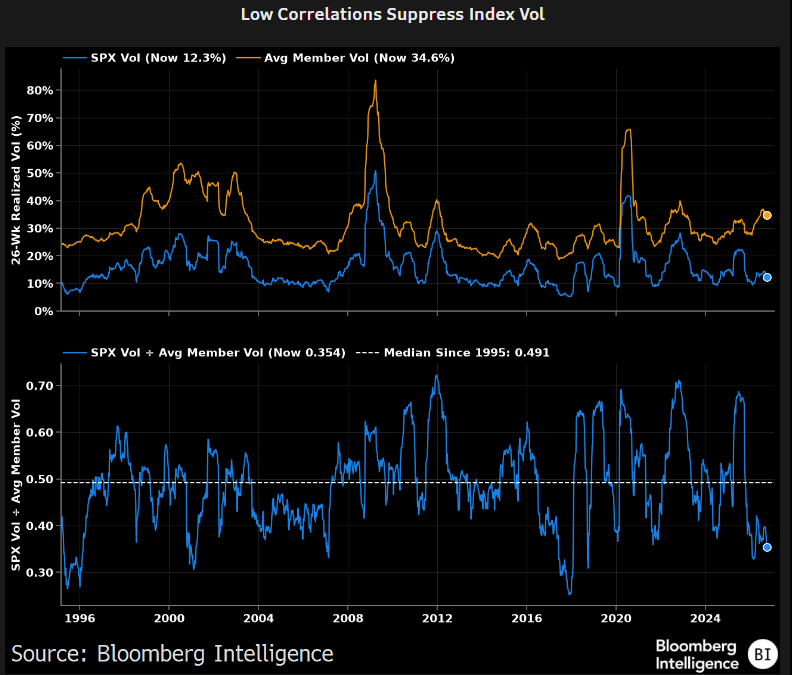
The index looks pretty calm. Underneath, stocks are increasingly doing their own thing.
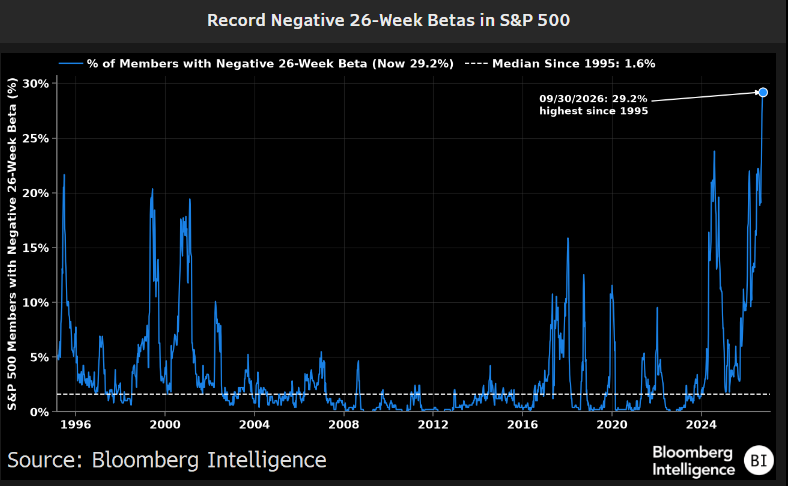
Record % of stocks with negative 26-week market betas:
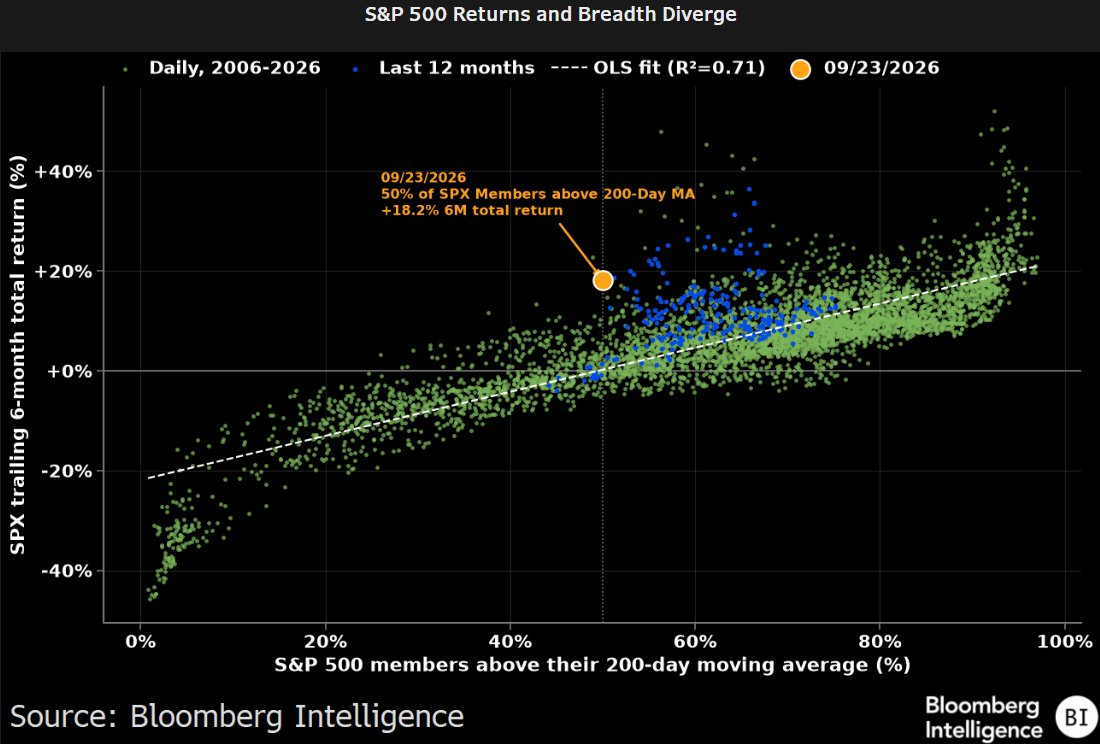
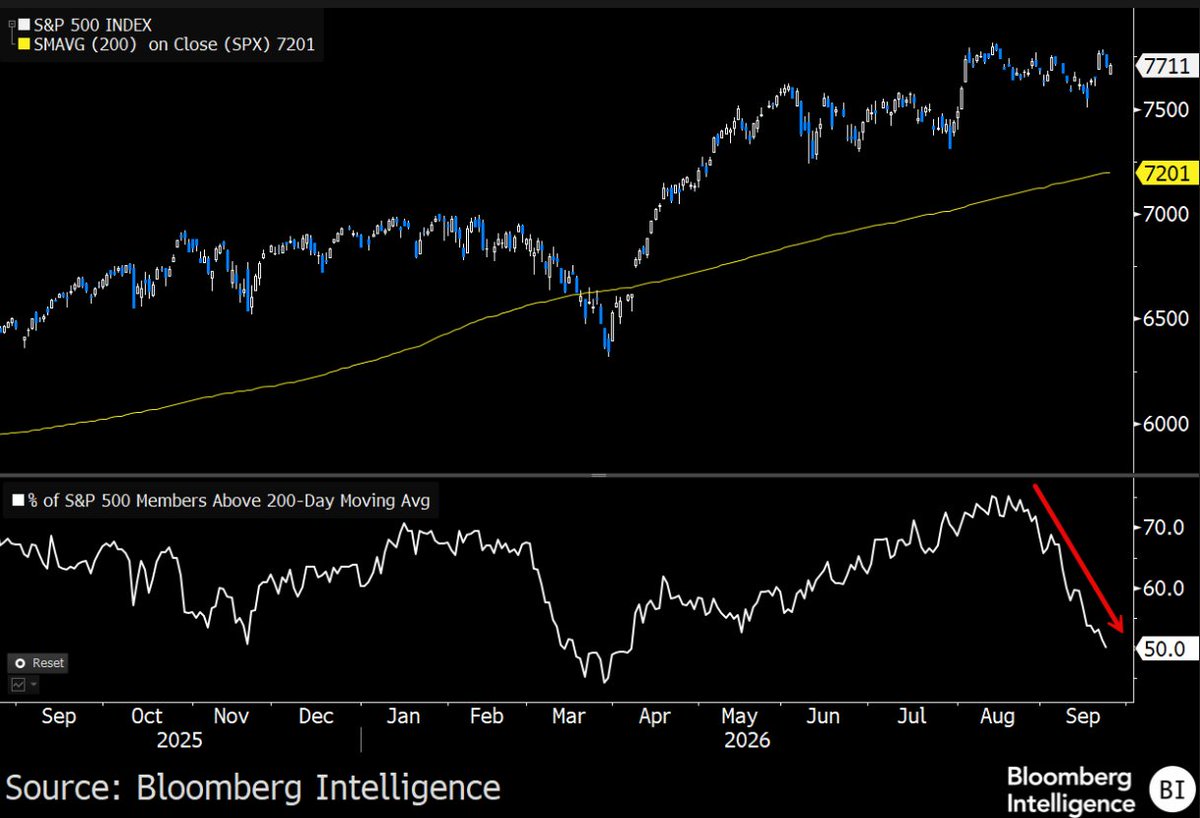
Breadth has been unusually narrow in the recent rally
Not enough to be bearish on its own IMO (we’re within 2% of ATHs after all), but something to watch
Historically, an ~18% 6-month rally would typically have ~85% of stocks above their 200-day MAs... today it’s more like 50%.
HELP WANTED: Bloomberg Intelligence is looking for a US Equity Strategist.. to write research notes on macro, large caps, sectors, fair value models, that kinda thing, and then go out and talk about it across media platforms. Based in NYC. Apply if you interested.. link in next post. FYI
The Fed bought corporate bonds though in 2020 didn’t they? Honest question did the rules need to change them to do that at the time? I feel like there’s bigger difference between buying treasury bonds and corporate bonds (which share more risk factor with stocks) versus corporate bonds and stocks.
@EricBalchunas I think they have to show that they’re willing to sell something so the credit rating agencies give them a better rating. Also, this headline is insane.
Value Factor valuation ratio, aka the ratio between the cheapest and the more expensive stocks, remains below averages. Cheap quintile in SPX trades around 13% the valuations of expensive.
Some S&P 500 valuation charts...
TLDR; SPX valuations aren't as crazy as they look at first glance
Big diff between market cap weighted and equal weight valuations (forward P/E). Ratio close to highest in this data. EW valuations are right around medians (compared to itself)
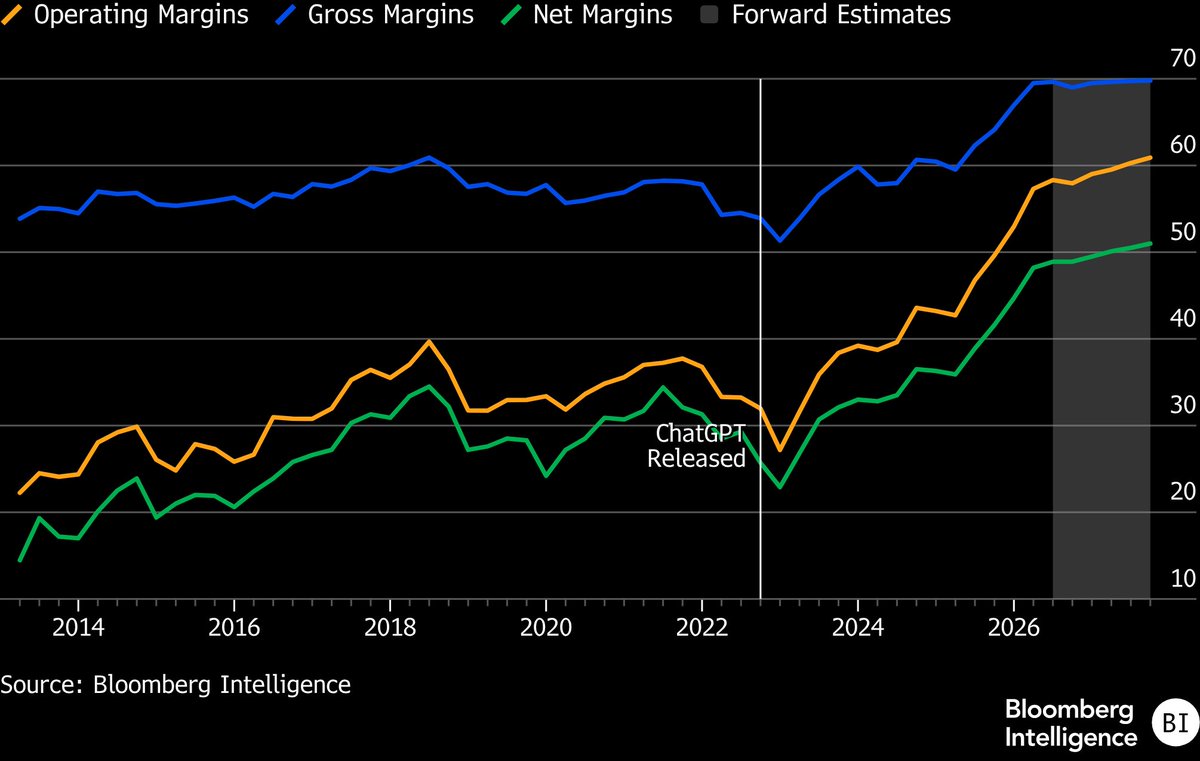
Same deal with margins. Forward profit margins highest since 2000. 67 months in our 316-month sample traded at higher valuations. However, those periods carried a median forward margin of just 12%, 340 bps below today.