I have gone a little crazy this time, I clean the lines up a little and I sort of extended it all the way back to 2019-2020.. GUESS WHAT?
BTC peaks, bottoms, resistance and support lines all match up quite well.
BTC is coded. This is too coincidence for it to move like this.
I had nothing much to do today so back to looking at some BTC charts and data points.
I had this thought of all the major support/resistance line patterns. If there were anything related to the current price action and the previous data points.
So what I did was just to draw up 5 parallel lines where support turned resistance or where resistance turned support. I just named them here as Major Trend 001-005. It draws points all way back to October 2023 but due to the screen size, I will show from April 2024 onwards.
It is really interesting to see the lines converges with the price actions 1 year ahead. As random as the movements are, we able to see some order in the overall movement. Its like decoding the matrix.
Not only it is respecting these trend lines but it is also moving along with the Fibonacci Retracement levels. Coupled with more indicators such as the moving averages, RSI, TSI, Stoch RSI, MACD, we can probably figure out and narrow down the possibilities of the moves. Making it more "predictable".
For instance at this moment today, if the MA50 breaks. 2 likely scenarios, a retest of lower Bollinger or the Major Trend 002 which also coincides with the 23.6% Fib levels. And if that is respected we could bounce and retest MA50 as resistance line.
And if today, we could see breakout, prices could be retesting upper BB which coincides with 0.0% Fib levels.
If anything, this 104k levels should be over by mid July 2025. Either BTC prices will trend lower to test Major Trend 001 or we will be moving towards Major Trend 003. All depends if prices respect or rejects Major Trend 002.
All major indicators are showing weakness in buys. MACD and TSI continues to extend widening below signal and trending to cross below 0. Stoch RSI down. RSI hovering below 50. If daily RSI can hold 42 levels, we will be safe.
Last $BTC session, we see prices dipped below February 2026 low. It was roughly at 60000.
You can see it almost hit my target on my purple line. $BTC managed to have a slight recovery.
Take note that $BTC have been trading 4 days out of 5 days extended out of the lower Bollinger band. Usually prices will get back within range but with there is a very high possibly it will be like this for another 4-8 days, judging from previous bear flag support failure.
I believe prices will not stop til 47-54k range is tested. Why that range? Well simple. The next 76.8% Fib Retracement support line will be here (47300) and the WMA300 (53800, at this moment).
$BTC does not have any other support levels at this range other than these 2.
Will the weekend give a little breather? RSI seems to plateau a bit. MACD still dipping but with a slight slow down. Gap between signal is very widen, normally indicating no slow down.
TSI similarly extending lower and gap with signal also expanding. These are my major technicals helping me gauge actual market sentiments.
My first target is the red circle and then I will assess my next move. $BTC will test my descending purple line at 57900.
Btw we are close to another crossing of my lines which is dated on 11.06.2026. Will this crossing now be significant as previous crossings?
Do take note on the weekly chart.
$BTC WMACD and WTSI are both still below 0 but above their signals. It will go below their signal by 3 days time.
Are you ready for what is about to happen?
WRSI is now sitting at 33 range.
And more importantly, WMA200 have been breached without any sign of retracement so far.
WMA300 to be tested?
Anyways I mentioned this morning, the dragonfly was a fake out.
lovely things are playing out as planned.
$BTC breached my line convergence point yet again. Still think they are imaginary? Seems coded. $BTC follows them, it is just we do not know how to read it.
We are seeing this dragonfly, but I am thinking its very deceiving dragonfly. If you are trading, trade carefully.
MACD shows a slight contraction, by ever so little, but do observe that the gap between the signal is very significant. Therefore, watch it closely if it should continue to move to expand downwards (which likely it will). My honest advice, do not short a bear market, we are probably just 50% along the way based on previous market trend.
Why $BTC follows this patterns? Its more centralised and captured that you think. The OGs are playing you out. I am referring to the core OGs, if it makes any sense.
RSI remains around 18. I will be holding my short position til we reach sub 50k, then I will analyse again if its fit to TP 50% or not.
asking for a friend, if Claude found vulnerability in $ZEC, will it also start finding vulnerability and exploits in all the other crypto projects?
$BTC?
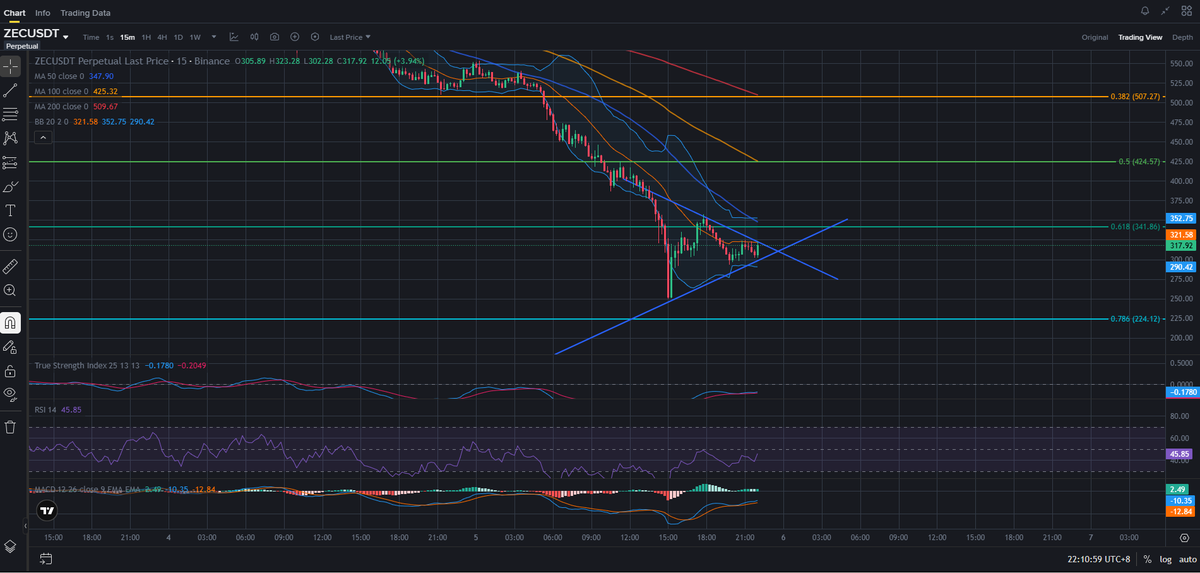
interesting formation for $ZEC on the 15m chart.
Everything moving so fast for $ZEC.
Trading under mid Bollinger and also below the 61.8% Fib Retracement.
It is also forming sort of a bear pennant? And technically HnS too?
I am guessing $ZEC could very well head back to sub $50 levels.