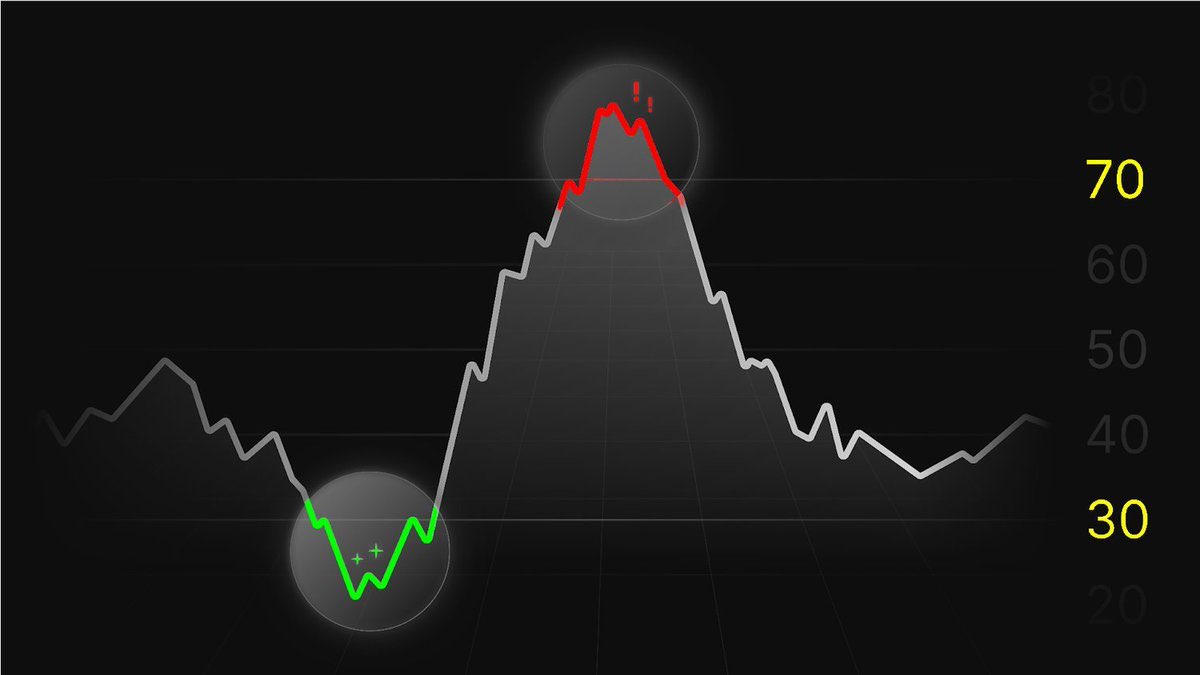
ALTCOIN SEASON WIRD AUSGERUFEN
Das Kursverhältnis von #Ethereum zu Bitcoin ist in der Nacht auf 0,0298 gelaufen, rund 16 Prozent über dem Tief vom 7. Juni. Auf dem Vier-Stunden-Chart sieht das aus wie ein sauberer Ausbruch über die Nackenlinie. Davor sind tagelang die Meme-Token gestiegen, jetzt ziehen die großen Namen nach.
Bei CT ist die Sache damit entschieden.
@TechCharts schreibt: "Nach langer Schwächephase hat Ethereum hier eine Chance gegen Bitcoin. Mögliche kurzfristige Bodenumkehr. Die Konsolidierung über der Nackenlinie ist positiv, sie muss halten, dann geht es weiter hoch."
@WhaleFactor legt die Stimmungsdaten daneben: "Das Verhältnis von positiver zu negativer Stimmung bei Ethereum hat gerade ein lokales Extrem erreicht. Jedes Mal, wenn die Angst der Masse im letzten Monat dieses Niveau erreicht hat, folgte eine scharfe Erholung."
@cryptorover sagt, worauf jetzt zu achten ist: "Behaltet die Altcoins im Auge, die über ETF-Produkte und Anträge institutionelles Interesse anziehen. Eine Verabschiedung des CLARITY Act könnte diesen Trend beschleunigen."
Am 1. Juli lag der Anteil von #Bitcoin an der gesamten Kryptomarktkapitalisierung bei 55,35 Prozent, dem tiefsten Stand seit einem halben Jahr. Heute liegt er bei 56,47 Prozent.
In genau dem Zeitraum, in dem Ethereum gegen Bitcoin elf Prozent gutgemacht hat, ist der Bitcoin-Anteil am Gesamtmarkt gestiegen. Das geht nur, wenn der Rest des Marktes in derselben Zeit schlechter lief als beide zusammen. Das Kapital verlässt Bitcoin also nicht. Es sortiert sich innerhalb der Altcoins auf immer weniger Namen.
Die Bewegung der letzten 24 Stunden zeigt dieselbe Enge. Der Meme-Sektor steht acht Prozent im Plus, der viermal so schwere DeFi-Bereich kommt auf gut zwei. Ganz vorne liegen die Hunde-Token und das Ökosystem einer Meme-Startrampe, ein Segment von 1,6 Milliarden Dollar. Das ist die Spitze der Risikokurve, und die bewegt sich in jeder Erholung zuerst - auch in denen, aus denen nie eine wurde.
Zwei Stimmen aus derselben Zeitleiste sehen das ähnlich. @bycoinhunter zählt es unter den größten Fehlern seiner acht Jahre am Markt auf: "Zu glauben, der Markt folgt einer festen Rotation. Erst macht Bitcoin ein neues Hoch, dann Ethereum, dann die Altcoins." Und @blknoiz06 erinnert an die Uhr: "Den Leuten ist nicht klar, wie lange wir schon in der Akkumulationsphase stecken. Seit dem größten Altcoin-Liquidationsereignis aller Zeiten sind neun Monate vergangen."
Bitcoin steht dabei selbst nicht unter Druck. Der Supertrend auf dem Tageschart zeigt weiter aufwärts, seine Linie liegt bei 61.172 Dollar und damit knapp sechs Prozent unter dem Kurs von $BTC. Wenn Bitcoins Trend intakt bleibt und die Altcoins trotzdem anziehen, ist das eine Rallye auf Bitcoins Rücken. Altcoin Season fängt klassisch anders an: Bitcoin bleibt stehen, und das Geld zieht weiter. Bitcoin bleibt gerade nicht stehen.
Ein Einwand bleibt, und zwar die Reihenfolge. Das Kursverhältnis dreht in aller Regel früher als die Dominanz. Dass beide Zahlen noch auseinanderlaufen, kann deshalb auch bedeuten, dass hier schlicht zu früh gemessen wird.
Für einen Horizont über Quartale ändert der Sprung ohnehin wenig. Der Kurs von $ETH liegt bei 1.940 Dollar, das Verhältnis zu Bitcoin bei 0,0298 - am 29. April stand es bei 0,0299. Drei Monate, eine Rundreise. Was auf dem Vier-Stunden-Chart wie ein Ausbruch aussieht, ist auf Quartalssicht die Rückkehr an den Ausgangspunkt.
Die Zahl, an der sich die Frage entscheidet, steht bei 55,35 Prozent. Fällt Bitcoins Marktanteil unter dieses Julitief und bleibt darunter, während die breiten Sektoren mitlaufen statt nur die Hunde-Token, dann ist sie beantwortet.
Bis dahin trägt Bitcoin diese Bewegung. Und was an der Spitze der Risikokurve zuerst gewinnt, gibt dort auch zuerst wieder ab.
🚨 BITCOIN IS BEING MANIPULATED, AND I HAVE PROOF
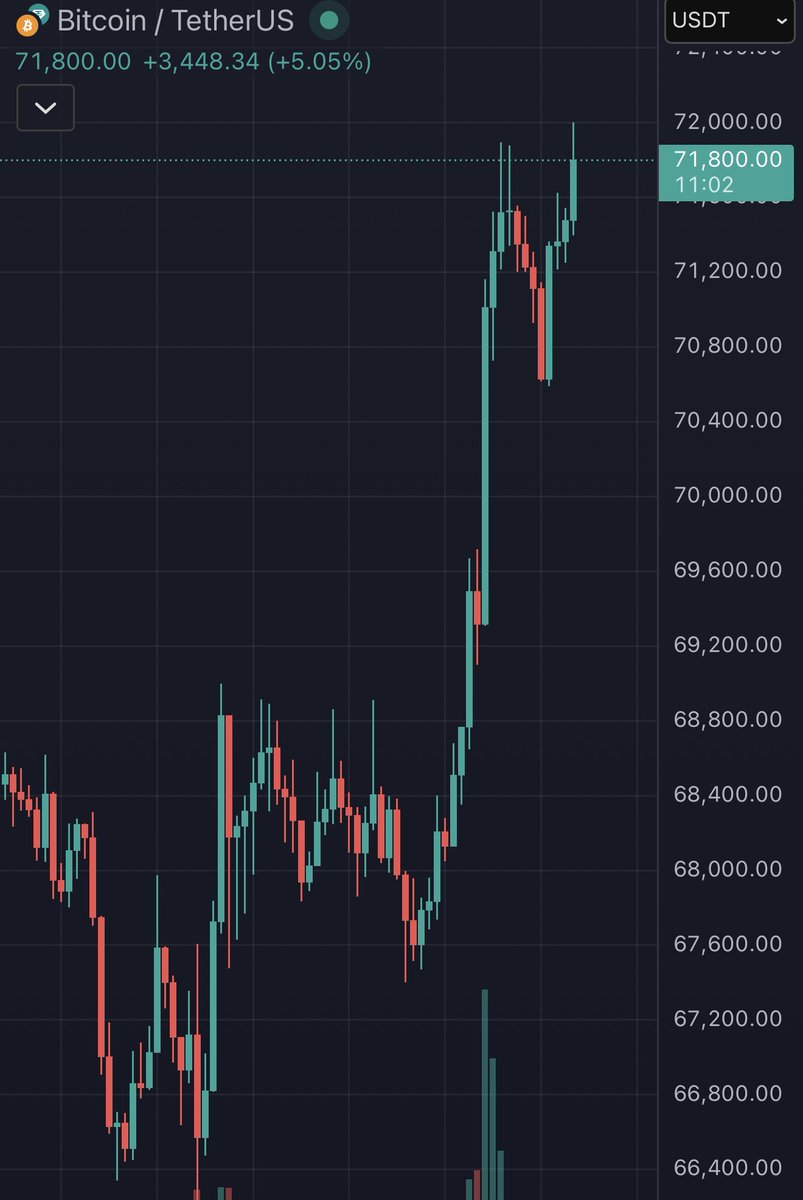
Everyone is talking about how Bitcoin went up $5,000 in 10 minutes.
Everyone’s posting about it…
But almost nobody is explaining what actually caused it.
Stop staring at the chart. Look at the flows.
Within minutes, wallets tied to Wintermute, Binance, Coinbase, and ETF-linked addresses all became active simultaneously.
Large blocks moving between exchanges.
MASSIVE market buys hitting thin order books.
Then suddenly…
THEY FLIPPED AND STARTED SELLING EVERYTHING.
Here’s what really happened:
– Liquidity was thin
– Leverage was stacked heavily on one side
– Funding rates were already stretched
So price gets pushed higher aggressively.
Why?
To trigger FOMO and, more importantly, force shorts out while pulling new longs into the market.
Once enough leverage was trapped…
They started unloading.
The data shows it clearly:
– Coordinated inflows to major exchanges
– Large market buys clustered within a narrow window
– Immediate reversal after stop levels were cleared
– Heavy selling right after liquidation zones were hit
This is how INSIDERS DUMP without crashing price.
They move the market toward liquidity, trigger liquidations, and then sell directly into the chaos they just created.
And it wouldn’t surprise me if they were running long and short positions simultaneously through separate wallets.
If you’re new to this market, understand one thing:
Bitcoin almost never moves like this because of headlines.
It moves when leverage builds up and someone with enough size decides it’s time to wipe everyone out.
Watch funding rates. Watch open interest. Watch where coins are moving, not who is posting charts.
For the record, I was the only one publicly calling the exact bottom at $16,000 three years ago and the top at $126,000 in October.
If you missed those calls, don’t worry. I’ll call the next one too.
Turn notifications on. If you’re not following yet, you’ll understand why that was a mistake later.
🔴 ACTUALIZACIÓN $BTC 1D - 4H ✍️
Llegó el movimiento trampa, llegaron las manipulaciones 💀
¿Te crees esa subida? Se sincero.
Acceso gratis al VIP abajo 👇
🚨 BIG WARNING: THE US ECONOMY MAY BE ENTERING A RECESSION
And markets are already reacting to it.
Right now, stocks and crypto are both falling sharply, and many people think this dump has no clear reason.
But if you look at the economic data coming out of the US, the weakness is becoming very visible, and that is what markets are pricing in.
First signal: Job market is cracking.
In the latest data, more than 100K job cuts were recorded in January alone. This is the highest level of layoffs in January since 2009, the same period when the US economy was in recession.
At the same time, JOLTS job openings came in much lower than expected.
New job openings are now at their lowest level since 2023.
This means companies are not hiring and are instead cutting jobs, a clear sign that business conditions are weakening.
When hiring slows and layoffs rise together, consumer spending usually falls next.
Second signal: Stress in the tech credit market.
A large portion of tech loans and bonds are now distressed.
• Tech loan distress ratio is around 14.5%, the highest since the 2022 bear market.
• Tech bond distress ratio is near 9.5%, the highest since Q4 2023.
This means many tech companies are struggling to service debt.
When companies face debt stress, they cut costs, freeze hiring, and reduce spending, which slows the overall economy further.
Third signal: Housing market demand is collapsing.
Home sellers in the US have now outnumbered buyers by about 530,000, the biggest gap ever recorded. This shows demand is weak.
Housing is one of the largest parts of the economy.
When housing slows, it affects construction, banks, lending, and consumer confidence; all recession linked sectors.
Fourth signal: The Fed is not easing yet.
Despite economic weakness, the Federal Reserve is still maintaining a hawkish stance. Rate cuts are paused, and near term cuts look unlikely.
This means liquidity is not increasing, which makes economic stress worse instead of better.
Fifth signal: Bond market is flashing recession warnings.
The US 2Y vs 10Y yield spread has moved to its highest level in four years, a move known as bear steepening.
Historically, this shift has happened before recessions.
When you connect all the dots, the picture becomes clear:
• Job cuts rising
• Hiring falling
• Corporate debt stress increasing
• Housing demand weakening
• Fed staying hawkish
• Bond market signaling recession
Markets are not dumping without reason. They are reacting to growing signs that the US economy is slowing down and may be moving toward a recession phase.
🔥BOMBAZO🔥
ESTOS GRÁFICOS MUESTRAN MÁS DE LO QUE PARECE
¿Qué podría pasar con BTC, ETH y las ALTCOINS según el ANÁLISIS TÉCNICO⁉️
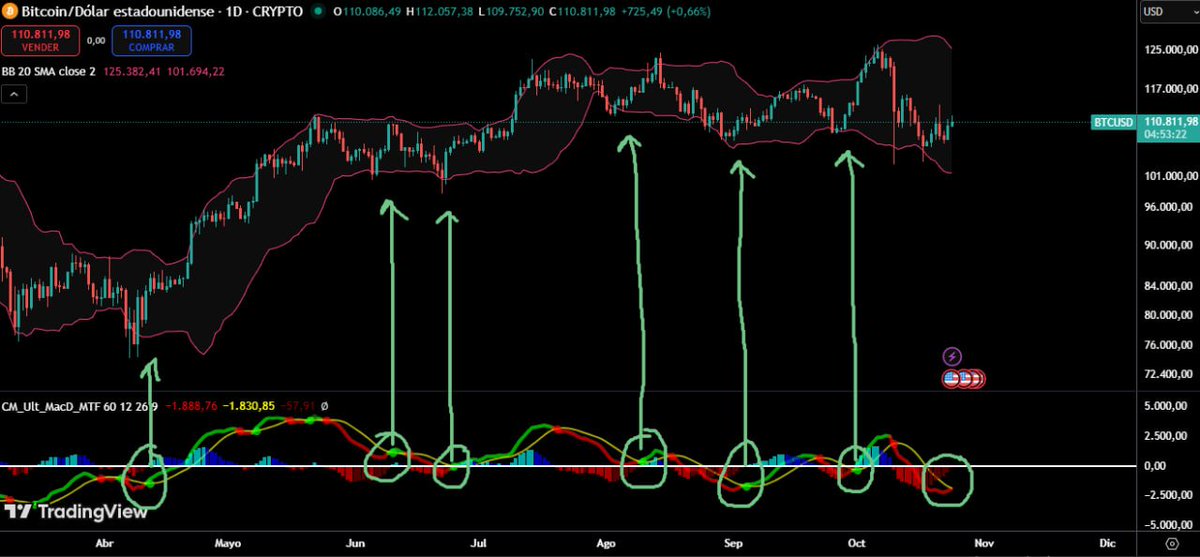
🎯#Bitcoin en su temporalidad DIARIA tiene un MACD dando SEÑAL DE COMPRA
-Las últimas 4 veces que se vio esta señal $BTC subió con fuerza a los pocos días
🎯#Ethereum también está dando SEÑAL de COMPRA en el MAC D diario que anteriormente anticipó subidas
-A su vez, John Bollinger, creador de las Bandas de Bollinger, afirma que el PATRÓN de las Bandas es ALCISTA para $ETH
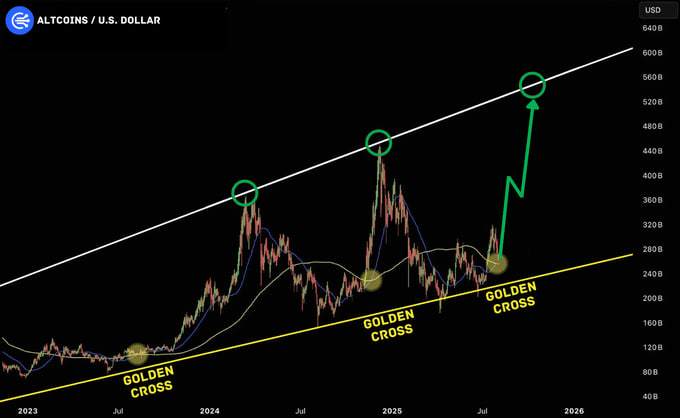
🎯El gráfico del market cap de las ALTCOINS en temporalidad semanal acaba de tener un GOLDEN CROSS
-Las últimas 2 veces que se vio esto fue en los INICIOS DE LAS 2 TEMPORADAS DE LAS ALTCOINS pasadas
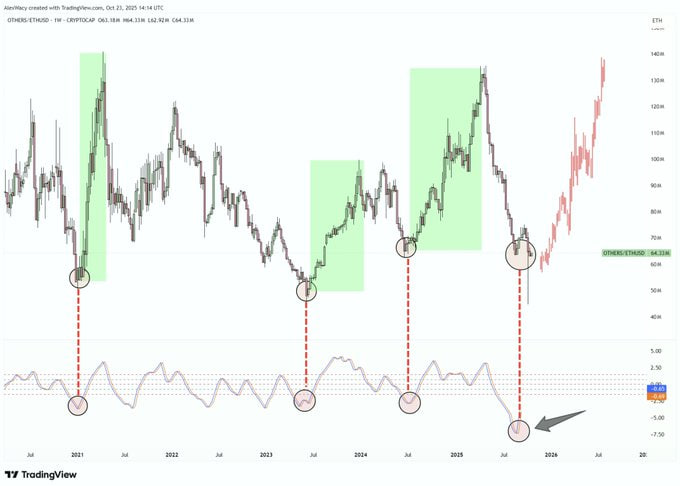
🎯El GRÁFICO de las ALTCOINS/ETH alcanzó su nivel de SOBREVENTA más BAJO de la HISTORIA
-Esto quiere decir que la PRESION VENDEDORA podría estar llegando a su FIN
📍Todos estos gráficos plantean un BUEN PANORAMA TÉCNICO que se podría potenciar con el PANORAMA FUNDAMENTAL
Gráficos: @cryptogems555@wacy_time1
🔥ATENCIÓN🔥
ESTO ES LO QUE MUCHOS NO TUVIERON EN CUENTA DEL RECORTE DE TASA DE LA FED.
🧨La FED recortó en un contexto HISTÓRICO y ya se siente en los mercados financieros
💥Powell defendió la decisión de recortar pese a que las acciones están en MÁXIMOS HISTÓRICOS
💥Ante la pregunta por una "burbuja" respondió que su FOCO es contener INFLACIÓN y el DESEMPLEO, no el mercado
¿Qué otros datos tenemos en cuanto al recorte⁉️
🔹El recorte de ayer marca la PRIMERA VEZ en +30 años que la FED baja tasas con la inflación PCE CORE en 2.9%+
🔹2025 es el 3º año desde 1996 con recortes en máximos del SP500 (los otros: 2019 y 2024)
🔹Históricamente, cuando la FED recorta con el SP500 a menos de 2% de sus ATH, el índice sube +14% promedio en 12 meses
👉La FED está profundamente DIVIDIDA:
-9 de 19 miembros quieren 2 recortes más en 2025
-6 no quieren ninguno
-2 quieren 1 recorte
-1 quiere 5 recortes para este año (Stephen Miran, designado por Trump)
-1 quiere 1 AUMENTO
👀Esto refleja el dilema de elegir entre un mercado laboral débil y una inflación persistente
¿Qué implica esto para CRIPTO⁉️
▪️El mercado descuenta 4 recortes adicionales hacia septiembre 2026, lo que significa MÁS LIQUIDEZ
▪️Ese entorno es combustible tanto para acciones como para #Bitcoin y altcoins
▪️La historia muestra que, pese a la volatilidad de corto plazo, estos ciclos impulsan a los activos de riesgo
📍La FED priorizando el EMPLEO sobre la inflación podría sostener la narrativa alcista
Fuente: Bloomberg e Investing
⚠️ATENCIÓN⚠️
💣Por este motivo, Bessent afirma que Trump podría declarar una EMERGENCIA en el mercado inmobiliario (la situación es PEOR que la del 2008)
💰Recuerden que Bessent también anticipó que se estaban preparando para estimular la economía hacia fin de año
¿Qué está pasando con el REAL ESTATE y qué riesgos hay ⁉️ Te explico 👇
🏢 Estamos ante un colapso silencioso del real estate comercial
▪️Los edificios de oficinas están vacíos
▪️Las hipotecas no se pagan
▪️Las ciudades pierden ingresos
▪️Y los contribuyentes están quedando como garantes del desastre
¿Cómo funciona esto⁉️
1️⃣ Todo arranca con la deuda:
▪️Los dueños de edificios piden préstamos para comprar más oficinas y edificios
▪️Esos préstamos se agrupan y se venden como bonos llamados CMBS (Commercial Mortgage-Backed Securities)
2️⃣ Estos bonos se dividen en "tramos" o "tranches" según el riesgo:
🔸Los tramos superiores (AAA) cobran primero
🔸Los tramos inferiores absorben las pérdidas
🔸Cuando las oficinas no pagan alquiler, los pagos a los tramos más bajos desaparecen. Y eso es lo que ya está pasando.
¿Por qué el tramo AAA cobra primero⁉️
-Porque el diseño del CMBS está hecho así a propósito, para que los inversores más conservadores compren los tramos AAA con la seguridad de que van a cobrar
-En otras palabras, cuando los inquilinos pagan sus alquileres, ese dinero va primero a los tramos AAA
-Si sobra, se paga a los tramos AA, luego A, etc.
-Si los pagos no alcanzan, los tramos más bajos dejan de cobrar primero
-Ahora bien, cuando vemos que incluso los tramos intermedios empiezan a fallar, es señal de que la base del sistema se está deteriorando seriamente, como está ocurriendo ahora con los defaults récord en CMBS.
3️⃣ En agosto, el 11.7% de los CMBS de oficinas estaban en default o mora (NO SE PAGABAN), un récord histórico
▪️Ya se superó el pico de la CRISIS FINANCIER de 2008 (10.7%)
▪️Hace solo 20 meses, la mora era de apenas 1.6%
4️⃣ La demanda de oficinas se desplomó
▪️Ciudades como SF, LA y Chicago tienen +30% de vacancia
▪️El trabajo híbrido llegó para quedarse
▪️Las empresas no necesitan tanto espacio
▪️Se da el fenómeno de “flight to quality”: las empresas que alquilan, lo hacen en edificios nuevos
▪️Los más viejos se vacían y se deprecian
5️⃣ Ranking actual de morosidad en real estate comercial:
▪️Oficinas: 11.7%
▪️Multifamiliares: 6.9%
▪️Hoteles: 6.5%
▪️Retail: 6.4%
▪️Industrial: 0.6% (único sector estable)
6️⃣¿Quién tiene esta deuda⁉️
▪️Los bonos CMBS se vendieron a fondos, aseguradoras, etc.
▪️Los bancos ya se la sacaron de encima
📍El 11.7% de morosidad en oficinas es un dato PEOR que el del 2008
¿Crees que la administración de Trump se prepara para INYECTAR LIQUIDEZ para evitar un colapso ⁉️
Fuente: Wolfstreet
Altseason Money Flow:
ETH> Major Caps > Mid and Micro Caps> Crash
This is outdated.
The money flow cycle has completely changed. Here's a Full Guide🧵: